

Wind Map
If you study Earth’s surface and look at details in it’s form, there are obvious patterns. Arcing patterns of mountain ranges and island chains, strange swirls and looping cracks on the ocean floor, and on close inspection there is harmony in the shape of mountains and other terrain. Sometimes it’s geometric, with triangles, arcs and star patterns, but usually it’s more fluid, like a crazy paisley.
Consensus thought is this results from a series of unrelated events that occured over billions of years, driven by the slow churn of Earth’s crust sub-ducting the continental plates, and the constant wear of erosion. EU thinks it didn’t happen that way. We think it was caused by electricity, and the patterns we see make more sense if viewed in the context of our theory.
The face of the Earth was shaped by three primary means: volcanic eruption, lightning, and wind. It occurred in primordial storms which ionized the atmosphere, charged the ground like a battery, and discharged energy the same way we see today: earthquakes, volcanoes and storms. Only these storms were beyond biblical. They occurred before Man arrived. What we are talking about today are the storms of creation, which shaped the face of the planet.
Because wind played the biggest role in laying and piling the sediments we live on, its effects are most visible. The evidence is in supersonic shock waves imprinted on the land. Once you start recognizing the characteristics of wind-formed topography, it becomes impossible to ignore.
To identify wind direction, look at mountains. Mountains (not volcanoes) are all essentially wind blown dunes. With exceptions for shifting wind conditions, a mountain’s shape will show a windward and leeward side like a dune. The leeward side is generally steep and slab sided, and the windward side dips at shallower slope.

The windward side actually portrays the shape of the wind itself, as pressure waves undulate across movable sands and mold them.

If the wind reaches Mach speed, standing shock waves reflect from any protrusion in the wind’s path, causing a sharp change in wind direction. Distinct patterns form at this crease, where the wind direction changes abruptly. The reflected standing shock wave forms a fan-shaped interference pattern of compression and rarefaction. This pattern can be found on most mountain forms, including cordillera mountain arcs, continental divides, lone inselbergs and basin and range.


Dust laden supersonic winds deposit their heavy cargo where the crease in the wind forms. A tetrahedron-shaped zone of rarefaction (low pressure) develops at the root of the standing wave, called a “separation bubble”. Wind-born dust collects in this bubble as the wind deflects upward with the shock wave.

As material deposits in the separation bubble, it forms a new barrier to deflect the wind, which moves the standing shock reflection backwards, into the wind. The separation bubble migrates into the wind with the shock wave, causing new dust to overlay the old in layers that stack into the direction of the wind.

The shock wave is a discontinuity in density, temperature and ionization. Remember, we are talking about a primordial storm where much of the atmosphere ionized. So, standing shock waves reflected from the ground, back into the clouds, providing a path for discharge. The separation bubble is not only a pressure sink, which collects heavy matter, it is also a current sink, being the lowest potential region connected to the high potential current in the reflected shock wave. It therefore draws current to bake, compress and fuse the deposited dust.
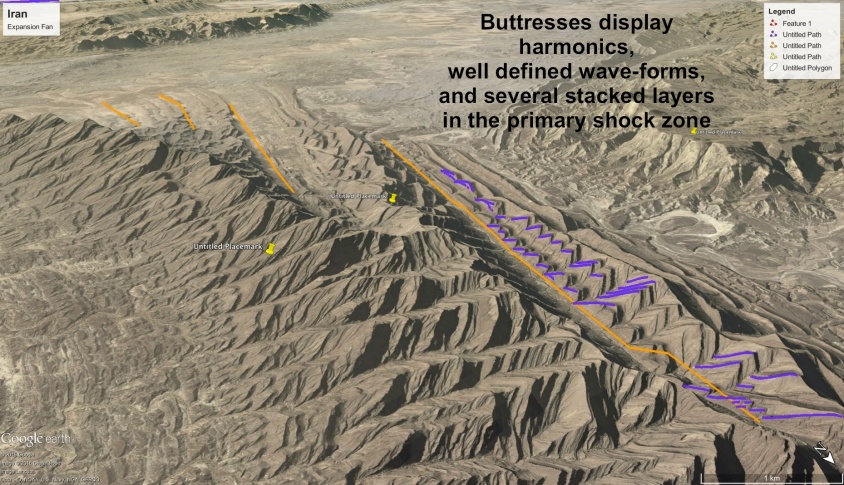
It creates a distinct pattern on the windward side. Dragon’s teeth – triangular buttresses, sometimes called flat-irons, formed by the sonic, ionized shock waves of supersonic winds. They rise and fall in amplitude and wavelength, and display harmonic frequency shifts, as well as many, many other features which could only be produced by the sonic effects of supersonic winds – see the “Arc Blast” and “Monocline” articles for more detail.


The Mexican Kink
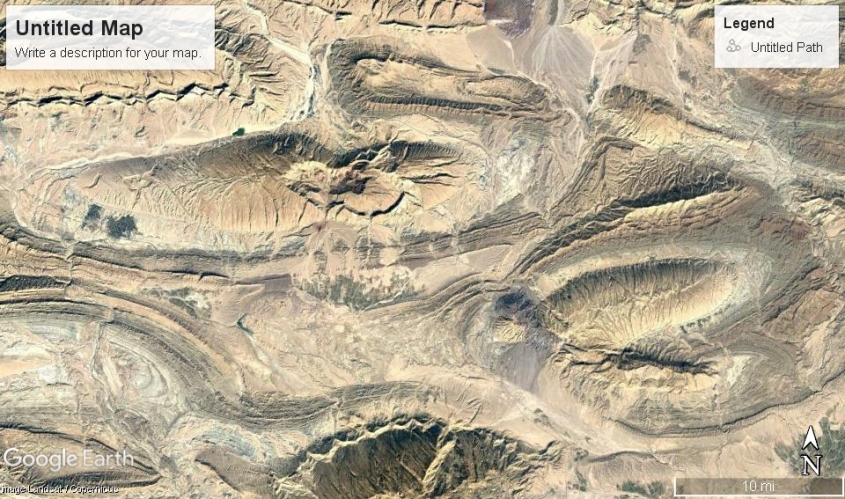
Understanding how winds form these shock patterns, and examining the result on the landscape reveals a wealth of information. Let’s consider this very simple dune, called El Guaje, in the Sierra Oriental mountains of central Mexico. The shock pattern of triangles is very apparent on it’s windward side.

The next annotated image of El Guaje highlights four consecutively formed pressure ridges that are visible. The first (green) is almost buried by later deposition and only the tops of it’s buttresses are exposed. The second (yellow) is a minor ridge caused by a period of weaker winds. It is also partially buried by the third, and largest ridge (red).

Large triangular buttresses at one end of the large (red) ridge shrink in amplitude with geometric progression until they almost vanish, indicating the jet-stream velocity transitioned from supersonic to near subsonic velocity along the wind-front of this dune. The faster jet-stream region advanced the growth of the dune, depositing material faster and pushing the shock-wave into the wind. It advanced the ridge line into the wind (violet) and built this portion of the mountain thicker, taller, with large amplitude reflected shocks forming bigger buttresses.
Each layer of the buttresses is formed by a new shock front from winds impinging on the last layer. New shock fronts formed as the winds gusted, piling new layers on the old. A final diminishing wind created a fourth shock front which deposited a small pressure ridge (purple) along the foot of the mountain. The highlights obscure natural features, so please contrast all annotated images with the first, naked image.
The winds that created these ridges were like any storm, just quite a bit more violent. They stiffened as the storm grew, reached a crescendo with electrically charged, gusting blasts at Mach speeds, and then ebbed away. Their formation precludes any notion that the winds that created them were caused by meteor or comet. A large impact might produce supersonic, dust laden winds, but they would crest with the first shock wave and then dissipate, not slowly build to a crescendo.
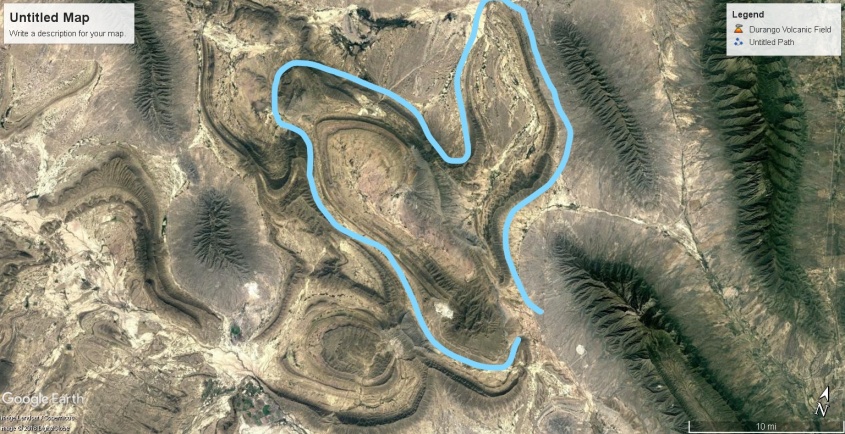
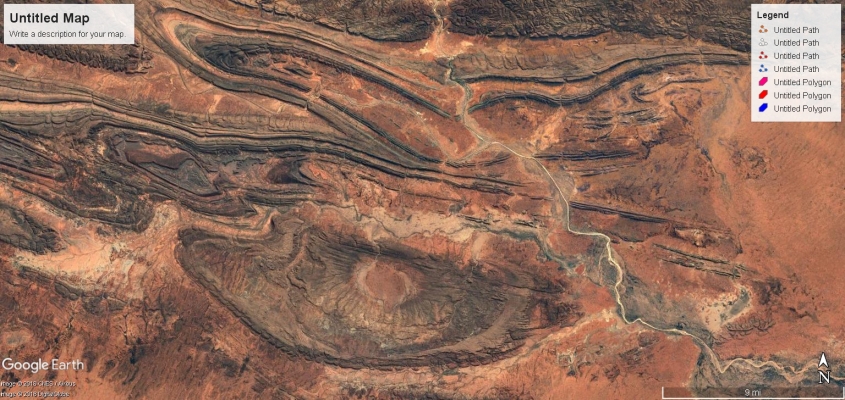
Take a look at the surroundings of El Guaje ridge, and it becomes even more apparent how it was made. It is part of a larger structure – an oblong crater, two hundred feet deeper in the center than outside the rim. The pressure ridges, including El Guaje, form the rim of the crater.

It wasn’t made by an oblong meteor. This is the result of a down-burst wind. The pressure ridges are the rims of the crater, with triangular buttresses showing the wind direction as it blasted the Earth, like a blow torch, and blew out radially, depositing dust along the standing shock waves it created. The outward blast is interfered at the top end by two, round mountains formed by lightning discharge which altered the wind flow around them.

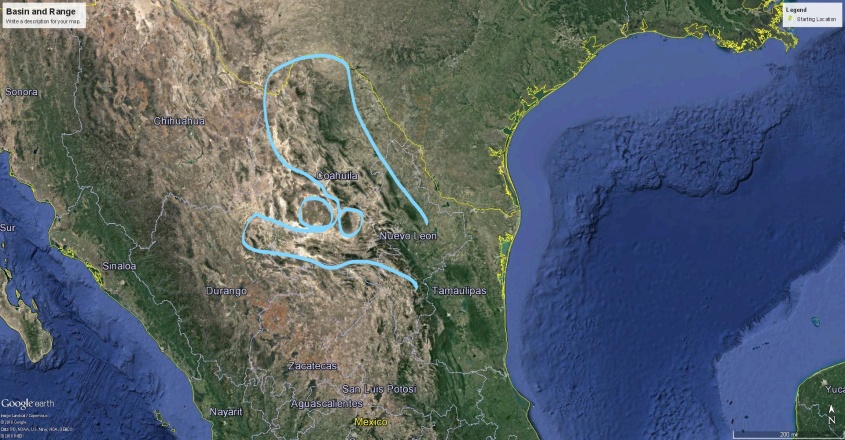
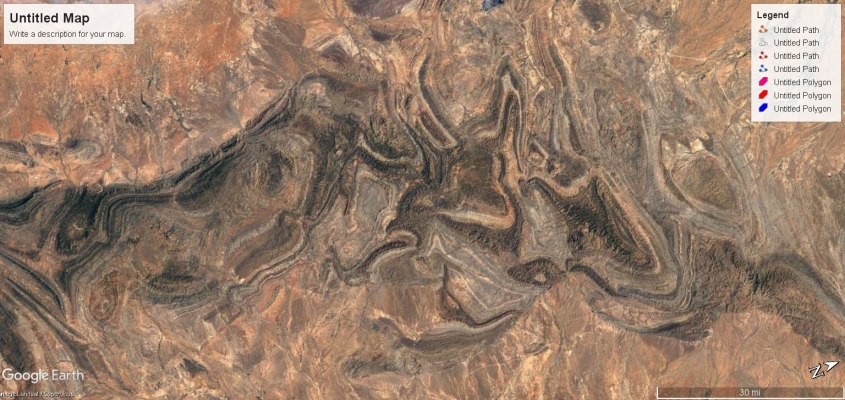
Taking another step back reveals this entire mountain region in Mexico is shaped by a turbulent shear zone in the wind. These mountains were formed by uni-polar winds, screaming from the south, and mixing into plasma storms along the shear zone with opposite polarity winds screaming the other direction. It is eerily similar to the turbulent shear zones adjacent to the Great Red Spot, creating kinked circulations that have a crab-claw shape. I call this the Mexican Kink.


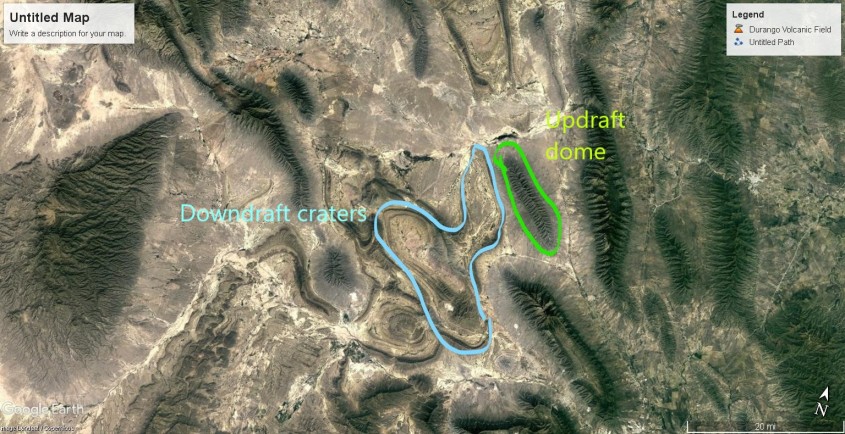
Turbulent winds fold back and forth to make these kinks, but they also fold up and down and twist into tornadoes, blowing and sucking at the land. In turbulent zones, the downdrafts form cyclones that are often stretched out-of-round into oval, polygonal and U-shaped structures. The winds are electric currents, so these turbulent kinks are semi-steady-state, keeping their form a long time, molding the land.
Downdraft turbulence also means updraft turbulence. So next to downdraft craters in Mexico are mountains formed by updrafts. Updraft wind will create a dome or ridge of layered deposit with a rim around it also, but the inflow to the updraft leaves triangular buttresses from shock waves on the outside of the mountain, pointing inward.

The updrafts deposit linear and lobe shaped mountains around and between the downdraft craters. The turbulence is in a shear zone, so deposits occur in narrow lanes between conflicting winds. Updraft deposits are composed of more material than craters and have the triangular patterns of shock wave reflections on the flanks.

As it relates to clouds on Jupiter, a long, rising column like the one highlighted below would create such linear mountains. One can see the dark depths of the hole in the clouds from which the updraft column rises. The winds roll upward from the ground and curl over, leaving a broom-swept linear ridge on the land below.


The turbulent kinks are fractal forms, so taking another step back reveals the fractal crab-claw shape emerging at a larger scale. The smaller feature with the crater shown above is nested within this larger repetition of the wind pattern shown next, aligned along the same axis. Nested fractals are very evident in Jupiter’s clouds as well.
The similarity between Mexico’s mountains and Jupiter’s clouds is due to capacitance in the planetary circuits. The strongest winds are vertical winds driven by the electric field.
Following is a sample of images taken from the southern leg of storm centers that molded South America, Australia, Africa and Eurasia. The winds pushed and pulled on the land with electric force, literally molding it from wind action above and volcanic action below.
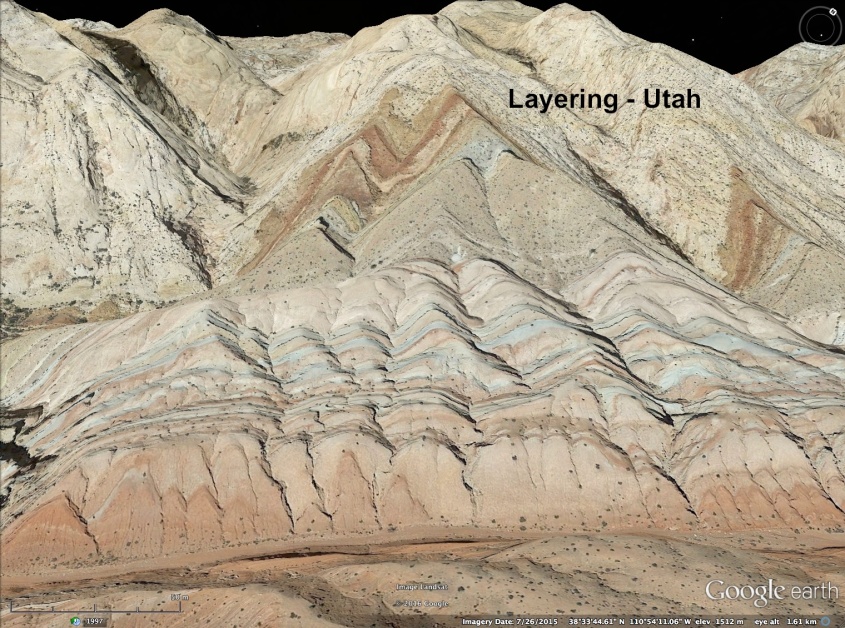
The fluid shapes are a dead giveaway for magneto-hydro-dynamic forces. But deeper levels of evidence are there, in Mach speed sonic shock effects, arcing effects and sputtering effects that provide a holistic electric picture of everything that happened. Look close at the following images and note patterns of stratification and liquid deformation evident from waves of heat and pressure.


Turbulent winds lifting off the land, arcing across the sky, and returning in downdrafts were filaments of plasma that varied in charge density in cross section. Take note how a tornado is a coaxial circuit, with the outer wall of the tube being the fastest, most dusty region, and the inner core often a clear draft. The plasma filaments of primordial storms varied in dust content, charge density, and velocity in cross-section, as well.

The result is stratification of mineral deposits vertically, where rock morphology and mineral composition discretely change from the core of the feature, to the walls of the feature and then to the outer surroundings.
The following images show where the storm pulsed and ebbed with current, stratifying layers of dust with different composition from inside-out, where coaxial up-and-down draft winds created domes and craters.


Layers of varying mineral composition are particularly evident where winds abruptly changed direction, from horizontal to vertical at the rim of craters and the buttressed flanks of mountains. There, charge densities in the shock waves and the effects of magnetic pinch were greatest.

The stratification of species within the electric winds of Jupiter matches the pattern of stratification in land forms. They are coherently layered from the inside-out of each turbulent kink, or vortex, unmixed by the turbulence, in accordance with charge densities in currents primarily moving up and down.

That electromagnetic fields sort species and recombine them is predicted behavior in plasma. We use a multitude of techniques in manufacturing based on this fact. Different materials respond to magnetic fields differently. The electric field responds to charge density, so shapes itself around conductive flows of material, and vice-versa. The result is stratification, and it’s apparent the stratification on Earth’s landscapes matches the stratification in Jupiter’s winds.

Some mountains do not conform to the wind-blown dune shape, exhibiting triangular buttresses on both flanks of the mountain, or not conforming to the windward/leeward angle of slope. This does not mean they are not dunes, but indicates they were formed subject to shifting, or competing winds.
In some cases, mountains formed as sastrugi, or linear deposits parallel to the wind in the shear zone between channels of wind of different velocity.

So, it is possible by looking at the land to deduce wind patterns. Following this method, the next image shows the Colorado Plateau with wind formed pressure ridges annotated by blue lines. These are pressure ridges formed perpendicular to the wind. Each line is drawn parallel to a pressure ridge, and perpendicular hash marks indicate wind direction. Red lines indicate pressure ridges formed parallel to the wind, at shear zones between conflicting winds.

This provides one layer of dimension to the storm. To add another layer, we can look at the domes and craters formed by updraft and downdraft winds.

Red areas are updrafts, yellow are downdrafts, blue are precipitation footprints. Adding this layer of information to the map of pressure ridges, produces a wind map of the Colorado Plateau and Rocky Mountains that looks like this:
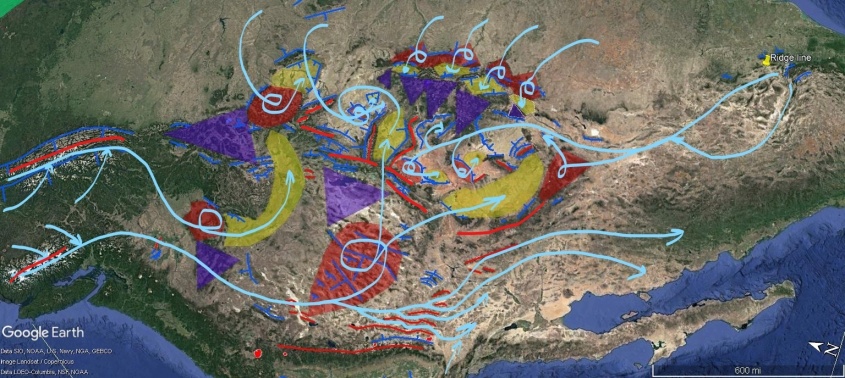
To describe this storm, there are two jet streams from the north. One poured through the Snake River Valley, arcing east towards Yellowstone. The other jet stream swept into the Great Basin rippling Nevada with rows of windblown mountains. An “S” shaped range in central Nevada defines the center of rotation, as this meso-cyclone scraped the ground like one incredible tornado. It down-drafted in two streams. One pressing down on the Uinta Valley, Utah; the other sweeping northern Arizona, forming much of the Mogollon Rim.
The Great Basin thunderstorm also spun air south, bypassing the rotation to help define the Sierra Mountain arc, and scour Owens, Amorgosa and Death Valleys. The Sierras were formed by winds from the west (not shown) which pressed against the Great Basin rotation, and the winds bypassing south.
From the south, winds collected and then split, forming the Mexican Kink, and the El Guaje mountain. They reformed in a ground hugging laminar flow near Four Corners, sweeping across Colorado, Utah and northern Arizona, laying the foundations of the Colorado Plateau.
The southern wind fed a multi-vortex cyclone over the plateau, were it divided it’s path to feed thunderstorm updrafts. These winds threaded up and back down through meso-cyclone-cyclone pairs in looping currents, like lacing a shoe. The updrafts are defined by San Rafael Swell, Utah, and Monument Valley and Black Mesa, Arizona.
Winds from the south also circulated eastward over the Great Plains, to be sucked into the cyclone through thunderstorms that built the eastern face of the Rockies. These down-drafted, forming huge craters in the mountains, like San Luis Valley, Colorado.
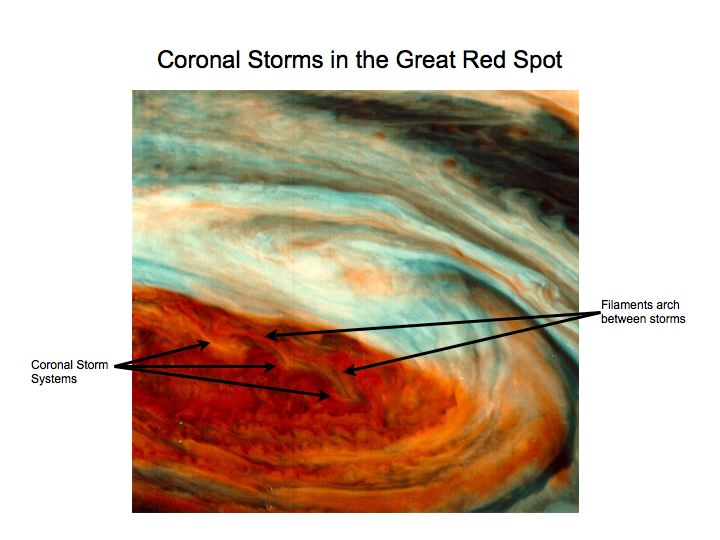
Each of these features – the Great Basin meso-cyclone, the multi-vortex cyclone over the Colorado Plateau, with arching colonnades of meso-cyclone/cyclone pairs can be identified in the Great Red Spot on Jupiter. It’s because the shapes and actions of the wind are driven by the fractal process of charge diffusion in the planetary circuit. The difference in chemistry, and thermodynamics of Jupiter’s atmosphere compared to Earth’s doesn’t make much difference, because circuits are the forcing mechanism in Nature.

So this completes the view of winds at the very eye of the storm. The Colorado Plateau received the hottest plasma torching in North America. Surrounding areas were also ravaged by storm, but none so severely. In fact the whole Earth was wrapped in storms. So, we’ll look closer at some of those regions, as well as more details on North America in the next installment.

Quick Tip
The Daily Plasma is free to read, but the cost of publishing isn’t. Please leave a tip to show appreciation, and help defray expenses.
$5.00

Hi Andy,
I’m not seeing anything in the skies myself, but I’m a city dweller and spend most of my time indoors especially at this time of year.
I live on the rim of the Sudbury Irruptive Complex (SIC) which hosts one of the largest Cu Ni and platinum group element deposits on the planet. The geologists have argued for almost a century on its origin, one camp being volcanic and the other being meteorite impact. Each camp had observations that falsified the other’s argument. I think they are both right in that both hypotheses are incorrect. I think it’s electric.
In the 1960s they found shatter cones which are presumed by mainstream geology to be only caused by meteorite strikes. The meteorite camp has won over the volcano camp for now.
Recently a paper was published addressing some of the weakness of the meteorite impact theory by proposing it was a comet. Well, that assumes comets are dirty snowballs which we know they are not. So toss that paper onto the bonfire.
I have had experienced mining engineers tell me that the ore bodies are being found where they should not be. This theme is also outlined in the literature. Their models have to be stretched to explain what they see, yet still, it does not make sense according to their paradigm . Also, Cu-rich and Ni-rich ore bodies are not randomly distributed as one would think would be the case if ‘upwelling magma from below after the supposed meteorite strike’ was responsible for the ore bodies. There is a pattern to the placement where Cu and Ni elements arrange in deposits according to the radial distance from the centre of the SIC.
In one paper I found, the authors state:
“The trend within individual offset dykes with increasing distance from the SIC is towards increasing PGE, Cu and Au”
I believe this is as opposed to less PGE and more Ni closer to the center of the SIC.
The authors also say that they are not sure how these mineral deposits formed:
“The origin of the Cu-Ni-PGE systems is controversial with both magmatic and hydrothermal processes having been supported in the literature”
I believe there may be some electrochemical sorting that occurred that the mainstream would never consider as a model. This may be associated with some magmatic component where the magma from great depth would have been drawn up by the electric current and the elements sorted and included electrochemically into the country rock of the footwalls.
The SIC is a magnetic anomaly and there is another one right next door called the Temagami Magnetic Anomaly. I think this looks like a coronal loop signature. Two ovoid shaped structures next to each other like the San Rafael Swell. The SIC I think was the updraft and the TMA the downdraft. There is some mining exploration around the TMA but it’s not as rich in minerals as the SIC, or they may be at some depth and not fully discovered yet. Ore deposits that are diffuse and deep are obviously not as lucrative to mine as concentrated and nearer to the surface.
Another observation is that the SIC and TMA are exactly on the boundary between the (geological provinces) Superior Province and the Southern Province. The Grenville Province is only a few miles south. I don’t think that’s a coincidence.
Of course, there are signs of other electrical activity in the region. Search Lawson Quarry on Google Earth. It’s an orthoquartzite deposit. The only one in the region to my knowledge. Zoom out. Do you see a familiar barred spiral galaxy form on the land?
Regarding shatter cones, I spotted an interesting reference in an Ontario Geological Survey Report:
“Shatter cones similar to those of the Sudbury area (Bray et al. 1966) occur in northern Foster Township in micaceous sandstones of the Mississagi Formation. They are spatially related to the Espanola Fault and all the shatter cones found in the area have their apices pointing downward at angles of 45 degrees to 65 degrees. Dietz (1964) attributes the formation of shatter cones in the Sudbury area to shock-induced overpressures caused by meteorite impact. Because of the close association of the Foster Township shatter cones with a fault, and their orientation, shock-induced overpressures generated by fault movements seem a possible alternative mode of origin.”
Shatter cone apices generally point to the center of ground zero of a supposed meteorite impact and above the level plane. Also, shatter cones are supposedly only made by the powerful shock waves produced upon meteorite impact, but here since the apices point downward at steep angles in the direction of the fault, the report suggests that some mysterious overpressure occurred at the fault. That must have been one hell of an earthquake.
I posit that this has more to do with the electrical activity that created the aforementioned Lawson Quarry and associated landform since the Espanola Fault is nearby just about 4 or 5 miles east of the town of Espanola.
In another OGS Report generally regarding shatter cones of the SIC it states:
“the geometric relationship between bedding, cleavages, and shatter cone axes indicate that the country rocks had already been folded before imposition of the shatter cones, and were further deformed afterwards (Church, W.R., personal communication, 1973). These structural complexities will have to be taken into account before the true original orientations of the shatter cones can be deduced.”
This observation would seem to falsify the meteorite impact hypothesis.
I wonder if Louis Hissink can contribute to your mineral deposits targetting using the Electric Geology model.
When you get this figured out… Hoegaarden is my fav beer 🙂
Don
LikeLike
Don! The electric geologists have a new member! Please join us on a trek with your Electric Eyes!
Larry
LikeLike
larryduane100 … I’ve been keenly interested in geology for decades but especially fascinated with EG since I came across it via Michael S. even before he started recording his Earth News series. I downloaded every episode to ensure they would not disappear after he passed. We communicated for a while and I sent him photos of some of the oddities here on the Canadian Shield.
By ‘trek’, do you mean a visit to Colorado Plateau? Do you have a discussion group or something else in mind?
LikeLike
I LOVE THIS!!!
You are the man Andy!!
-David
>
LikeLike
Great article Andy. You’ve obviously put a lot of time and effort into this work.
As you said such storms would have happened on Earth over a period of time and layering/reworking of the landforms would have occurred.
Nevertheless…
Mainstream geology would probably explain the triangular buttresses as heaved up sedimentary layers that for some reason mysteriously eroded via normal wind and water processes into the observed form. These erosion processes would not be limited to one particular area as a fluke since they are observed worldwide.
For the mainstream explanation to hold up, these supposed sedimentary layers ought to extend below the surface on what we know as the ‘windward side’ and the stratification should be fairly consistent with what is observed above the surface.
I suppose that the electric geology hypothesis would not predict such ordered sedimentary layers extending very much below the surface on the windward side of the buttresses.
Two thoughts come to mind:
1. There must be drill cores that were done near buttress formations for various reasons such as oil and mineral explorations where examination of such drill cores would support or refute these two competing hypotheses. Exploration geologists with the knowledge of how and where to access these data and overlay these drill core data with what is observed should be quite revealing.
2. I found the ‘wind map’ quite interesting. If a very detailed wind map could be overlain with known mineralization where economic mining has been done in the past or is happening now, could such a template be a guide that would help focus mineral exploration efforts?
Thought #1 would probably have the mainstream waving their arms around madly and augment their current theories by invoking millions of years, shallow seas and disappearing volcanos, but item #2 since it involves money, I would think be of great interest to mining exploration companies as an extra tool in their exploration toolbox.
Cheers,
Don
LikeLike
Hi Don,
Yes mining is an opportunity. I can correlate copper deposits with wind patterns and some iron deposits with magmatic activity. I’m still puzzling it out. I hate to say what other elements I think I know how to find. If I’m right, I’ll buy the beers.
I will be looking deeper into stratigraphic layers. Any data source would be appreciated. I worked with geologic cross sections in the oilfield. Mostly anticlines, which always had a dip to the sand layers. I think these dips are from wind deposition and that shock waves should show up as dipping thrust faults.
As to the depth of layers that are windblown, they go to the “great unconformity”. That is best known from Powell’s famous expedition in Grand Canyon, where he discovered the Vishnu Schist. It appears to me the Vishnu Schist is a dividing line between primordial creation and a series of recurring events. I have a theory how Vishnu Schist was created, but I can’t let the cat out of the bag yet. Since that event, we have had cyclical periods of catastrophe. I think we are entering one now. Are you seeing anything unusual in the Canadian skies?
Cheers,
Andy
LikeLike
Andy, Great to see the duning addressed! Michael S. would have loved this stuff. I hope you will be showing us some of this in the field this year!
Larry White
LikeLike