Every butte has a crack, but not all cracks are beautiful. Though some are magnificent, ruler straight and parallel, some can be ugly, chaotic mangles. But there is a quixotic pattern to ugly cracks, so we must not discriminate. Whether they make lovely geometric shapes, or chaotic mangles, a study of cracks is essential Electric Universe science.
The reason is cracks are interfaces – boundary layers – and electrically, that’s where the action is. To understand any geology, the first thing to look for is boundary layers. Charge collects at boundary layers where it displays the effects of inductance and capacitance most prominently.
To begin with, the outside of Earth’s crust is a boundary layer. Sonic shock waves made the geometry, and electricity made the chemistry. Wind, also motivated by electric currents, made things move – kinetics. Energy came from within the Earth as a release of stored capacitance. That, in a nutshell, explains the face of the Earth. The creation of virtually every mountain, hill and dale on the planet is summarized in those sentences. The devil’s in the details however, so that’s why we are looking at cracks.
Cracks are the remnant of capacitor interfaces in Nature’s circuitry. They are boundary layers between different materials. The boundary layer separates two dielectrics with a double layer of charge – a capacitor. The dielectric difference was due to difference in dielectric property of the material at the time it was laid down by plasma winds. The dielectric properties differed due to the elemental and molecular makeup of the material, and the state it was in at the time. The material’s temperature, density and pressure influenced the material’s dielectric, and shock waves produced sharp discontinuities in pressure, density, temperature, as well as, charge density.
First, let’s dismiss cracks that aren’t part of the electrical circuit we want to examine. Some cracks are from thermal stresses as matter cooled and contracted, or structural as matter shook and settled from seismic forces. These cracks are generally vertically aligned due to gravity. Gravity makes the fracture plane vertical because it’s the path of least resistance, where gravity’s force vector has no influence holding the rock together.
A good example is how hydraulic fracturing is done in oil and gas production. A fluid is pumped into the well bore to the bottom of the hydrocarbon formation and pressurized until the well bore pressure exceeds the overburden pressure. Fluid pressure separates the rock vertically, creating a fissure that extends the contact of the well bore upwards into the hydrocarbon bearing formation. The practice allows access to hydrocarbons otherwise locked away in dead zones far from the well.
That’s just to illustrate that vertical fracturing is predictable, applied science. A cooling, contracting rock will fracture vertically for the same reason that swelling the rock under pressure fractures vertically – Newton’s Laws.
Some cracks are due to lightning. These are certainly electrical, but lightning finds it’s own path. It’s not wave-guided by interfaces other than the surface it contacts, which still leaves much freedom of motion. Therefore, lightning wanders, following conductive paths on the surface it strikes. It may be vertically oriented, vectored by the electric field, but it will generally not display a pure geometry, such as straight lines and polygonal forms. It’s form is chaotic.
Lightning blasted rock often displays shearing, where the blast fractured rock; or melting, burning, or chemical reaction from the heat and charge. A dipolar magnetic signature should be detectable across the current path. But lightning scars are not the type of cracks we want today.
We want to discuss cracks generated by shock waves and electricity at the shear zone between the land and plasma winds, at a time when Earth was embroiled in the epic maelstrom of creation. In other words, we want cracks made where the filthy underbelly of the Ouroboros scraped the land.
The Ouroboros, or the penultimate representation of the concept, anyway, is the plasma wind that wrapped the Earth during key stages of its evolution. Sharp discontinuities in plasma winds caused by supersonic shock waves left imprints in deposits of ionized dust, which manifested as cracks as the dust recombined to form rock. The discontinuity in a shock wave includes density, pressure, charge density and dielectric property, which electrically makes it act like a capacitor. Therefore cracks in rocks are the all important proof of wind formation and the circuitry in the plasma winds.
To define a crack, first of all, means an intrusion, or separation between rock matrices, or the boundary between stratified layers, whether the space between is a void, or filled with material. Therefore, we include rock veins, dykes, shelves, faults, and similar geologic structures along with empty cracks. The difference is whether material was pulled into the crack, or expelled from the crack by electric fields. Either way, the crack was made by shock waves.
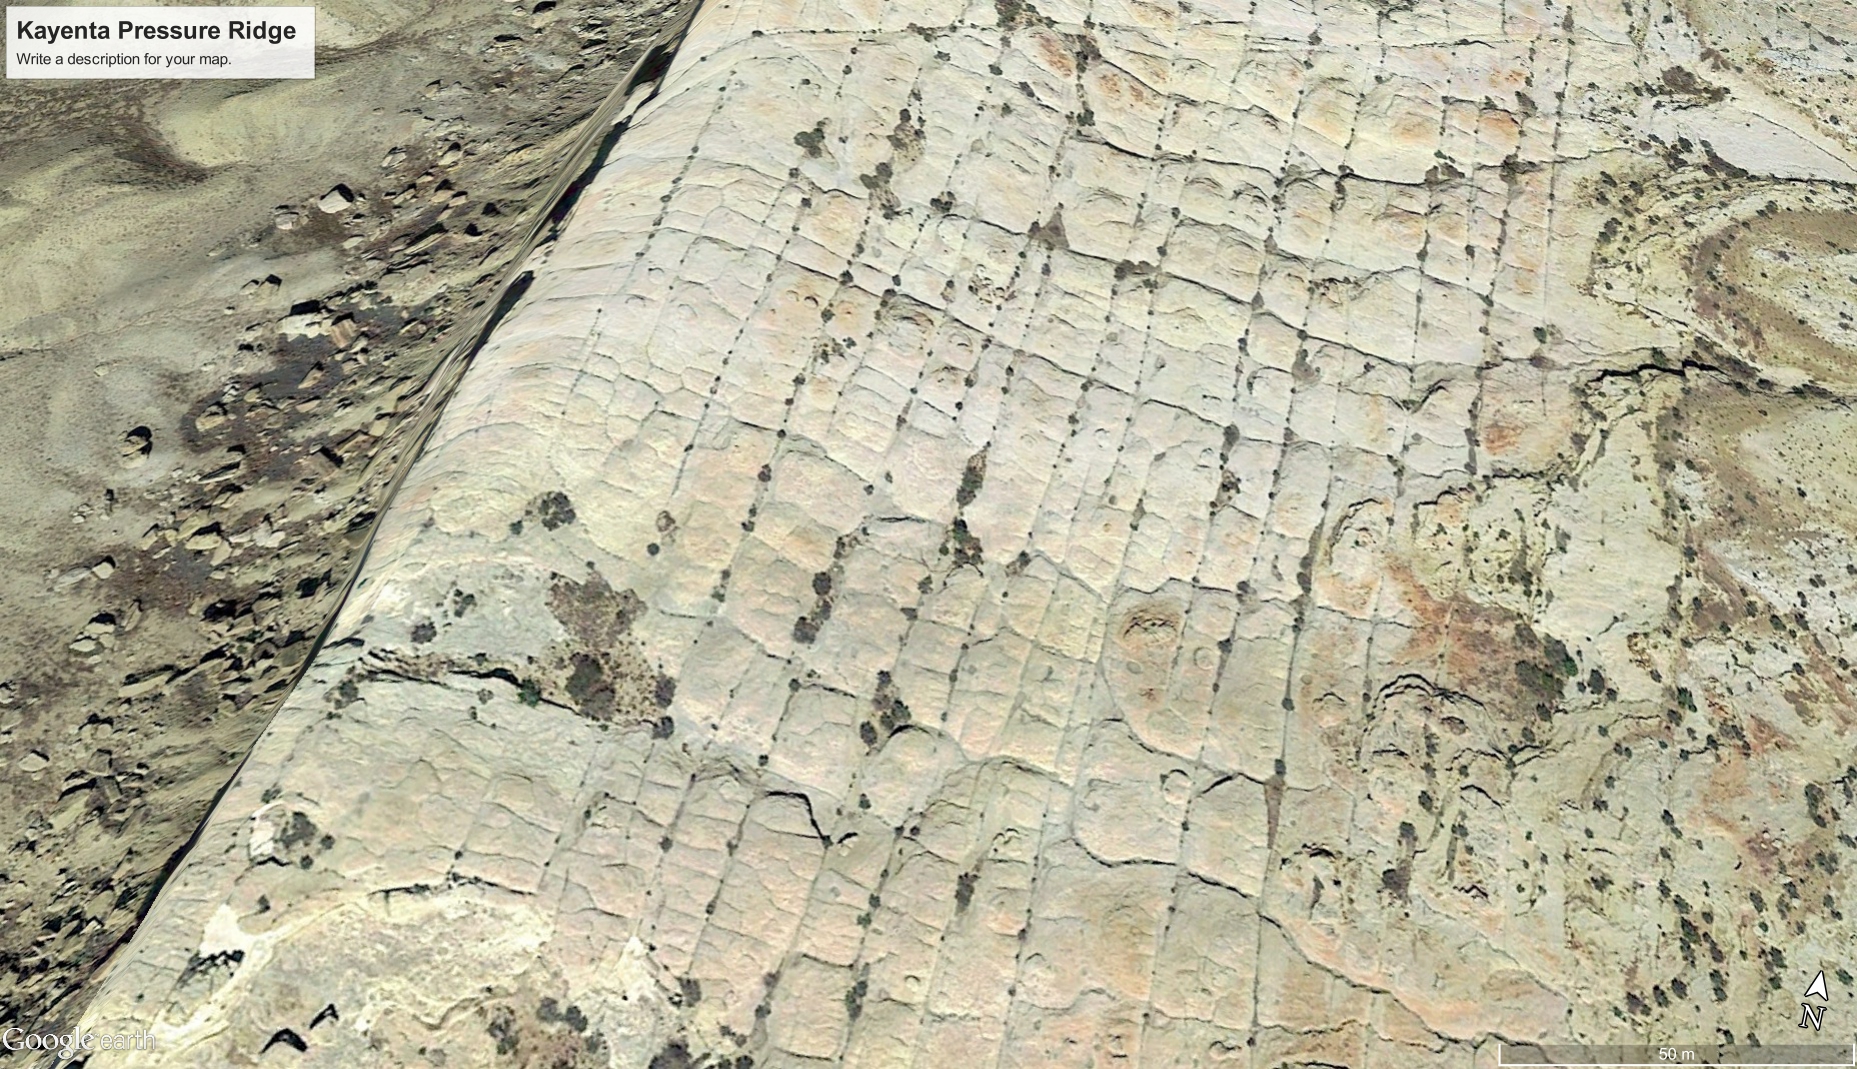
That is why there are a lot of diagonal cracks. Also polygonal cracks. There are triangles, rectangles, squares and diamonds everywhere in the rocks, the mountain flanks and the outline of mountain peaks. The mountains are composed of triangles at virtually every scale. These were caused by shock waves.


It’s also why they form at particular angles. Mainstream theory assumes rock strata always forms horizontally, and then “uplift” shifts strata into various angles. Uplift is assumed to be caused by the stretching and compression of the crust due to tectonic movements. It is then assumed, erosion from wind, ice, vegetation and rain over millions, or billions of years then polishes the crustal surface into the forms we see today.
The assumptions they make are actually ridiculous. Most rock is very brittle. Limestones and sandstones can break in your hands. Igneous rocks like granite break with a whack of a hammer. If the planet’s crust churned the way they say, under the forces of compression and expansion, lifting and falling, all the while scraping and jostling for billions of years, the mountains would be piles of rubble, not sharply defined tetrahedrons.
Erosion would further break rocks apart, smoothing their edges, rounding their corners and dissolving any geometry they might have had. The mainstream model of tectonics would leave piles of sand and rubble. Yet what we see are sharply defined geometries that accurately and predictably follow the form of sonic shock waves and the separation bubbles they form at the wind-ground interface.
When a shock wave forms, it forms at an angle to the wind’s direction determined by the ratio of the wind’s speed to the speed of sound, called the Mach number. A Mach number of 1 or more means the wind is supersonic. A Mach number of 2 means the wind is twice the speed of sound, and so on. The incident angle the shock wave makes with the ground varies with the Mach number, so it can be used to determine if winds were consistent, forming a consistent angle, or variable in either speed, or direction. If you know the density of the atmosphere, you can determine the velocity of the wind from the Mach Angle.
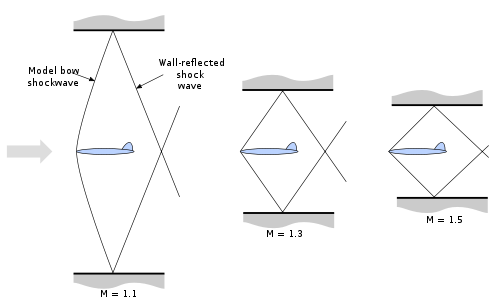
Shock waves reflect from an interface (like the ground) just like a beam of light reflects from a mirror. The angle of reflection compliments the incident angle. The ground forms a plane shock waves reflect from. Wherever supersonic winds blew, and evidence suggests that was nearly the entire face of the Earth, standing waves formed and reflected from the ground from every channel of jet-stream wind. In fact, shock waves formed whenever a jet-stream wind changed direction, or expanded, or sheared against the earth, or another wind. Therefore, shock waves patterned the winds – the wind rippled with shock waves as they deposited dust and sand – and the deposits retain the patterns.
See The Damn Pattern
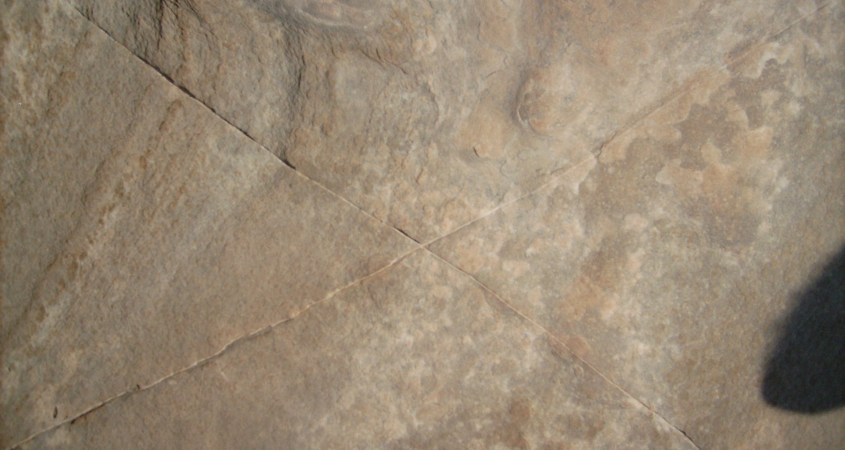
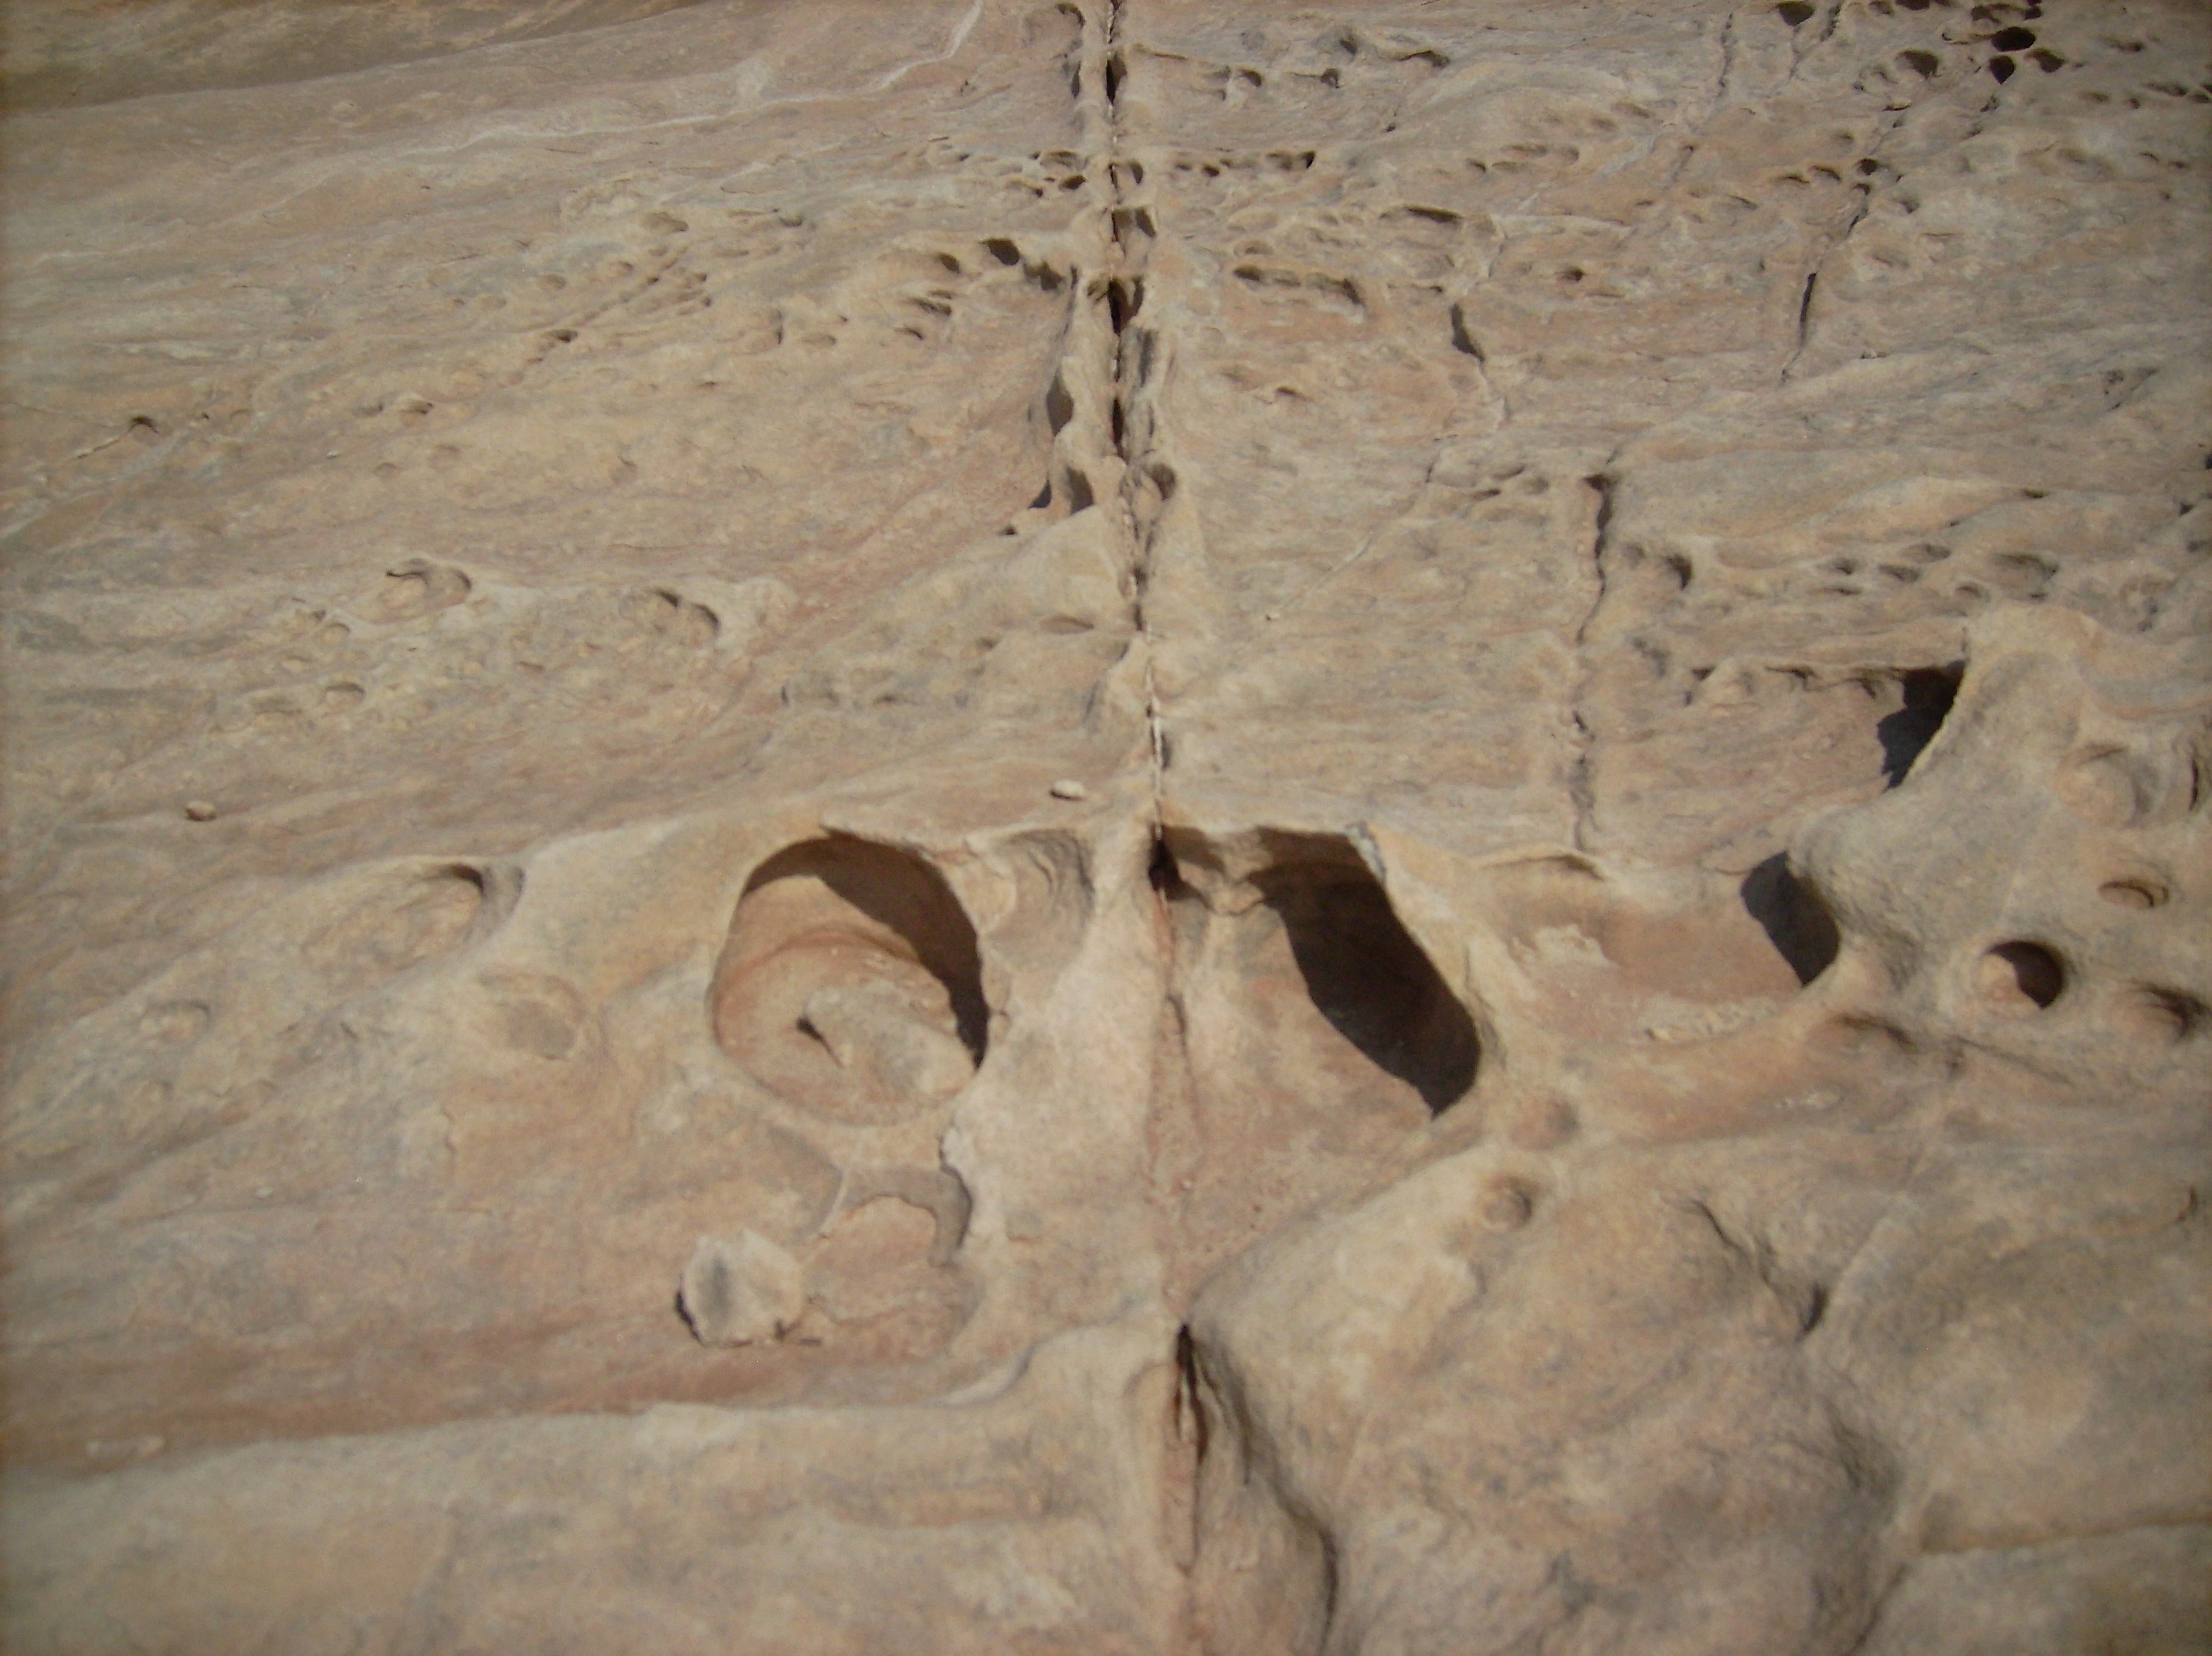
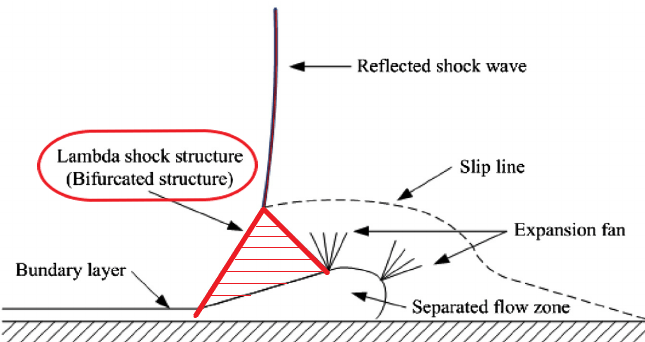
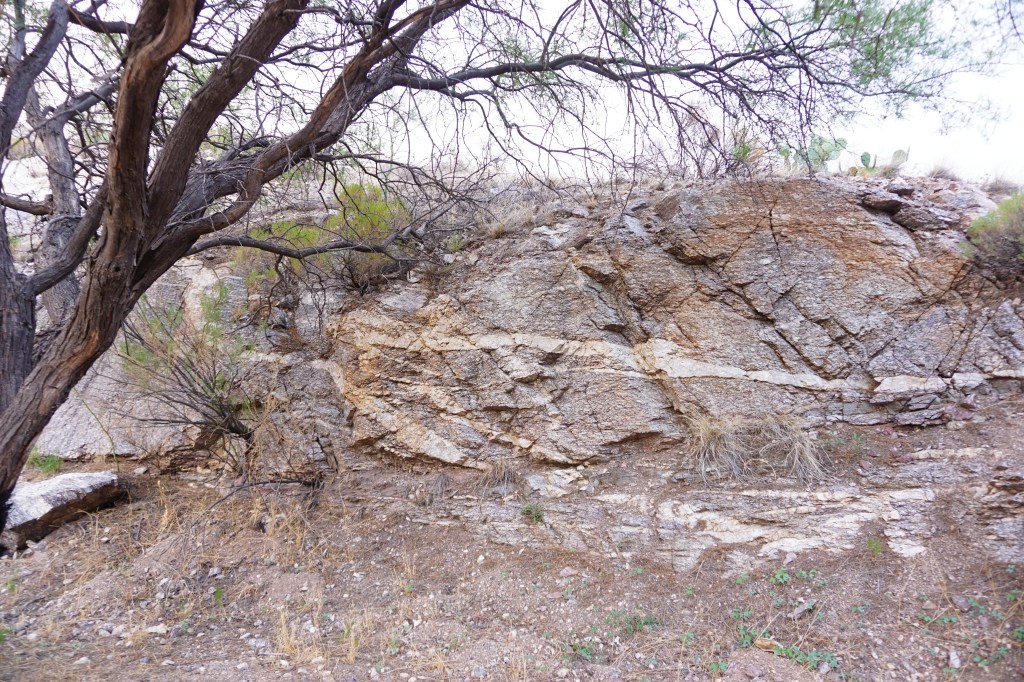
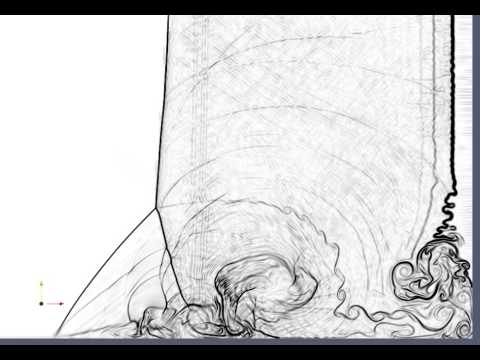
Figure 9 compares images of a diagram of a standing shock wave reflecting from a surface (from wind tunnel tests) with an impression of a shock wave reflection in a mountain exposed by a road cut. Every feature of the laboratory produced shock wave is evident in the road cut. The angle between the incident shock wave and the reflected shock wave forms a “Y”. Inside the “Y”, there is a step in the stratigraphy. The “Y” forms a discontinuity where the layers take a step down, as if this wedge sank. They also angle, or dip differently, just as the pressure regimes inside the “Y” of the diagram do. The stratigraphy inside and out of the discontinuity closely matches the “stratigraphy” of pressure regimes in the boundary layer of supersonic winds – because this hill was formed in the boundary layer of a supersonic wind.

Perfect boundary layer discontinuity 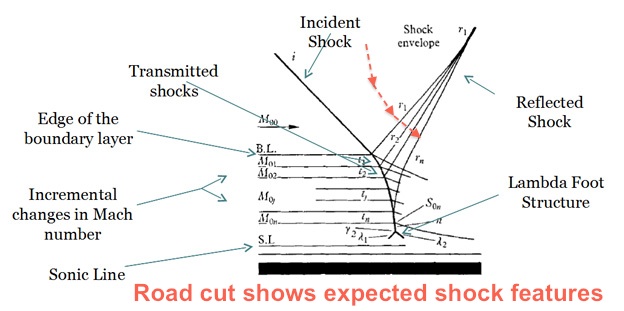
Diagram wind tunnel test 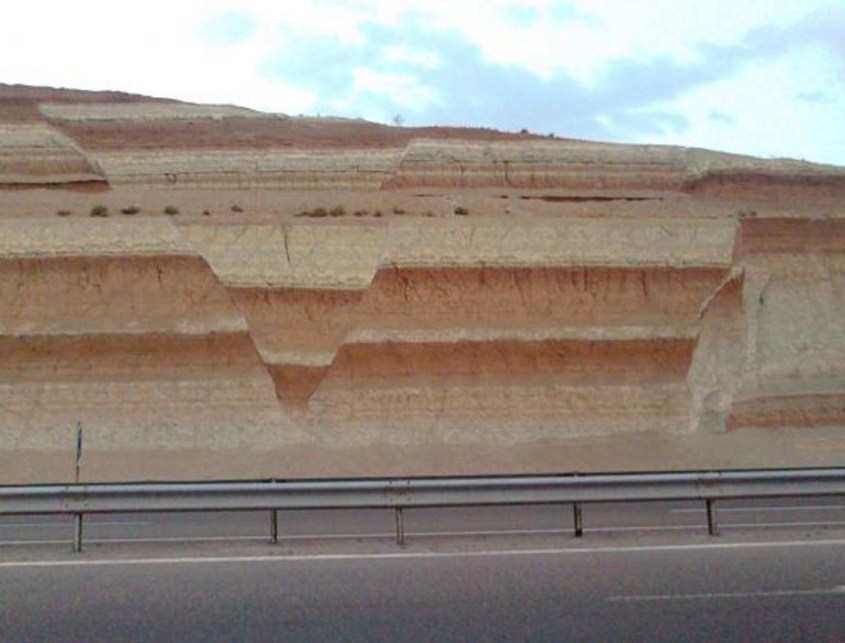
Lambda foot is visible in this image
Look people, this ain’t no damn coincidence. How could this happen by conventional theory? How could this wedge drop a few feet and neatly fit the “Y” without it’s edges even getting ruffled? The “Y’ isn’t straight, it has a hyperbolic compound curve. How could the wedge sink and still match this curve perfectly, without pinching or leaving gaps, and without disturbing the geometry of the curves, or strata inside, or on either side of the discontinuity? Why does the angle of the wedge strata shift with respect to surroundings on the left discontinuity, and the lower right, but not at the upper right, where the strata remain consistent across the discontinuity? How come, while falling into the crack, the wedge became thicker in the big white band of strata at the top, but only on one side.
None of this makes sense, unless you consider wind deposition at the boundary layer of a standing shock wave reflection. The discontinuities are the impressions left by the incident and reflected shock waves. They form a sharp, geometric boundary with no evidence of friction between. As dust deposited, it met this shock wave and followed the pressure and charge density profile of the shock wave. Dust was sucked down into this hole by pressure differentials across the boundary layer, but layered in proportionate thickness to the step voltages that segregated each pressure regime, and the type of dust being delivered by the plasma wind.
The wind had to pile this dust and gravel pretty fast because the layers filled concurrently. That is, the layers didn’t stack up one after the other. They fire-hosed in, each layer at the same time, segregated by the dielectric property of the dust. Amazing when you think about it, but it was all one flow segregated like a rainbow that suddenly came to a stop and compacted itself into a mountain, freezing in that moment this shock reflection and the effect of it’s sudden pressure anomaly in the air-flow.
Ask anyone to look at this picture and say how the layers deposited, and I guarantee they will respond: “one on top of the other, sequentially over time, with the lowest being the oldest.” Whod’a thunk it all blew in together one one big rainbow of horizontal winds, and then stuck due to static electricity? It’s not easy to wrap your head around because we have been taught not to think outside “The Box”.
One thing you’ll notice: the reflected shock in the diagram is concave with respect to the incident shock, whereas the road cut shows a convex relationship. Take note, this is a particular feature of shock waves. The concave/convex relationship is a function of how the wind is vectored with respect to the ground interface – whether it’s parallel to the ground, lifting from the ground, or driving into it. The diagram depicts a wind moving left to right parallel to the floor of the wind tunnel. The road cut is in a hill the wind was impinging on as it built, and lifting over, changing the Mach angle with respect to level ground, and the reflection geometry from concave to convex.
This also explains why the white band gets thicker on the right of the road cut, but the diagram shows the “edge of the boundary layer” (also marked BL in the diagram) turns down and narrows this top band in the “Y”. The road cut white band widens because it intersects a convex shock wave reflection, whereas in the diagram this top band narrows because it intersects a concave wave. It is a trivial matter to change the concave/convex relationship by simply changing the incident angle of impinging winds. There is also a lambda foot structure at the very bottom tip of the “Y” in both cases. These little details are proof of shock wave formation.
See the damn pattern. These images are scientific proof – a direct link between repeatable empirical tests and nature. This is far more evidence than anything geologists have presented for any of their “tectonic” theories. Any. Ever. Their theories are built on the big ideas of arrogant, goateed, bow-tied phonies without a shred of empirical evidence. Their “evidence” it’s conveniently shrouded in the depths of time – millions and billions of years of imperceptible, sand grain-by-sand grain movement which they are still working to explain how CO2 made happen. Who are we to question them? Actually there is no need to question them – just stop listening to them, and for Christ’s sake, stop giving them money.
Bubbles in the Wind
The shock feature exhibited in the road cut is only a small part in the full picture of a supersonic wind-generated shock wave. It’s best to think of shock waves as the membrane of a bubble. On one side of the membrane is a gas of higher pressure than on the other. The entire bubble structure is very complex, however, with regions of expansion and compression, recirculation, laminar flow and turbulence in a supersonic wind that is passing through the bubble. In a dusty plasma it gets even more complex, with electric fields, sheets of current and step voltages across the membranes, which is no longer the physics of fluid dynamics, but of magneto-hydrodynamics.
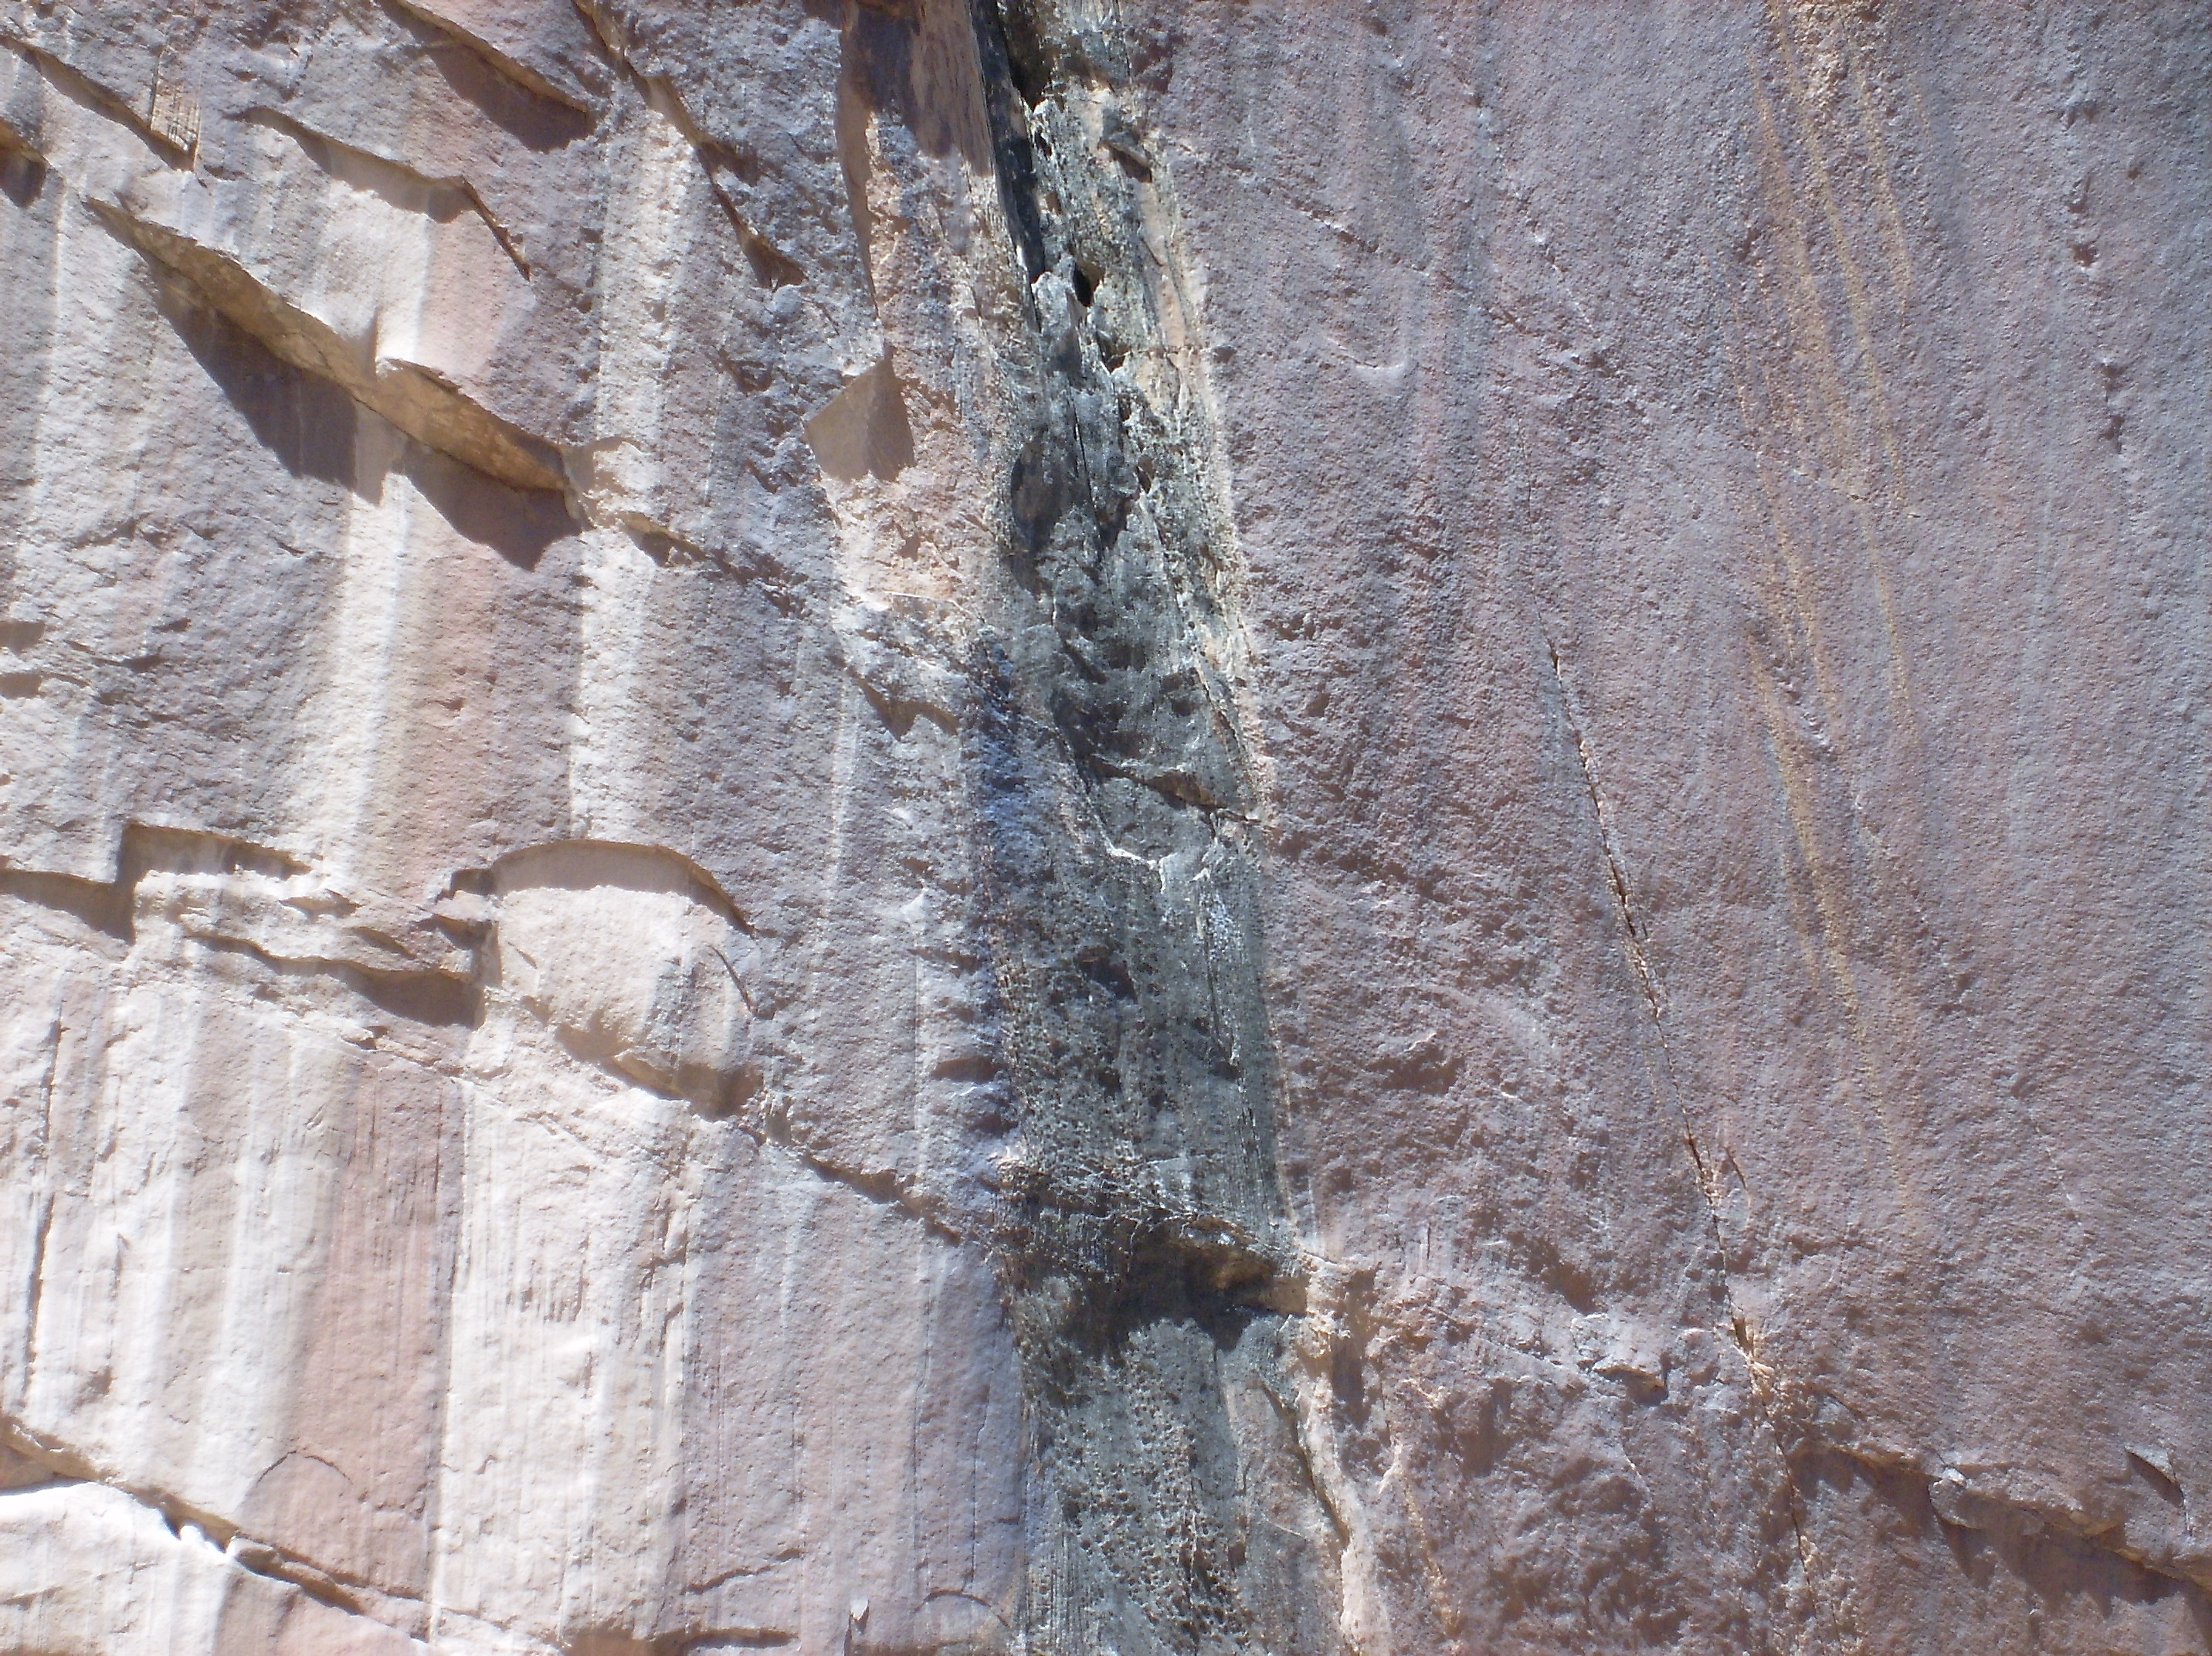
The following image shows where I think the road cut feature came from. This part of the shock wave structure dips into the separation bubble, which is the turbulent region at the base of the bubble. The separation bubble is where dust collects, which ultimately buried the tip of the shock wave. This shock wave is not the primary incident wave, but a harmonic reflection of it that does not always form, depending on conditions.

Note the fine vertical lines to the right of the primary shock wave in the image. These are step-wise gradations of pressure in the airflow throughout the shock wave structure. In a plasma these gradations are also steps in potential. These vertical gradations can be seen in rocks, criss-crossing the diagonal shock waves produced by the Mach angle.
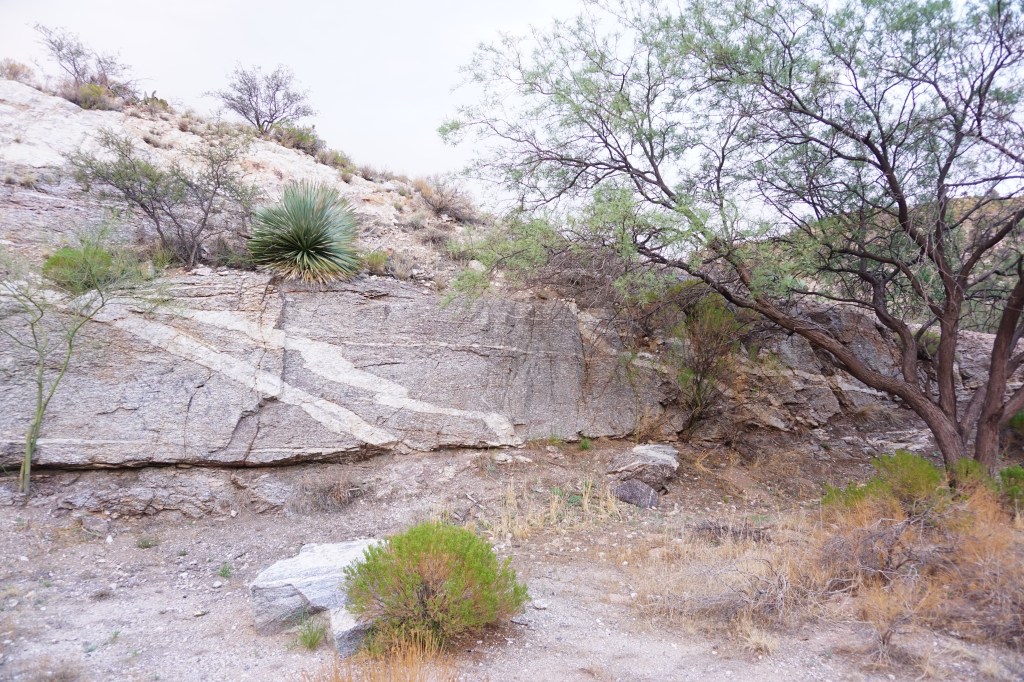
Sometimes dust can fill the entire “lambda foot structure” where the incident and reflected shock meet at a triple point. In which case you get mountains like this.
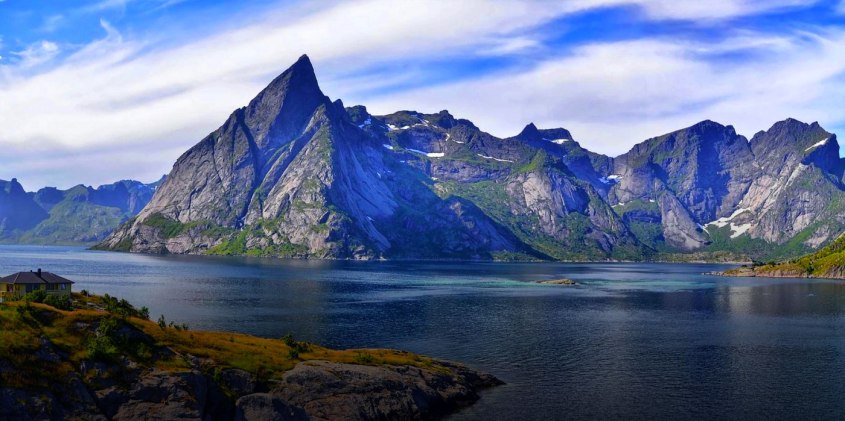

To be clear, some mountains are formed inside the separation bubble, or “separated flow zone” in the image, and some mountains fill the entire “Lambda shock structure”. The Lambda foot manifests at the base of every shock reflection, so it is a repeating fractal element of the shock wave and appears at different scales. The stratigraphy in the separation bubble “dips” (meaning angled with respect to horizontal) consistent with the wind’s vector inside the shock bubble, because that is how the wind layers its dust load. Mountains that fill the entire Lambda structure may have stratigraphy that dips at a shallower angle than the dip of Mach angle displayed by its flat triangular face, because the wind was vectored upward and dust fell, filling the lambda foot from the bottom.
Although this should not be taken as a hard and fast rule, because there are always variables; generally speaking of wind generated mountains, it can be said that is why shallow dipping hills, foothills and mountains have layered stratigraphy that dips with the contour of the mountain, while large triangular peaks are more like layered bricks – not necessarily horizontal, but a relatively shallow angle at odds with it’s outline.
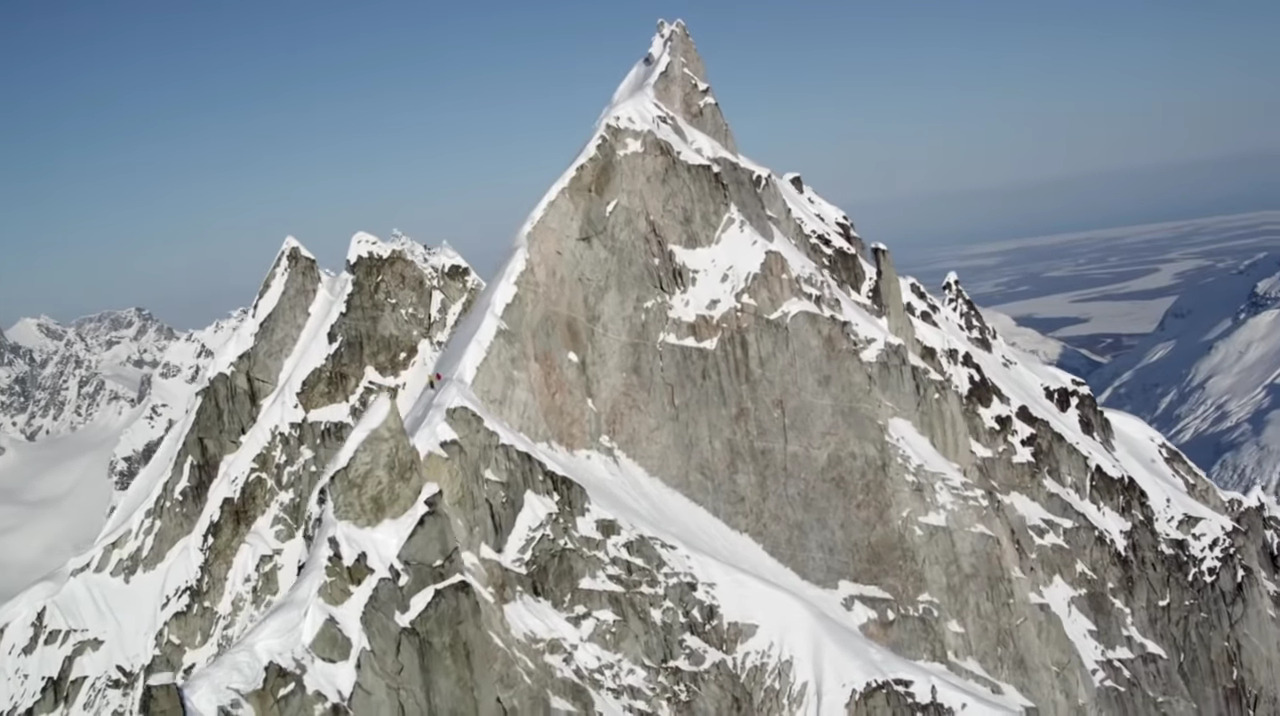
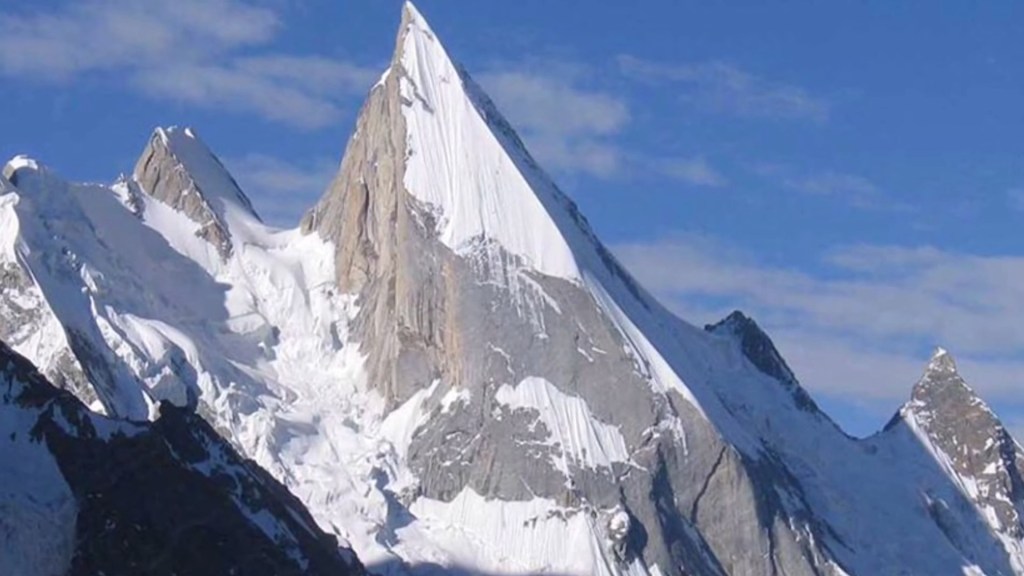
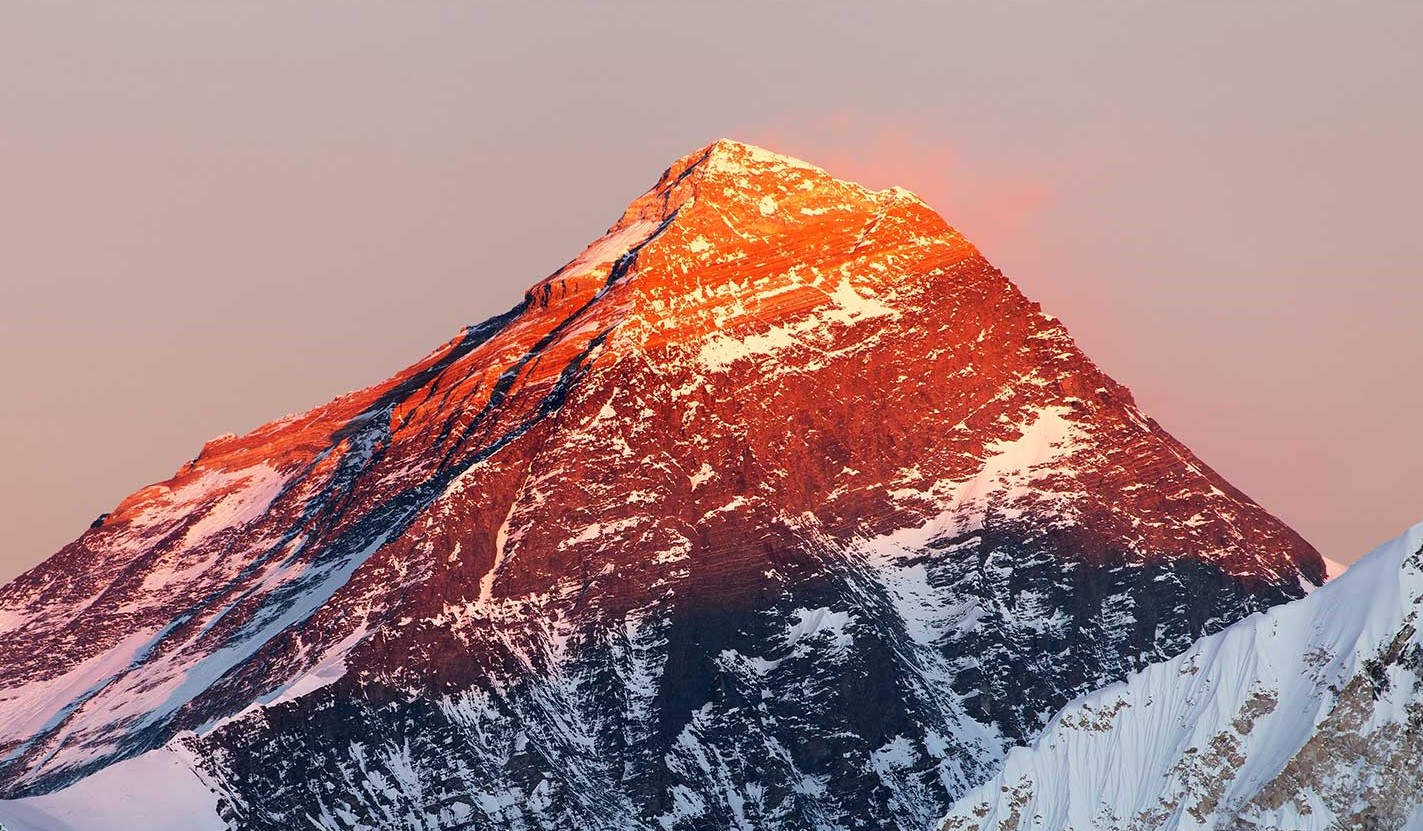
Mt. Everest is a good example of a big lambda foot mountain. In fact, at 29,029 feet, I’m pretty confident it’s the biggest, baddest lambda foot ever. Follow it’s stratigraphy, such as its famous “yellow band” and you can see the dip in relation to the facets of it’s outline.
That’s how mountains are formed. The evidence is everywhere, and looking at cracks yields, well, mountains of information about their genesis. The interface between stratigraphic layers are cracks by my definition, in case you think I’m loosing the thread; talking about the shape of mountains instead of cracks. Cracks are the remnant signature of shock waves and electric currents produced in the storm that built the mountain, just as the outline of a mountain is. The contour of the mountain, the cracks in it and the dip of it’s sediments are all related to shock waves. The angles in their layers and contours is pure information about their creation, because information is always a waveform, and the mountains store the waveform.
Electricity in a shock wave is especially shocking
The shock wave, and shock wave reflections, form an electric field across the walls of the wave in the manner of a capacitor. A double layer forms on the interfaces with a dielectric field between. The charged layers can be the same or opposite polarity to the charge of the dust being deposited, leaving ether a void, or hardened rock. A hardened seam will have more conductive material, like the quartz in rock veins, than the surrounding country rock-matrix.
Mineral bearing veins, for instance, bear conductive minerals like gold, silver and copper because these conductive materials were attracted by the electric field of the shock wave either as a vapor from the atmosphere, or by diffusion through the ground (or by transmutation, but that is over my head. I don’t have my alchemy license yet.). Diffusion through the ground is how consensus theory works, with the attractor being hydrothermal venting. Why hydrothermal venting should attract metals from far and wide isn’t clear. An electric field does that though, without question, so our theory is already better if Occam’s razor means anything.
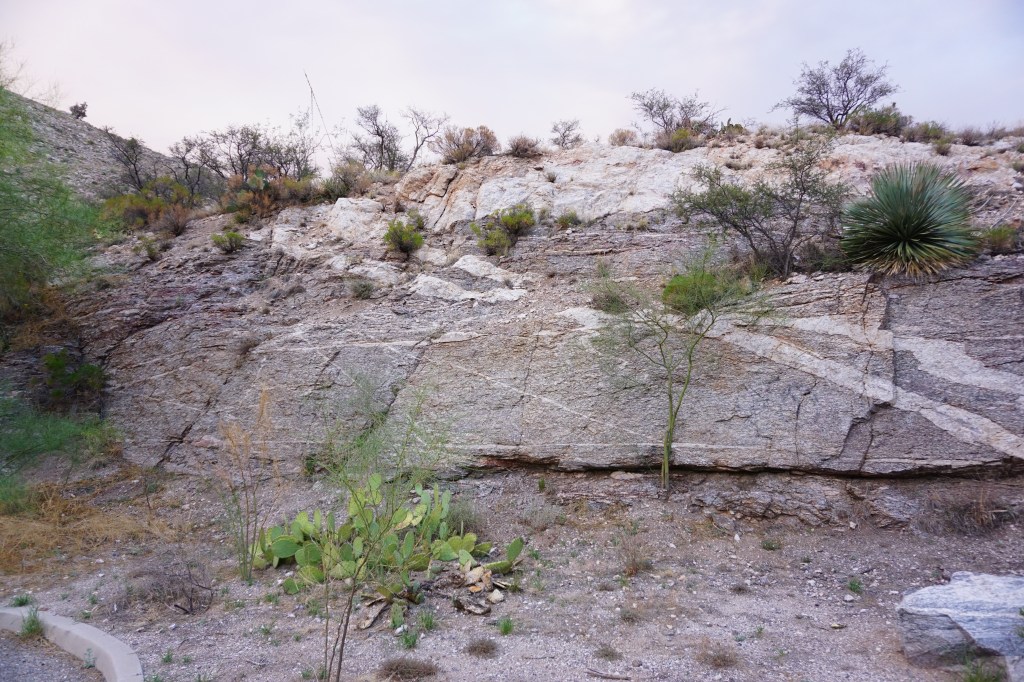
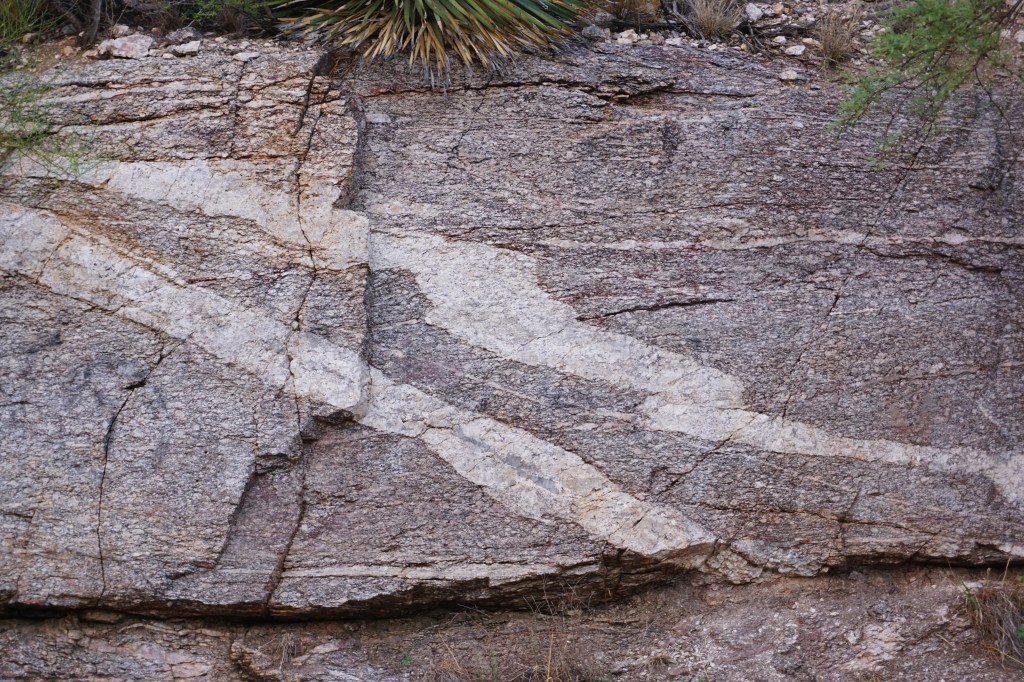
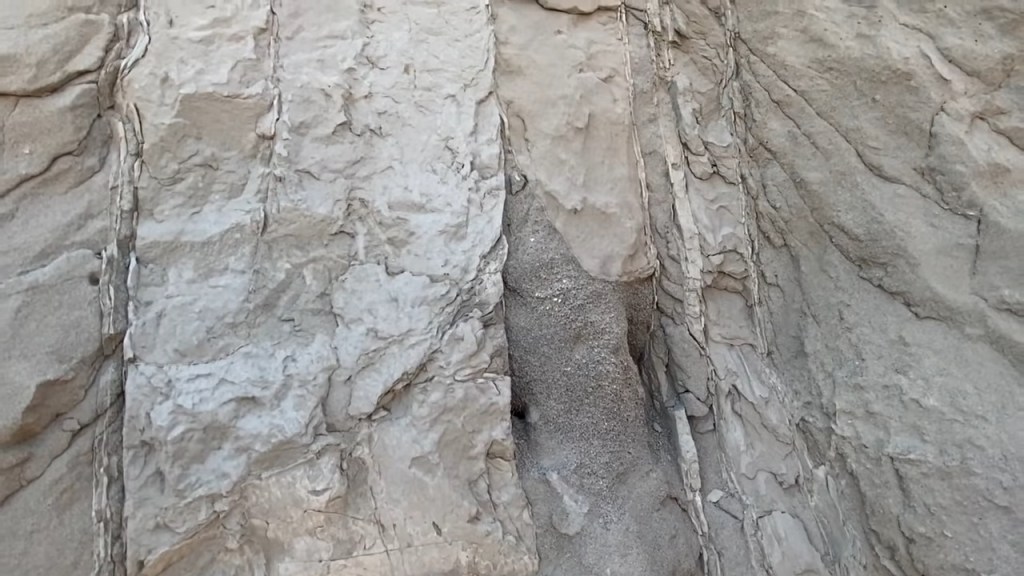
The quartz veins in the images of granite were created by an emergent effect of shock waves, called traveling waves. Note there are four wide quartz veins (see large image) in two pairs that parallel each other diagonally across this granite face. Traveling waves are semi-stable reflected waves that migrate through a shock wave structure due to instabilities in the bubble. The even vertical lines that appear in Figure 10 are examples in a steady wind. But shock wave bubbles can wobble just like soap bubbles, producing instabilities as wind speed and direction varies. They move in harmony to the shock wave frequency in repeating patterns. That is why there is a pair-of-a-pair of similarly structured, yet highly complex repeating forms in these rock veins.
The next image shows clastic dikes in Washington State. These dikes are vertical-to-diagonal intrusions in a sedimentary hill exposed by road cut. Each dike is layered, vertically, with different fineness of sediment graded from silt to gravel, in each separate layer. The sediments inside the dikes are completely different material than the hill they intrude in. It’s as if each vertical layer of the dike sucked a different dust down into it from somewhere other than the mountain it’s in.
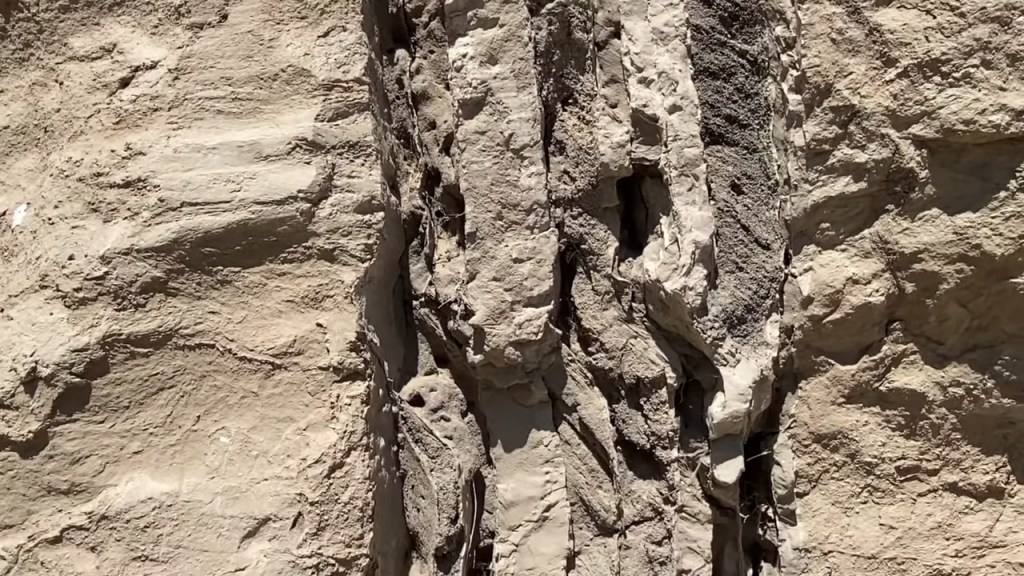
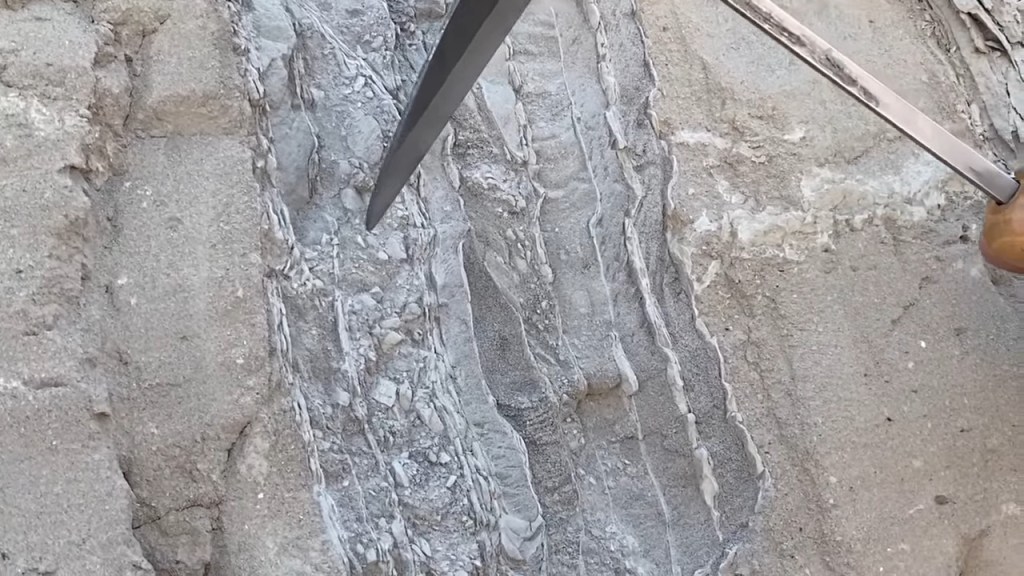
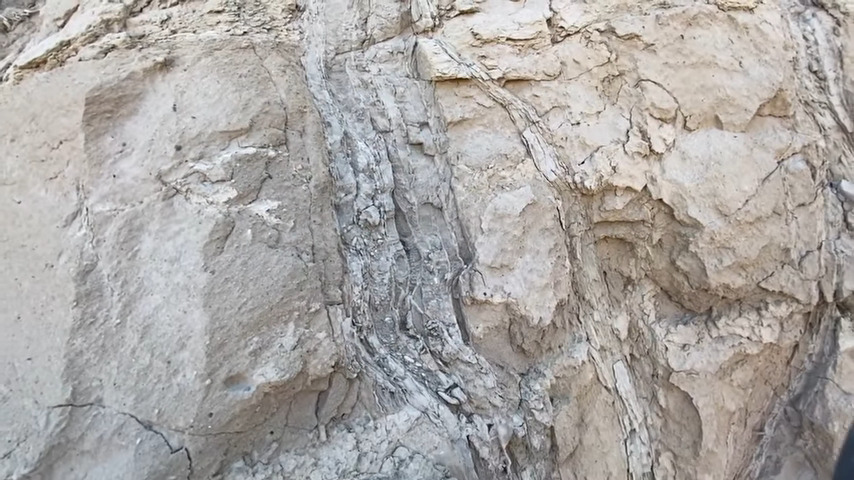
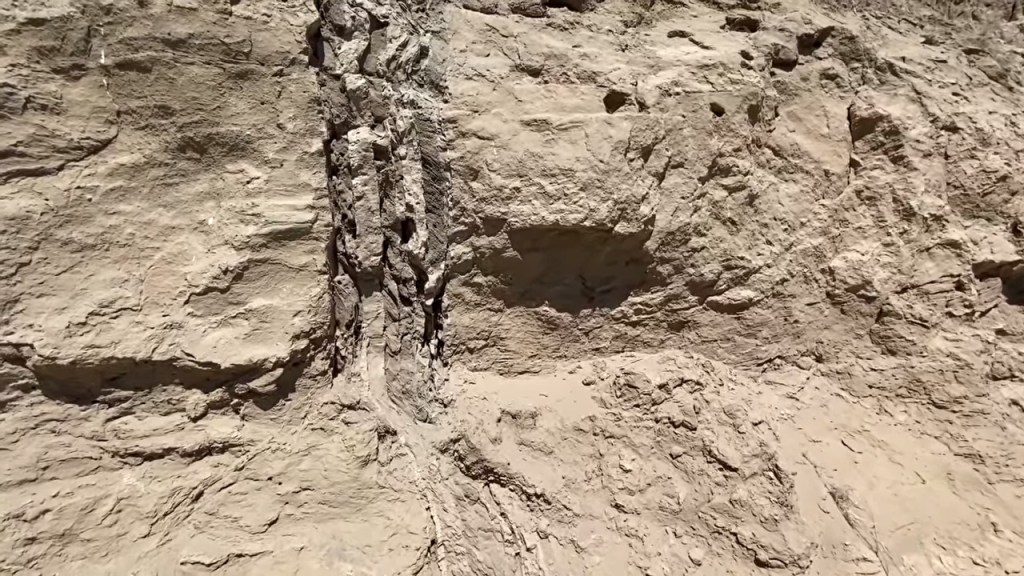
And that is exactly right. Each layer in this dike was a separate funnel of air pulling dust down from different regions of the shock wave bubble, where different grades and types of rock were flowing in segregated jet stream winds. The “funnels” were traveling waves that deposited these dikes in little, downward pointing pressure regime spikes, while the separation bubble filled around them.
It’s hard to think on this scale. The cracks, dikes and veins just shown were produced in the very bottom of a shock wave structure like the one shown in this image. They formed in the turbulent back-end of the separation bubble, a result of friction where the wind literally scraped the ground. Mountains like Everest, the Matterhorn and thousands of lesser peaks were formed by dust filling the entire lambda foot structure, forged by winds and electric potentials that are nearly incomprehensible.
Supersonic winds had to wrap the entire planet. Earth looked like Jupiter, only a lot worse. The fastest winds rolled up and down, and swept against the ground because they were driven by electric currents coupled to the Earth’s. Higher winds moved slower, circulating positive charge in a halo over the concomitant destruction and creation below. Hence the Ouroboros. It did circle the Earth, winding and coiling like a serpent eating it’s tail.
It’s all circuitry. Every feature points to the actions upstream in the current path. That is why the true creation story is knowable. The patterns remain that tell the story. Frequencies, harmonies, wavelengths and wave-guides. Shock waves are wave-guides. Everything is electric. Everyone needs to know this, the sooner the better.
Thank you.
