A monumental shift in ‘critical thinking’ is taking place. People no longer accept scientific claims as scientific fact. They are questioning the “experts”, because thousands of peer-reviewed scientific studies, and the journals that publish them, have been exposed as frauds. Technocrats have used untested theories and their own wishful thinking to portray a version of the “truth” they want us to believe. People are finally awake to the fact that the “reality” they’ve been taught is built on fake narratives.
This is nothing new in the Electric Universe. We have watched the Big Bang cult take control of the narrative for decades, not with proof of their theories, but by hiding their flaws with magical math and closing ranks around a narrated consensus. They then bully outsider’s who suggest alternate theories. It’s been a tactic serially repeated since they vilified Immanuel Velikovsky.
One area this is particularily so is ancient history, where academic interpretations have always been challenged by knowledgable people who see gaps and inconsistencies in the narratives. The academics defend their turf almost as if they are hiding something. Especially regarding theories for past civilizations in a pre-flood era, and the mythologies surrounding the “flood” event itself.
Chief among today’s alternative history theorists is Graham Hancock, who anyone interested in alternative theories certainly knows. He’s hit a nerve with the consensus, so he’s become the latest to be ‘Velikovskied’.
“DeDunking” is Dan Richards’ YouTube channel devoted to “alternative history from the perspective of a skeptic.” For those who follow, you’ll know his channel typically uses science and reason to evaluate, and sometimes defend alternative history theories, like those of Graham Hancock, against the onslaught of consensus-science ‘Karens’, gatekeepers and debunkers.
I compliment his courage and style, as he calls out the many flaws, lies and ad hominem attacks served up by the consensus in defense of their narrative. He seems to be a sincere truth seeker and an influential one at that. He is a credible voice because he is savvy to the powers in control of disinformation. However, his credibility will suffer if he ignores the most competent alternative theories regarding science and ancient history – the ones the consensus was invented to hide. Those would be ours, of course, in the Electric Universe.
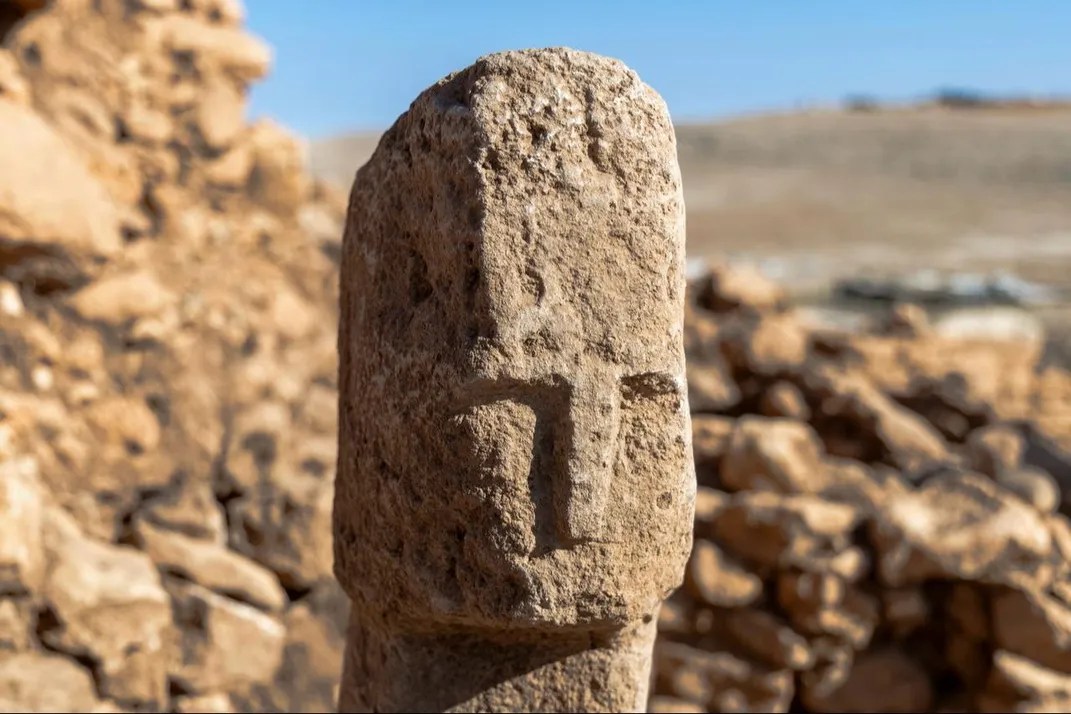
Otherwise, he should have considered it in his video: “New human face carving discovered at Karahan Tepe “T” pillar.” The “T” pillars found at both Karahan Tepe and Gobekli Tepe, I will argue, tell the most significant story of all time. It’s vital to set the record straight about these oldest of all relics, from a time twelve-thousand years ago when the Earth experienced a catastrophic shift in climate. “T” pillars have a story to tell about the very beginning of human society and religion, based upon what people saw in the sky. It is the greatest story of all time. It is the story told in myths. It’s also a story about today, and the battle of narratives vying for everyone’s attention.
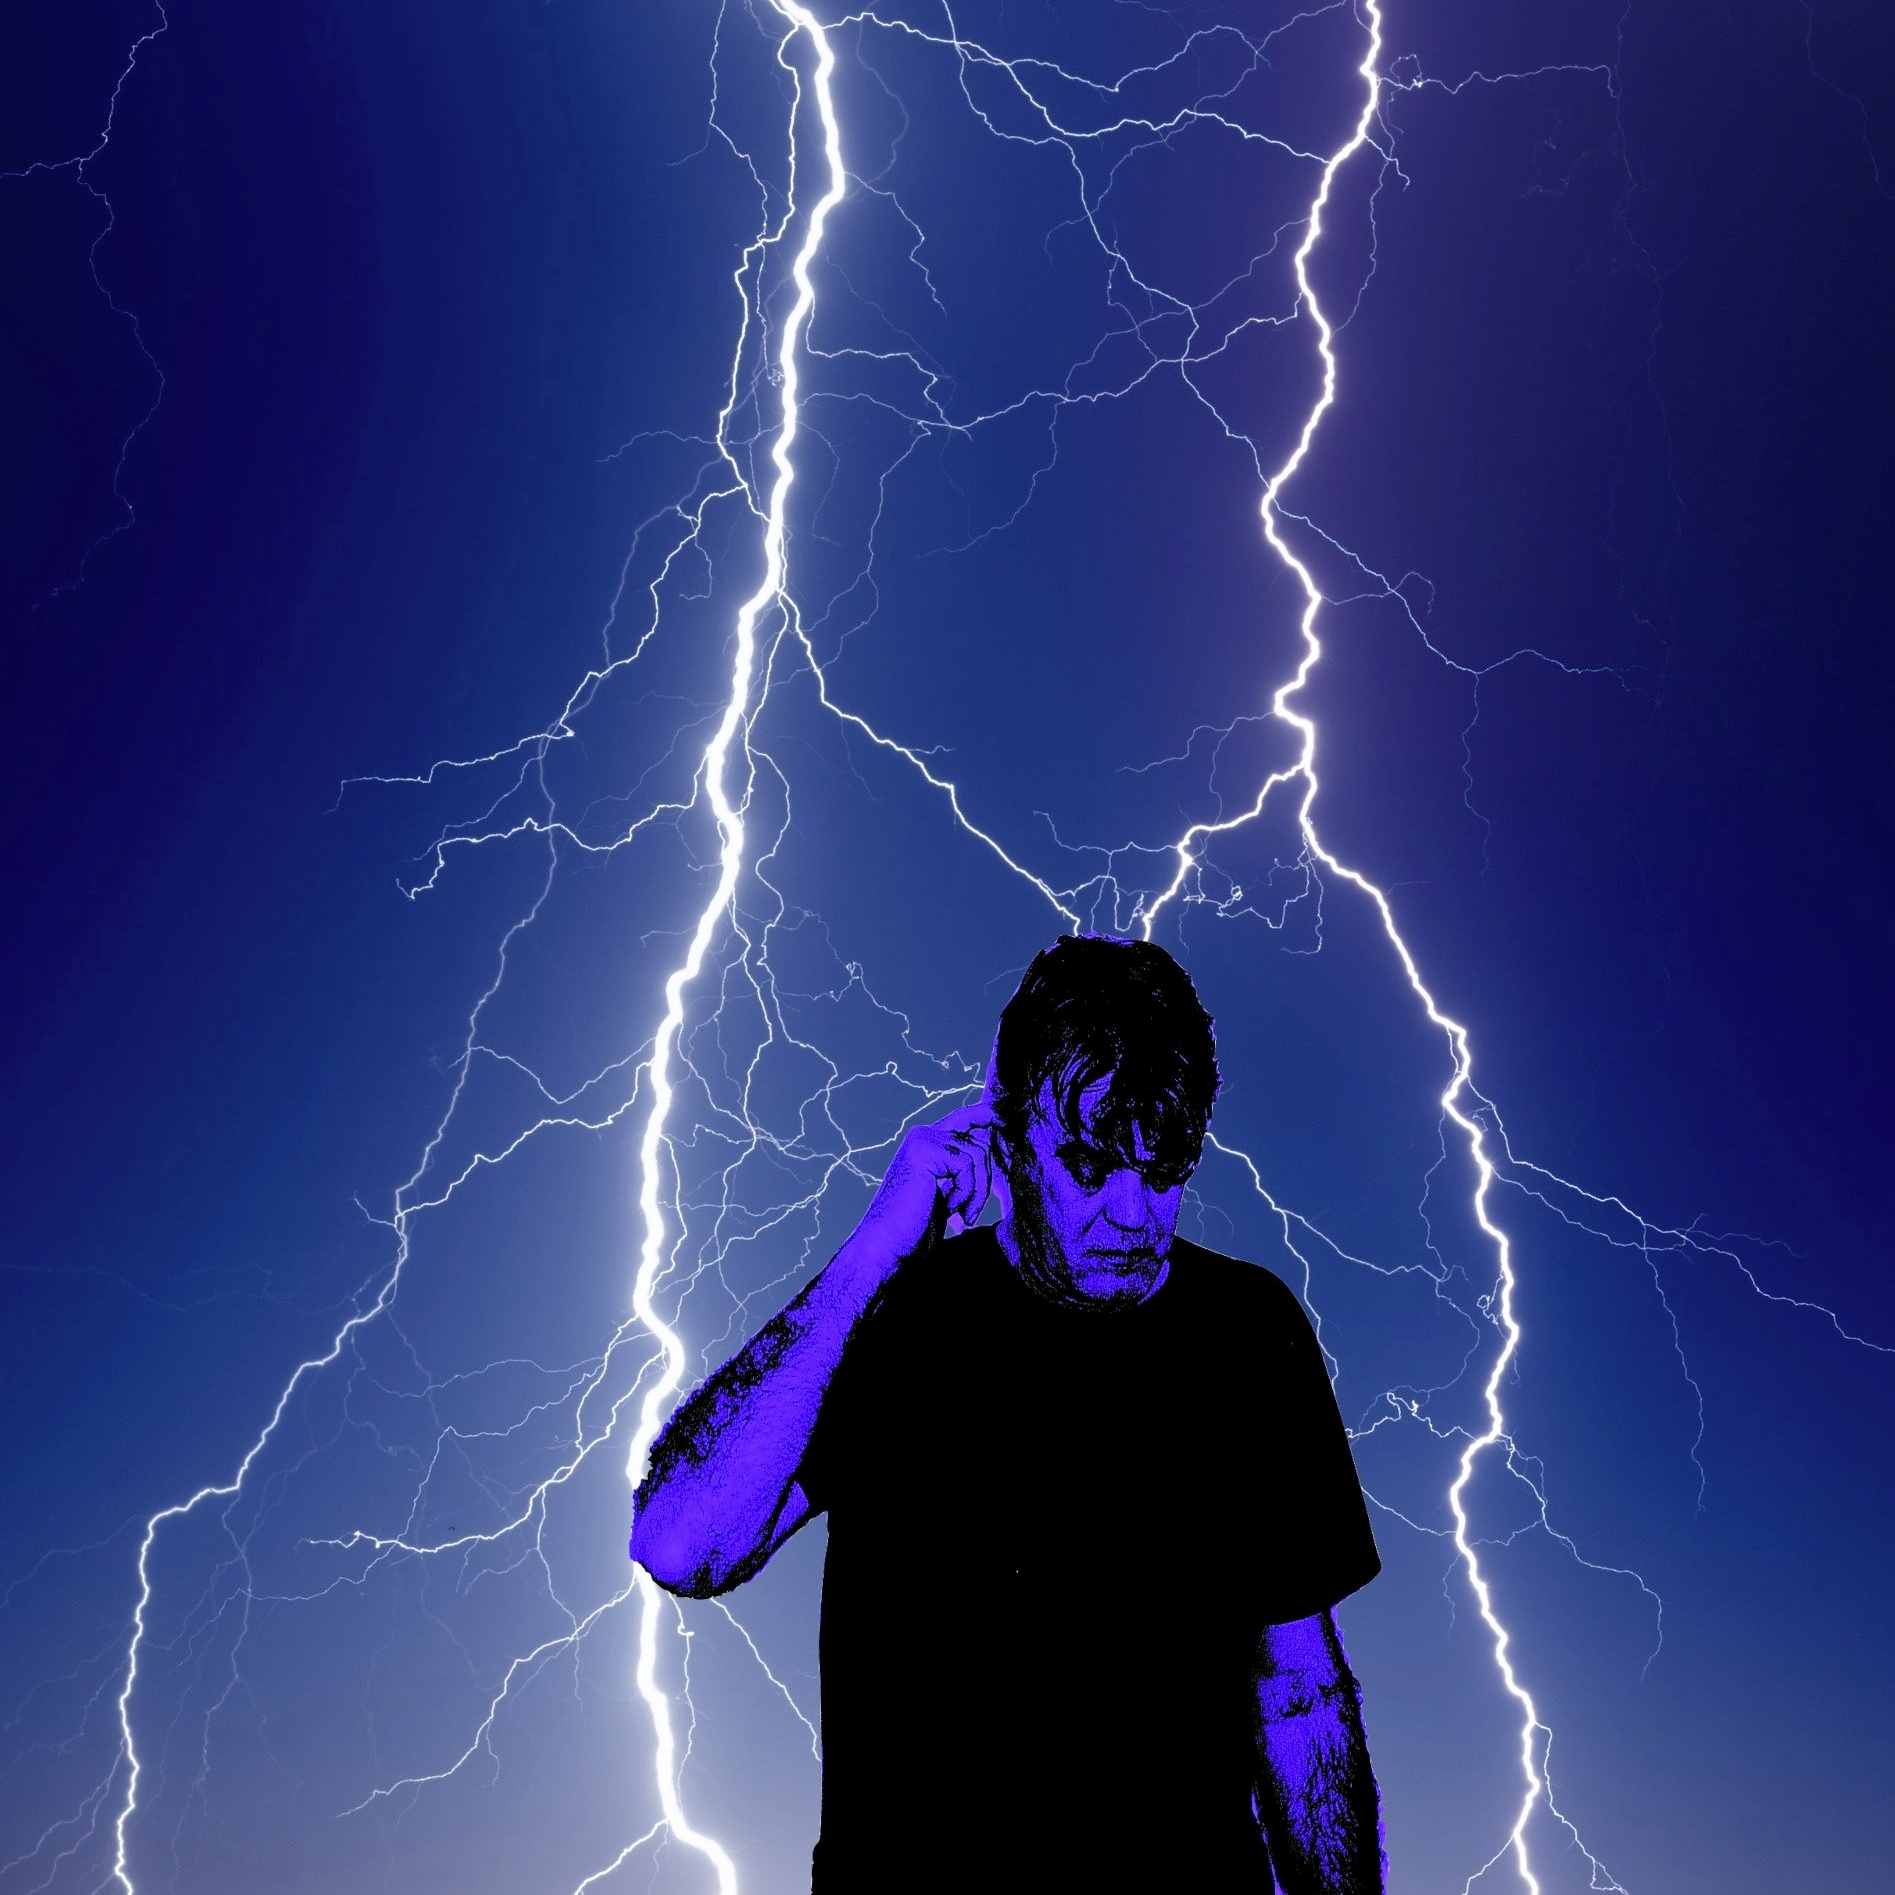
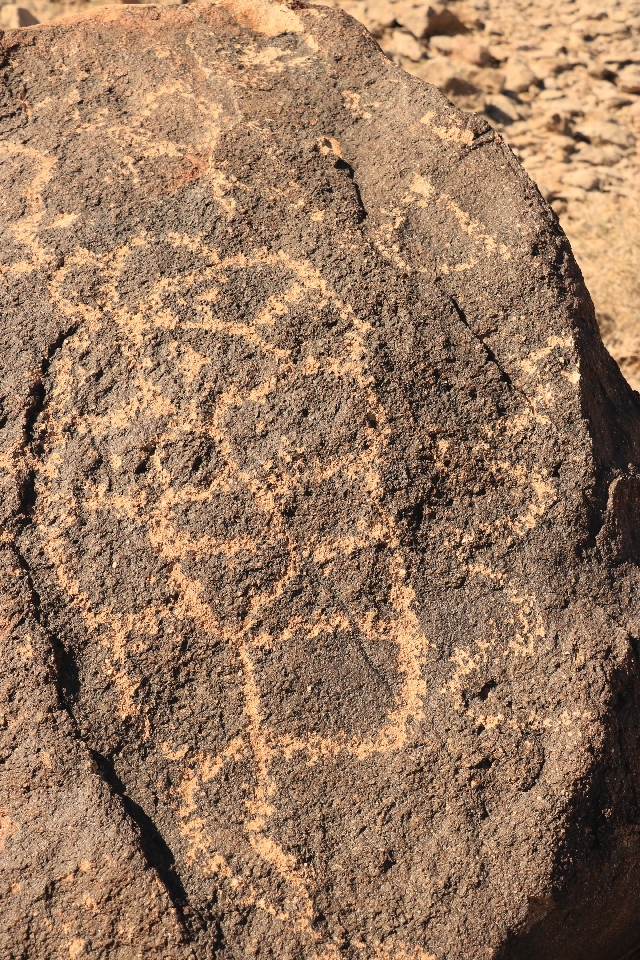
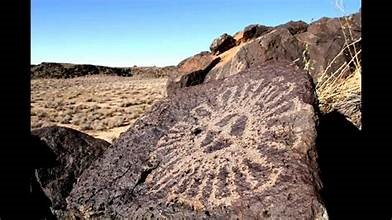
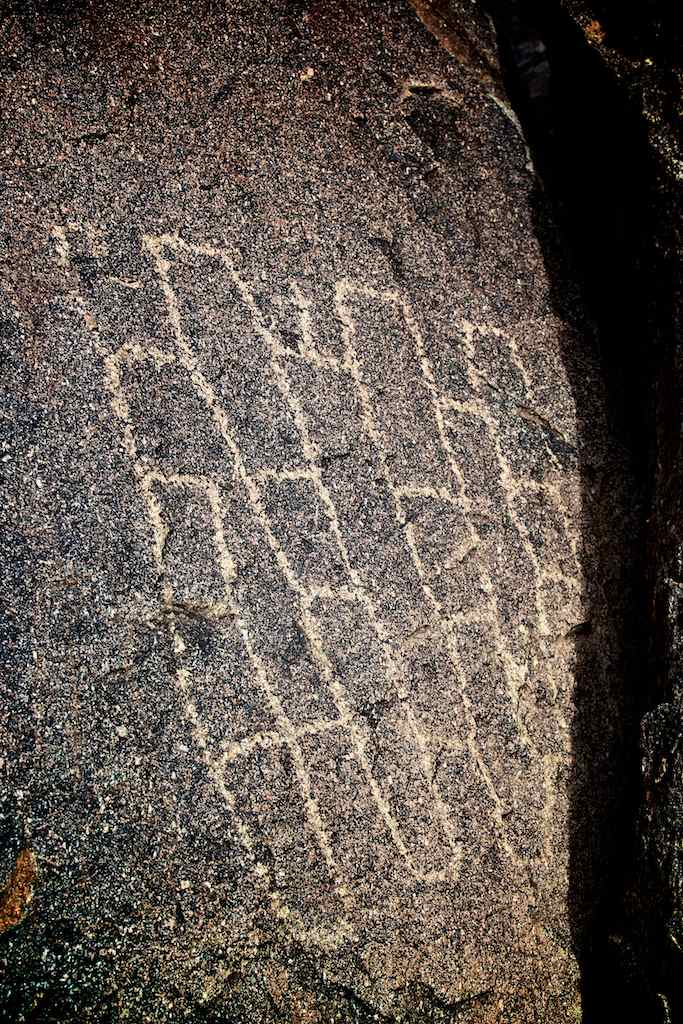
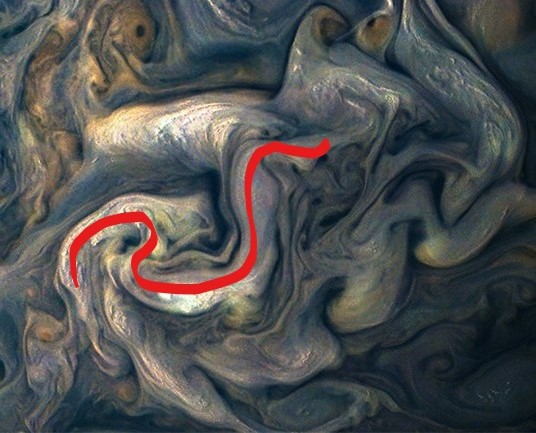
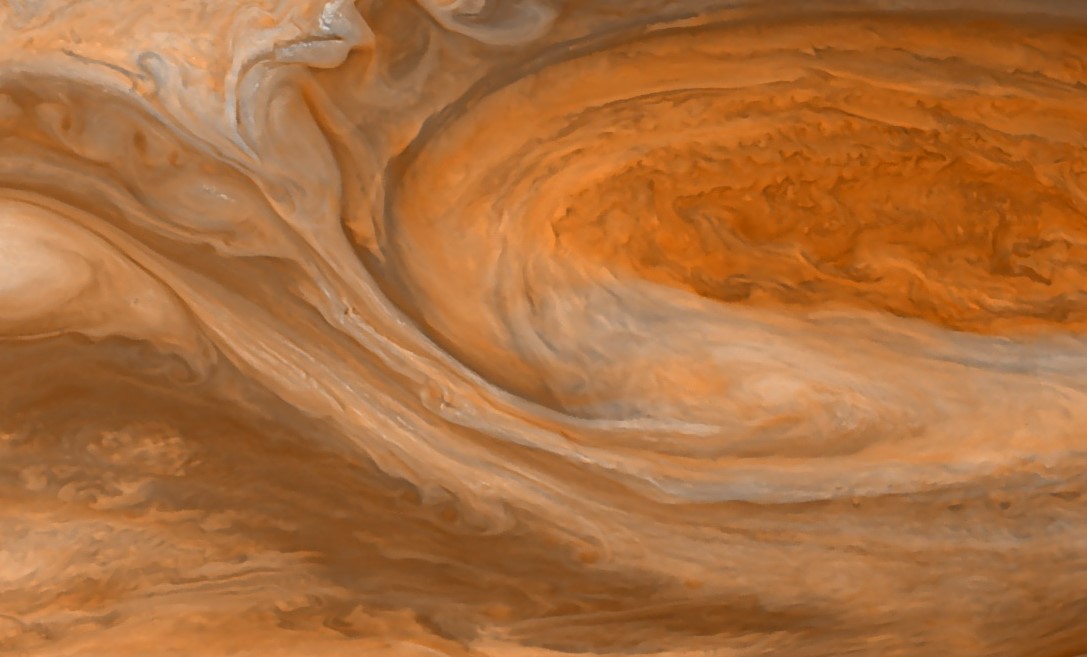
The subject of “T” pillars strikes at the heart of Electric Universe theory. Like the “Squatterman” petroglyphs that Anthony Peratt proved depict a high intensity space storm besieging the Earth, the pillars also depict a plasma phenomena. Dan, being a voice of agnostic moderation, sorting actual fact from the fictions of the consensus and open-mindedly considering alternatives in the way science should, needs to consider our theories.
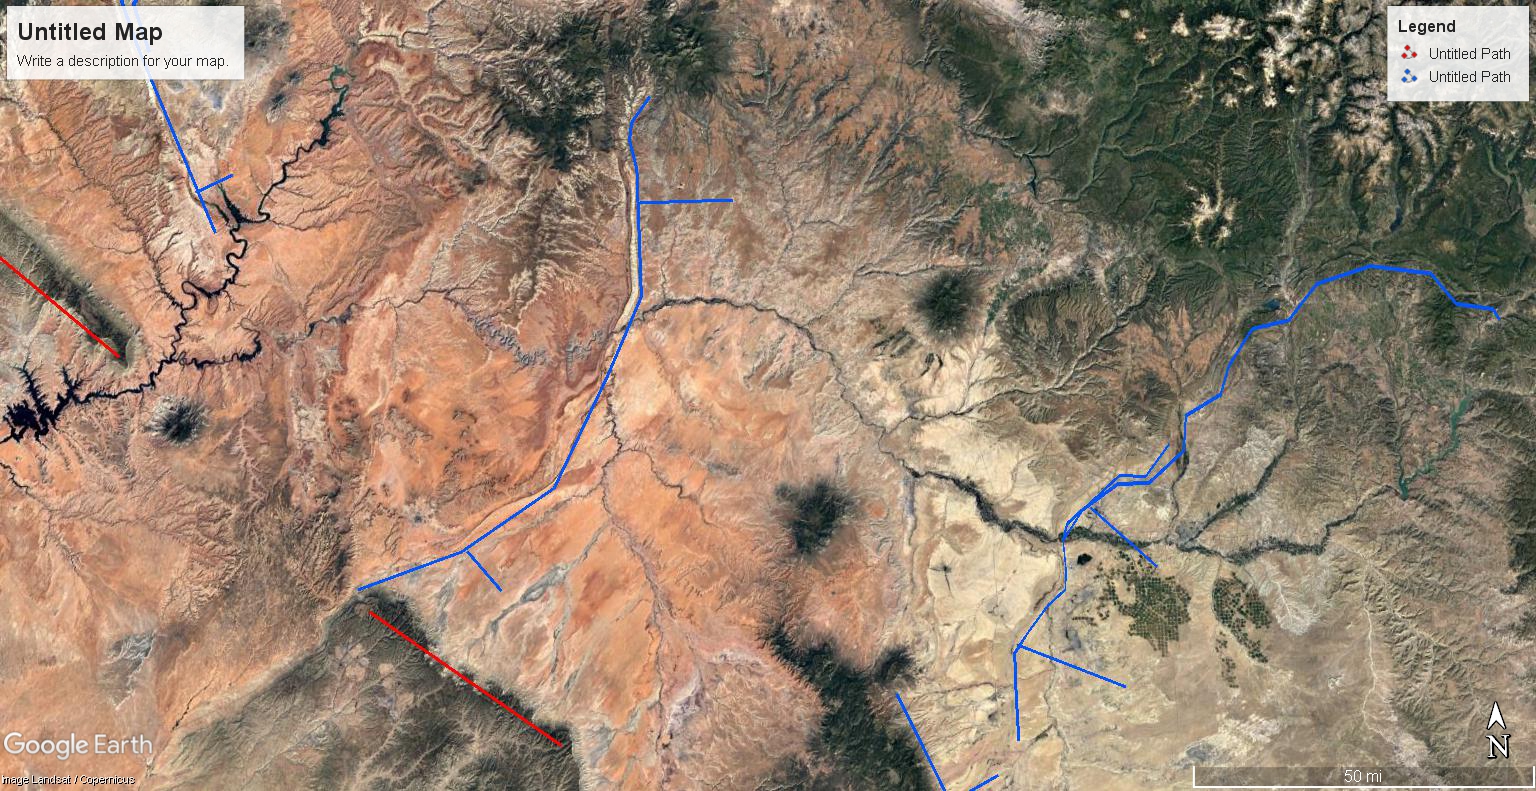
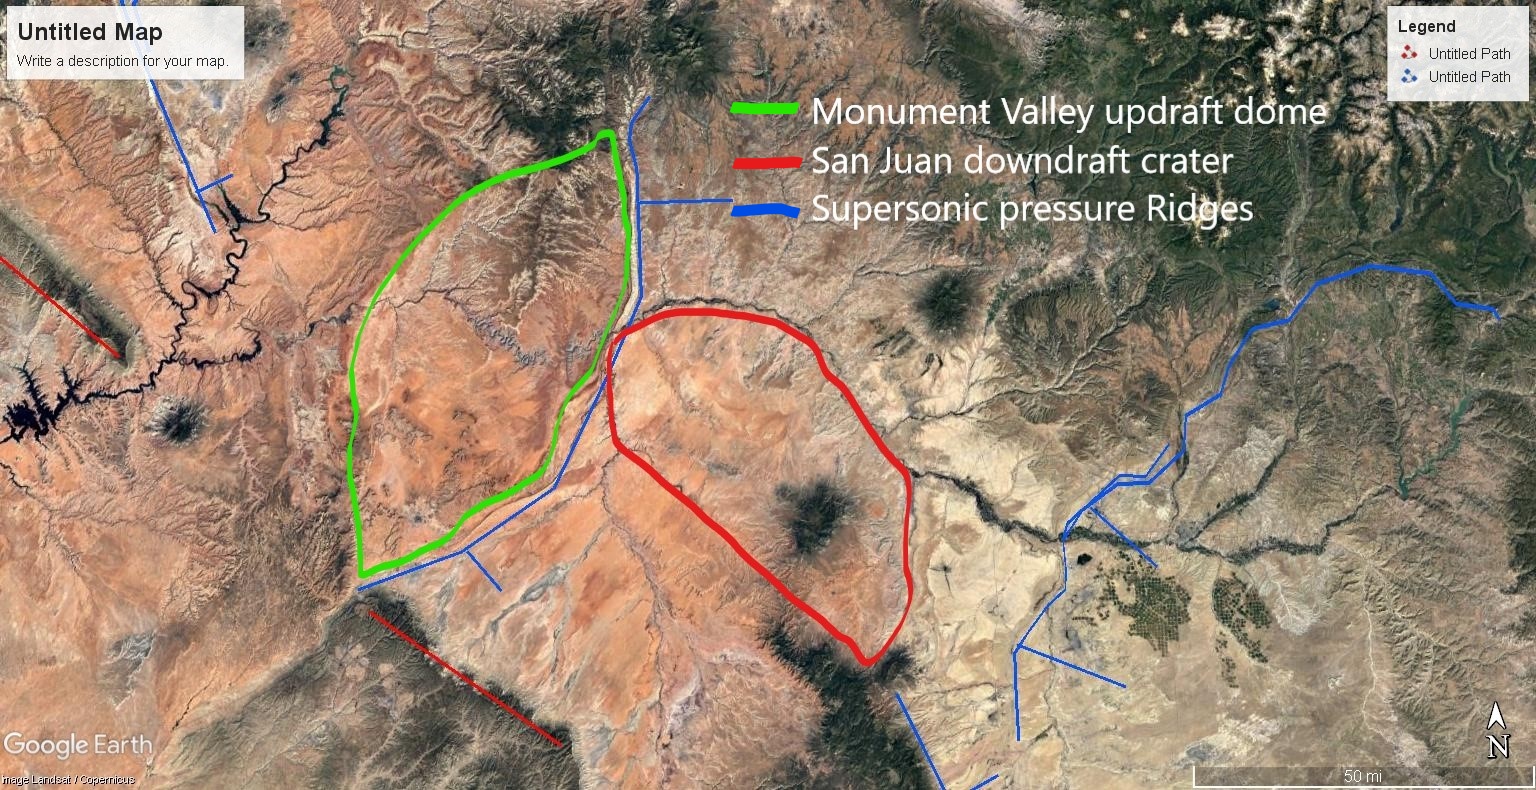
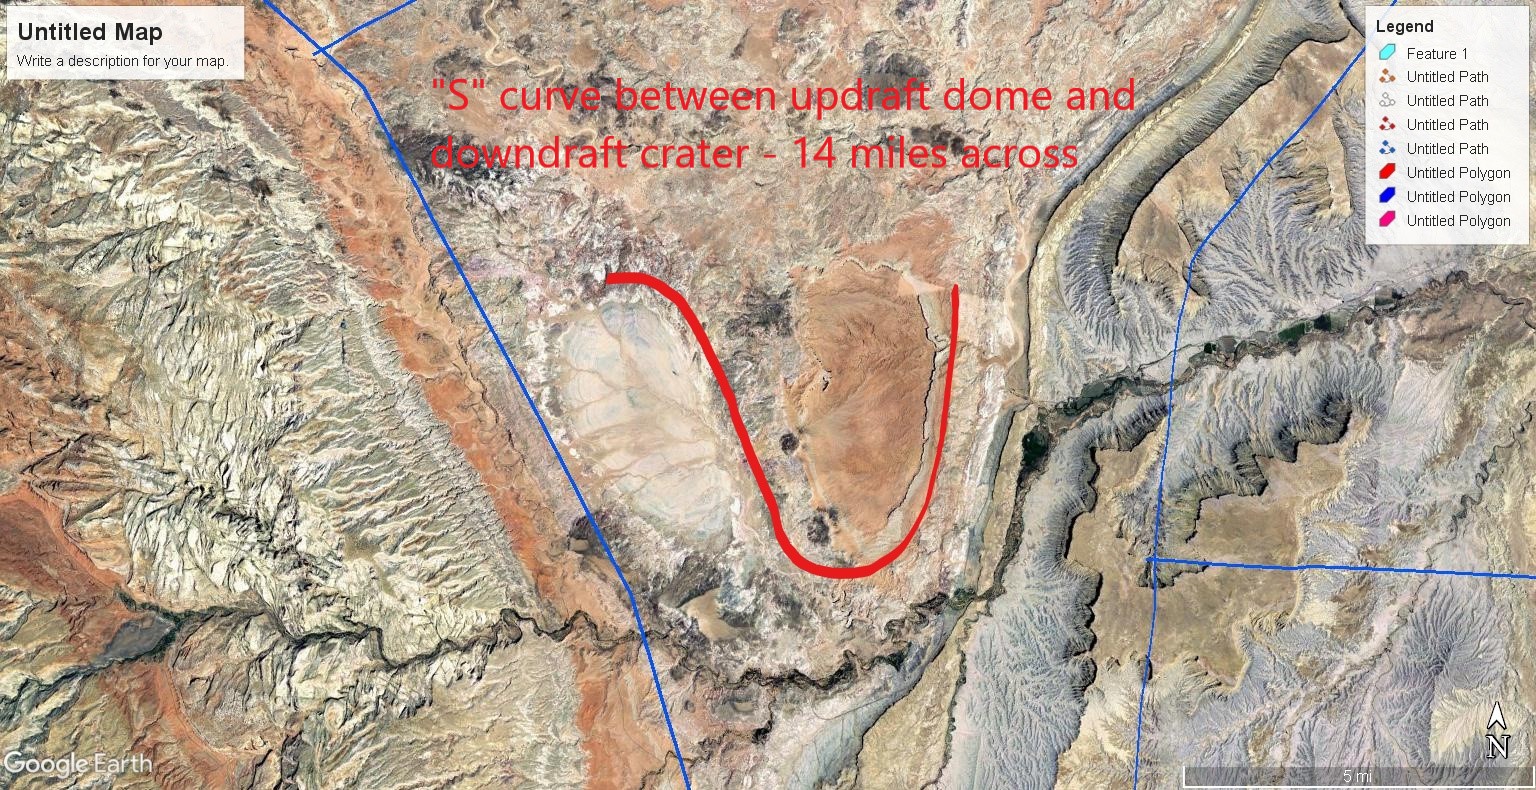
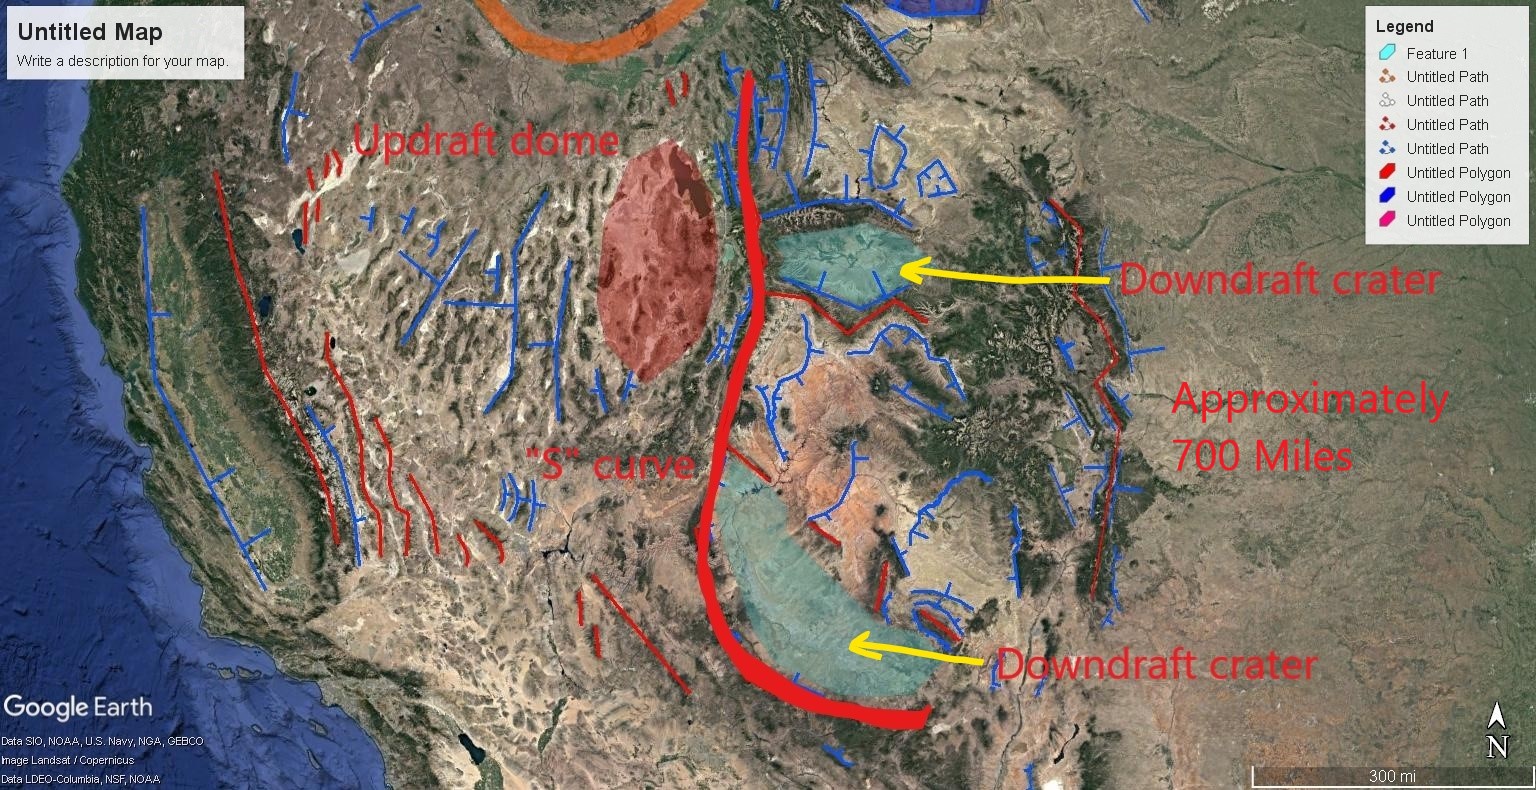
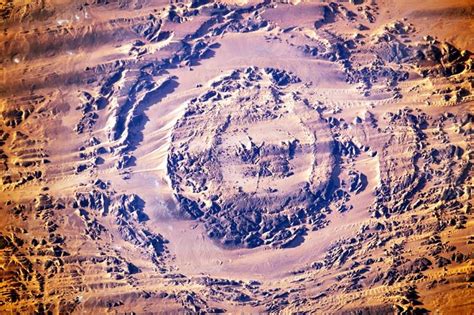
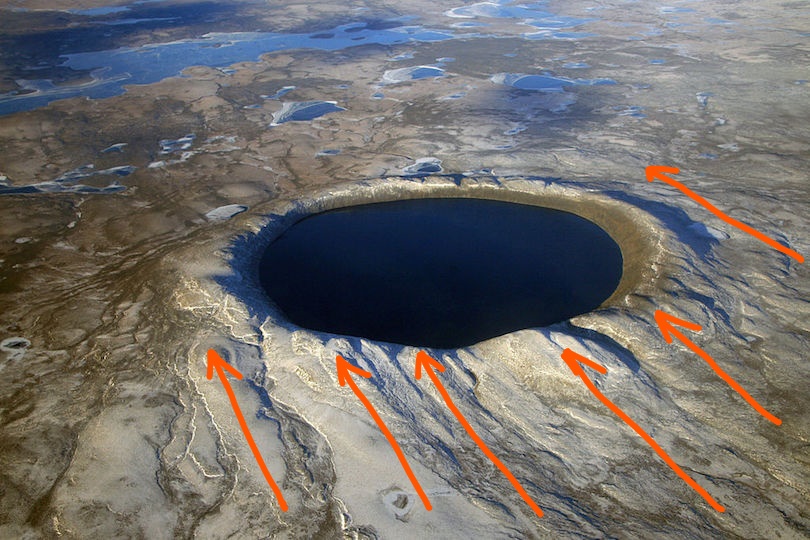
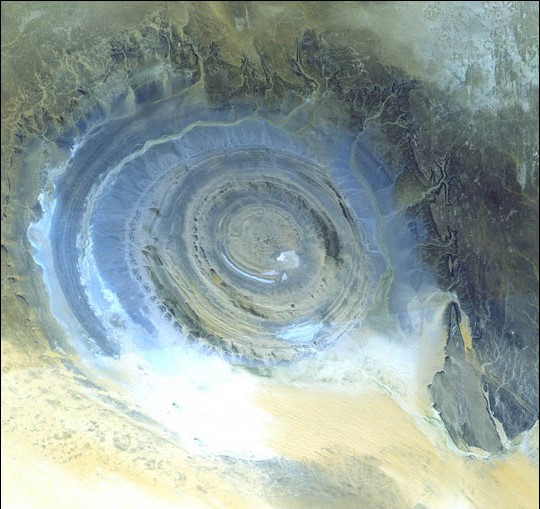
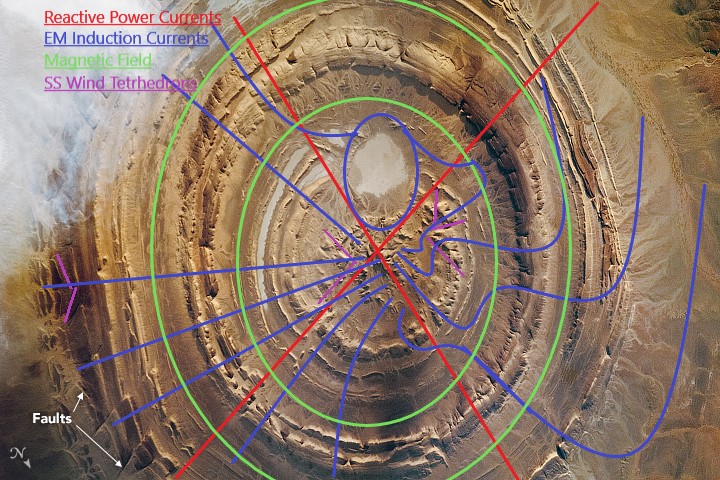
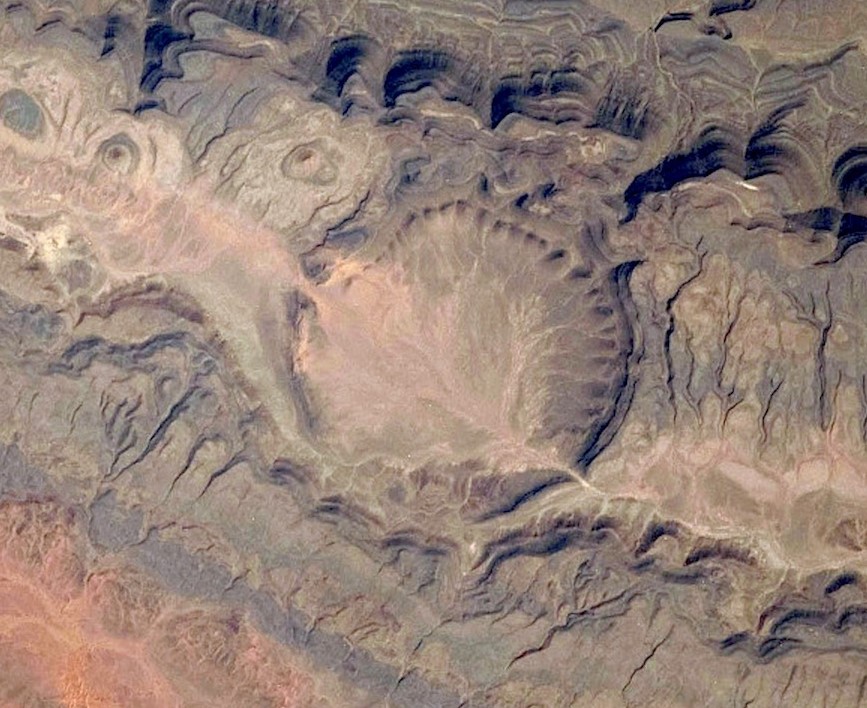
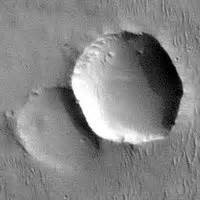
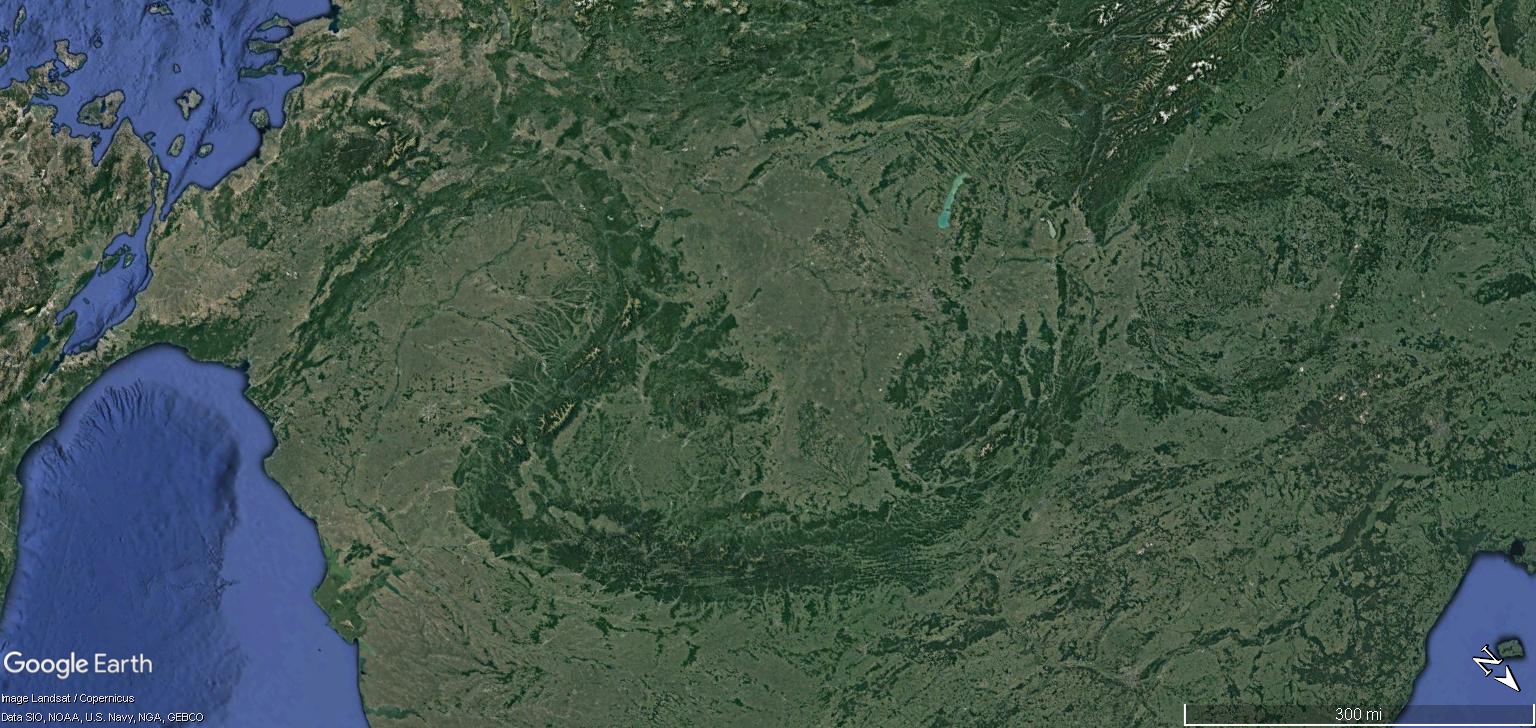
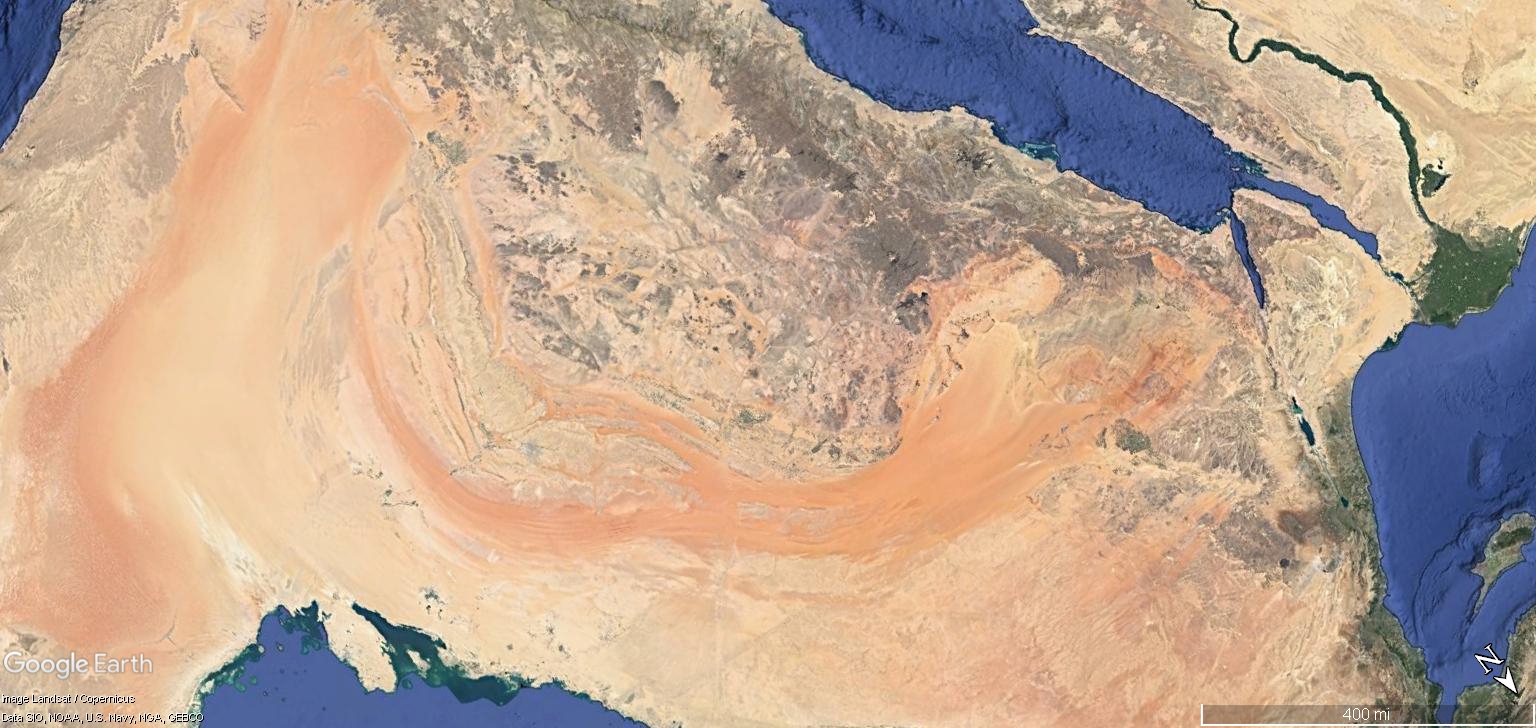
In his video, he only considers the typical geological catch-all called impact theory. Catastrophists jump to this conclusion because they are brainwashed by consensus science to believe craters are made by meteor impacts. I don’t think he knows impact theory is based on scientist’s say so, not repeatable tests that prove it. The only crater feature an impact can make is a hole. The only way to make craters in a lab with the features we actually see on the Moon, Earth and elsewhere; like doublets, rim craters, crater chains, rilles and hexagons, is with electricity. That is why scientists never find the actual meteors that made purported craters. They are from sparks, not meteors.
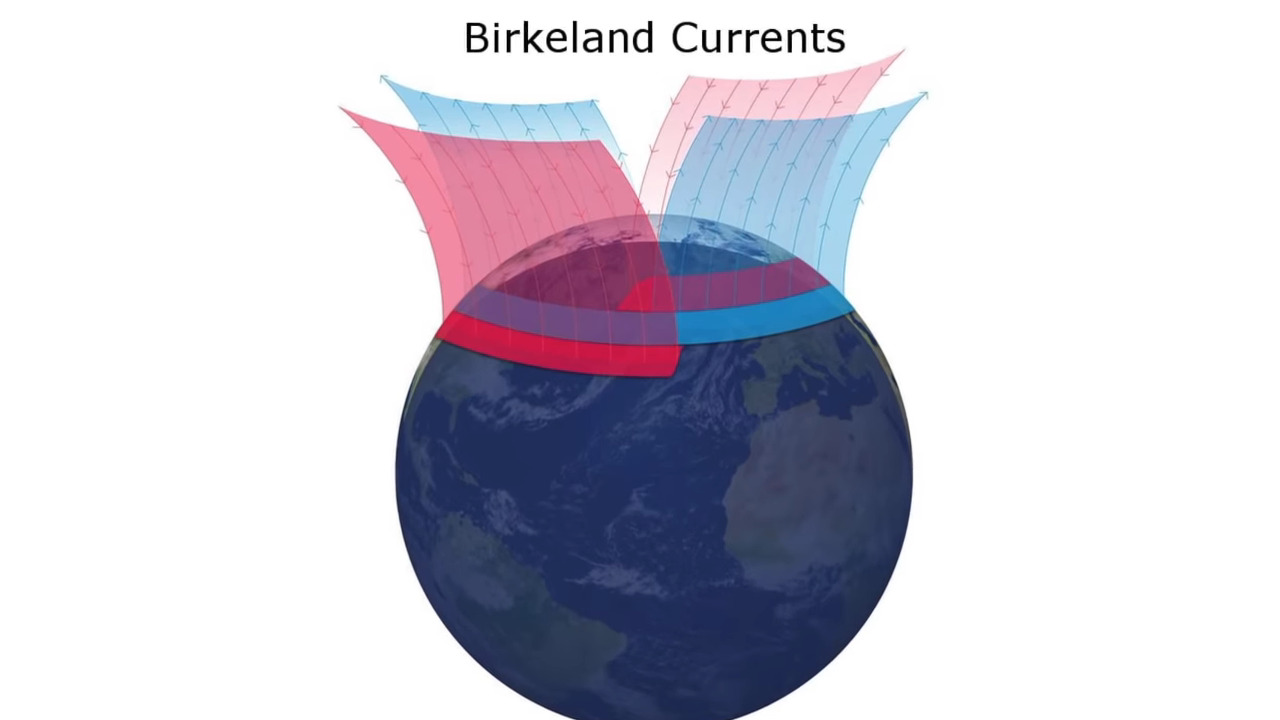
It’s my hope he will be made aware of Kristian Birkeland’s currents, Hannes Alfven’s magnetohydrodynamics, Anthony Peratt’s Plasma Universe, Robert Schoch’s Solar Storm theory and the Electric Universe body of work and ReDunk his Dedunk with more electricity. Turn the lights on, Dan.
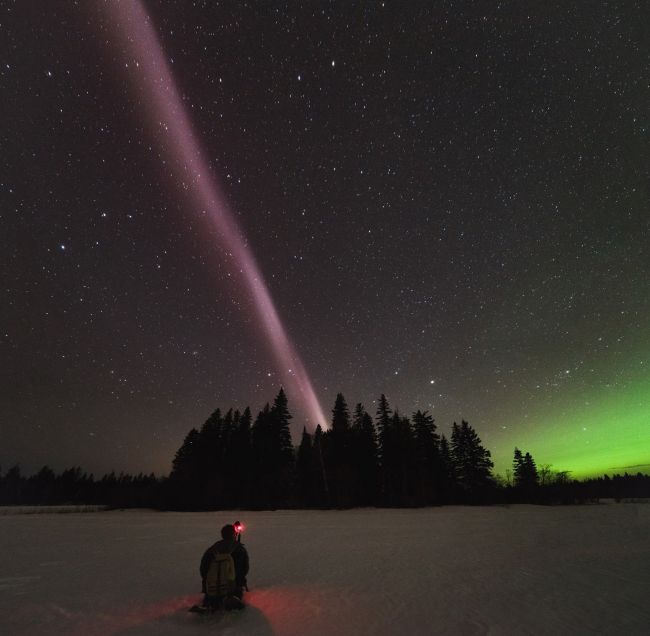
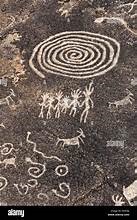
Dr. Peratt, a world leading nuclear plasma engineer, documented the petroglyphs around the planet, verified the imagery matched with high energy plasma instabilities and proved they were consistently oriented with a view to the sky where such aurora would appear in Earth’s magnetic field. His work is compelling evidence – no, actually it’s proof – that ancient humans witnessed severe space weather due to a high energy event in the Solar System, which lit-up Earth’s magnetic field with induced electric currents, creating glowing plasma figures in the sky.


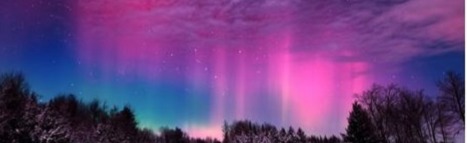
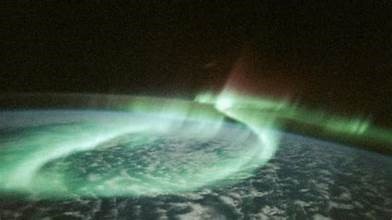
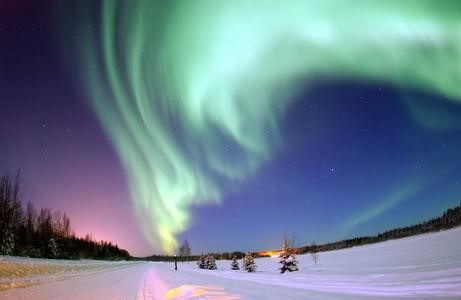
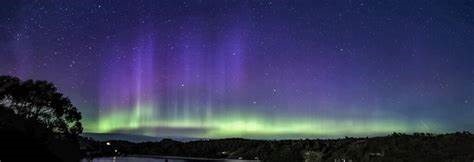
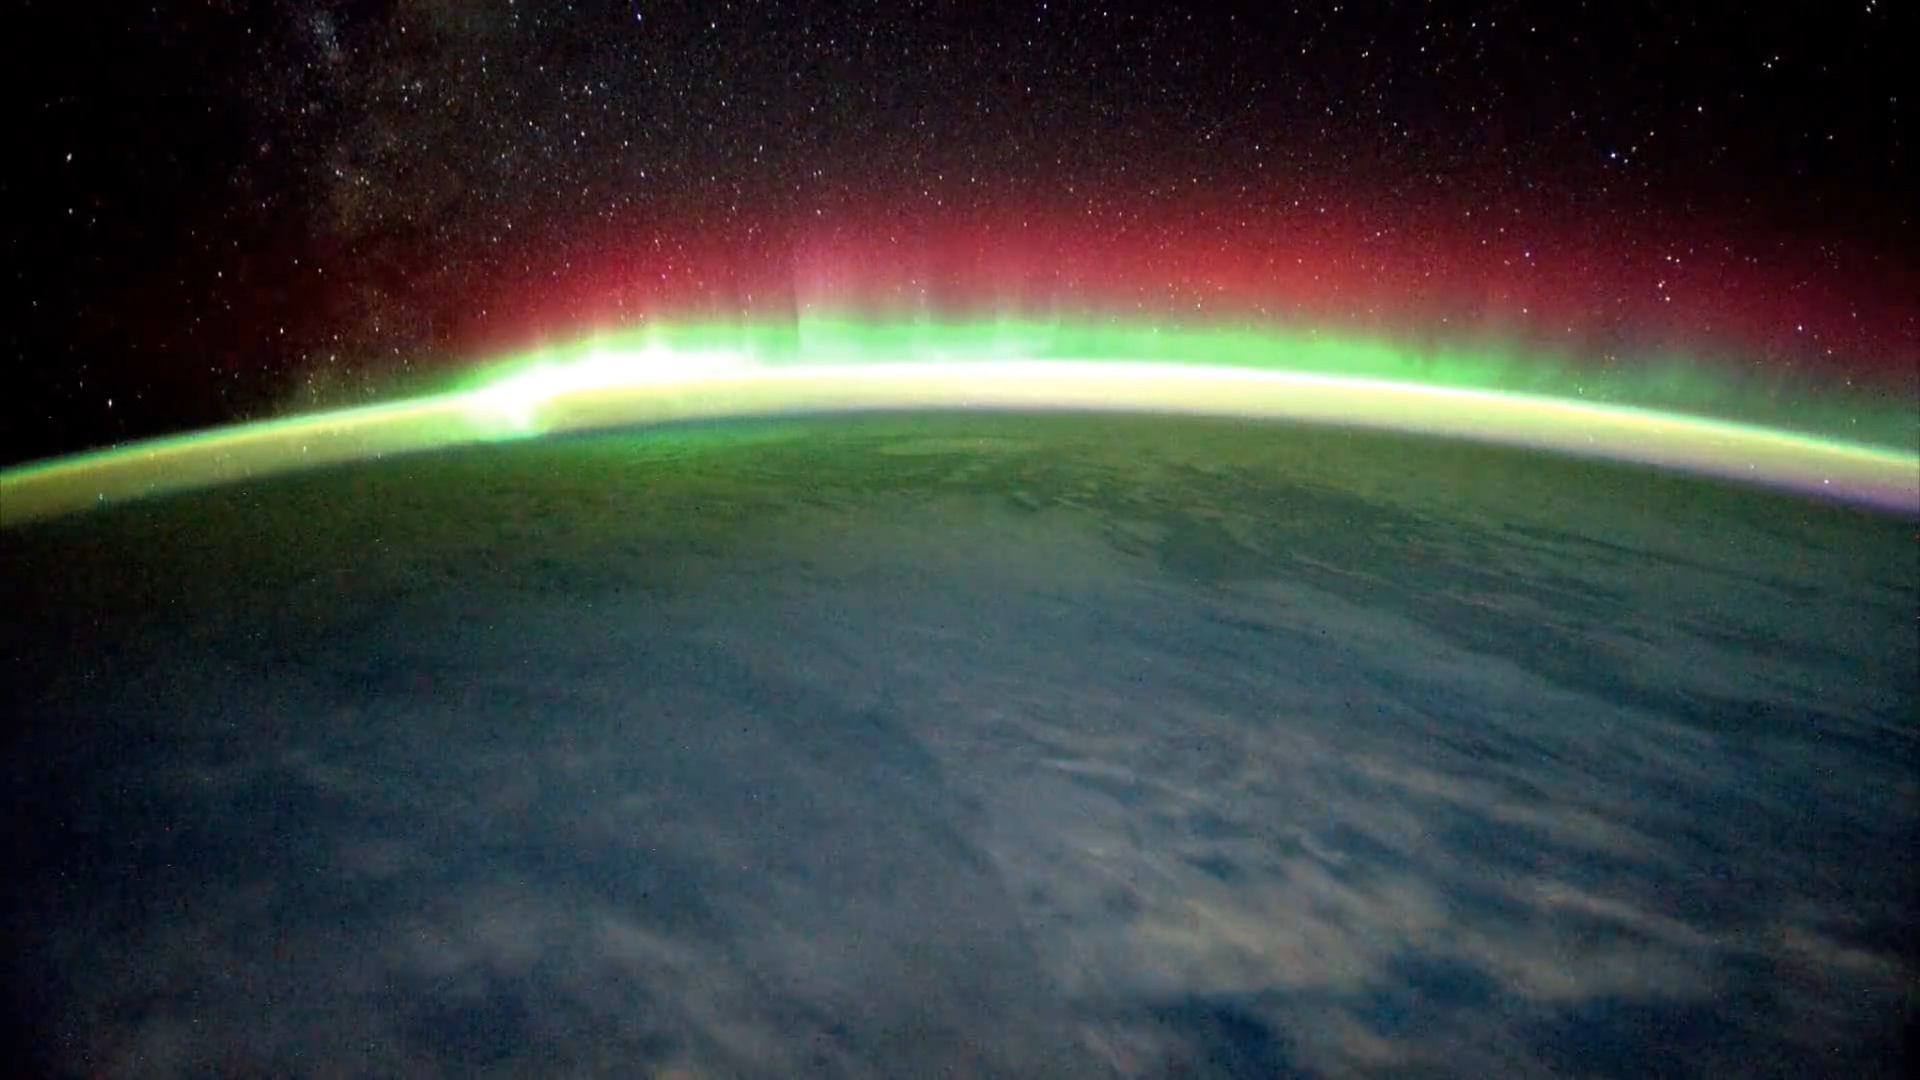
They were aurora, like the multi-colored Northern Lights, only farther from the Earth and ghostly white, since the gases that make the colors would not be present that deep in space. However, the same magnetic field that lit-up in space also connected with the Earth, not only at the poles, but all around the globe. Whatever occurred in space sent huge amounts of energy into Earth’s magnetic field, amping it up to a scale we can only imagine. Parts of it lit, because ions and electrons gathered to form coaxial circuits of plasma along magnetic field lines aimed at the Earth.
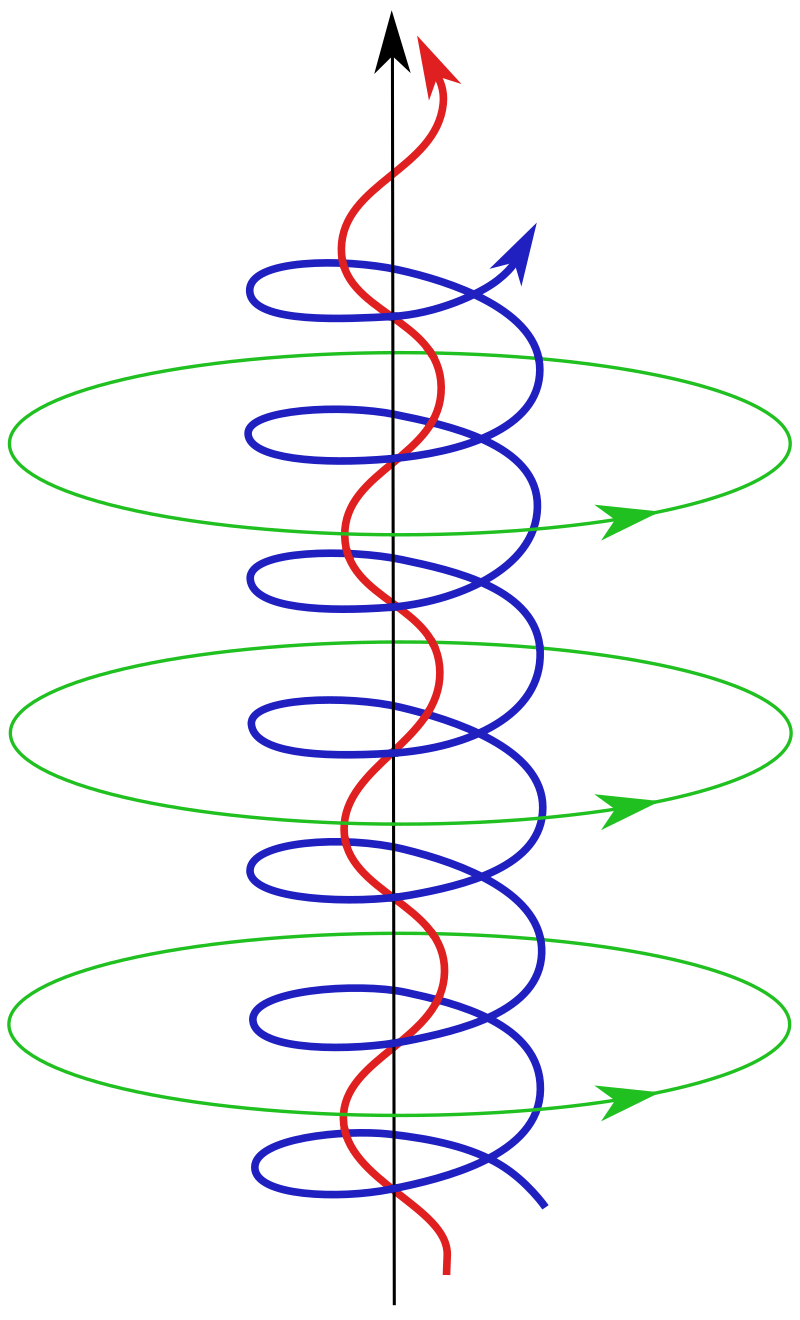
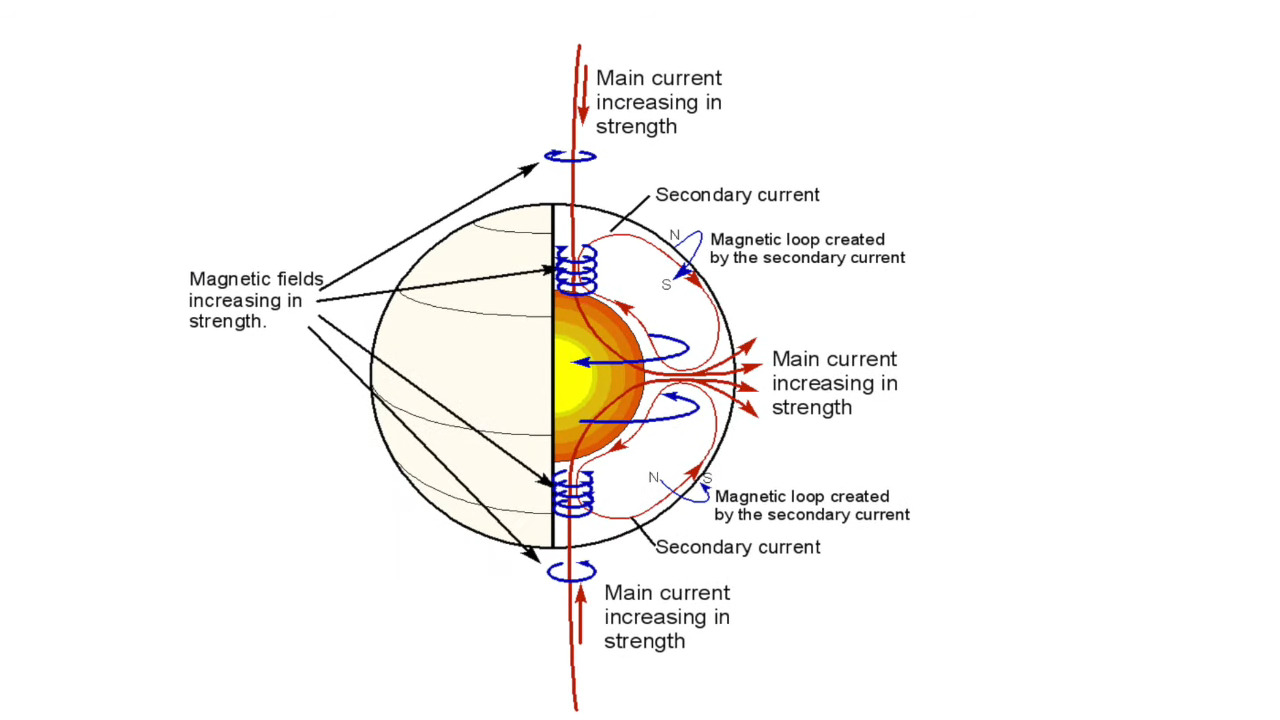
Earth’s magnetic field begins and ends inside the Earth, so current gathered in it’s outer shells is inducted internally. Physics says so. Who would know better than Nobel Prize winner Hannes Alfven, the one person on the planet who best understood plasma, and insisted this must be so in his electrical model of stars. The scientific community pretends that didn’t happen.
The model applies to stars and “living” planets with an active magnetic field. This is electrically how the magnetic field is generated for all stars and planets. The consensus idea that Earth has a core of iron spinning like a frictionless ball-bearing inside a matrix of molten rock for billions of years generating it’s magnetic field – while other planets and stars generate their magnetic field by some other means – is absurd when physics tells us magnetic fields require an electric current.
If they rely on “science”, why don’t scientists admit that, according to physics, the magnetic field must have an electric current generating it, and look for that inside the Earth. Instead they say it’s an impossible, frictionless, spinning iron ball and neglect electricity altogether. It’s even more absurd since aurora allow us to see electric currents feeding massive energy to the planet!
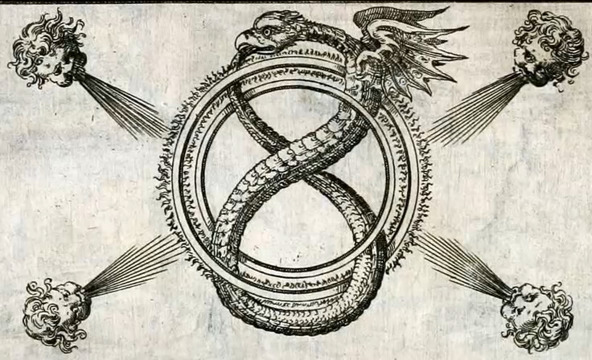
Petroglyphs tell us the Earth’s magnetic field was glowing with current and “z-pinching”, which means incredibly high energies were involved. The amped-up magnetic field had to strengthen and constrict around the Earth like Leviathan, ionizing atmosphere and inducing surface charge on the ground beneath.
Where the energy passed through the atmosphere, storms of biblical proportion raged. How we know is that the Bible says so, and so does every other mythology from ancient times. In fact, the myths talk of storms so much, so explicitly, in so many ways that it’s absurd we don’t get the message. The earliest gods of myth and religion were storm gods.
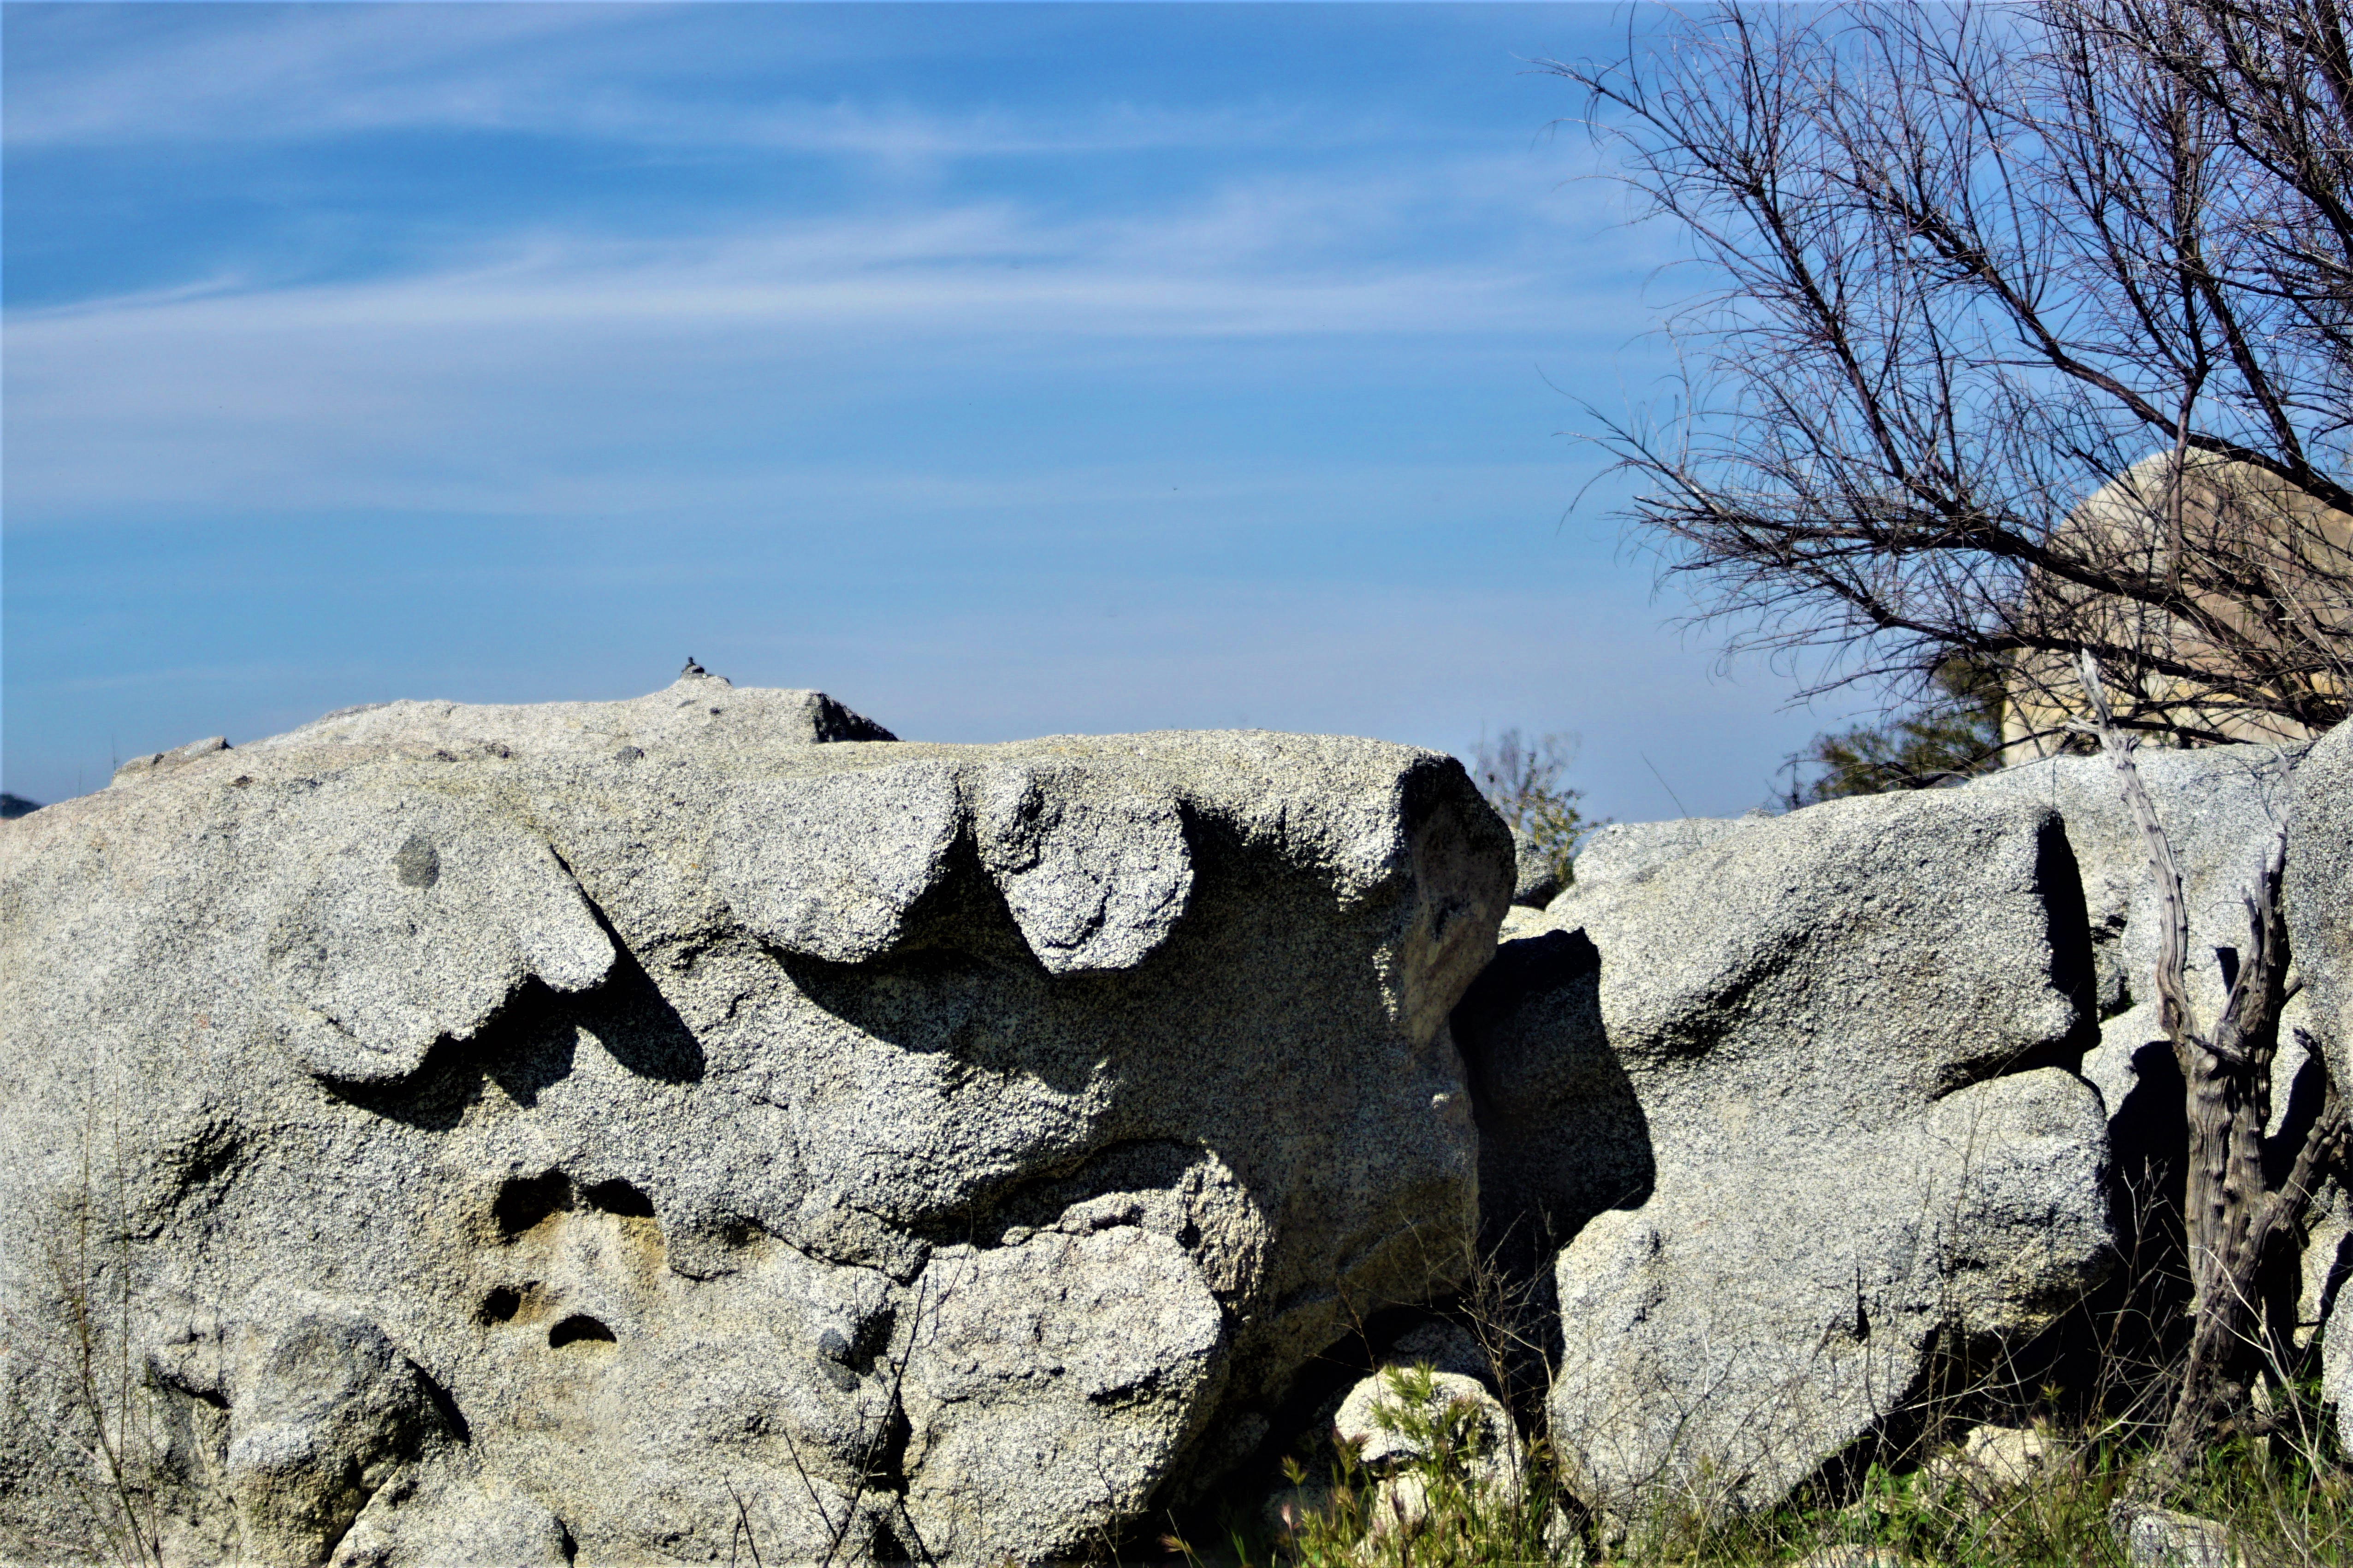
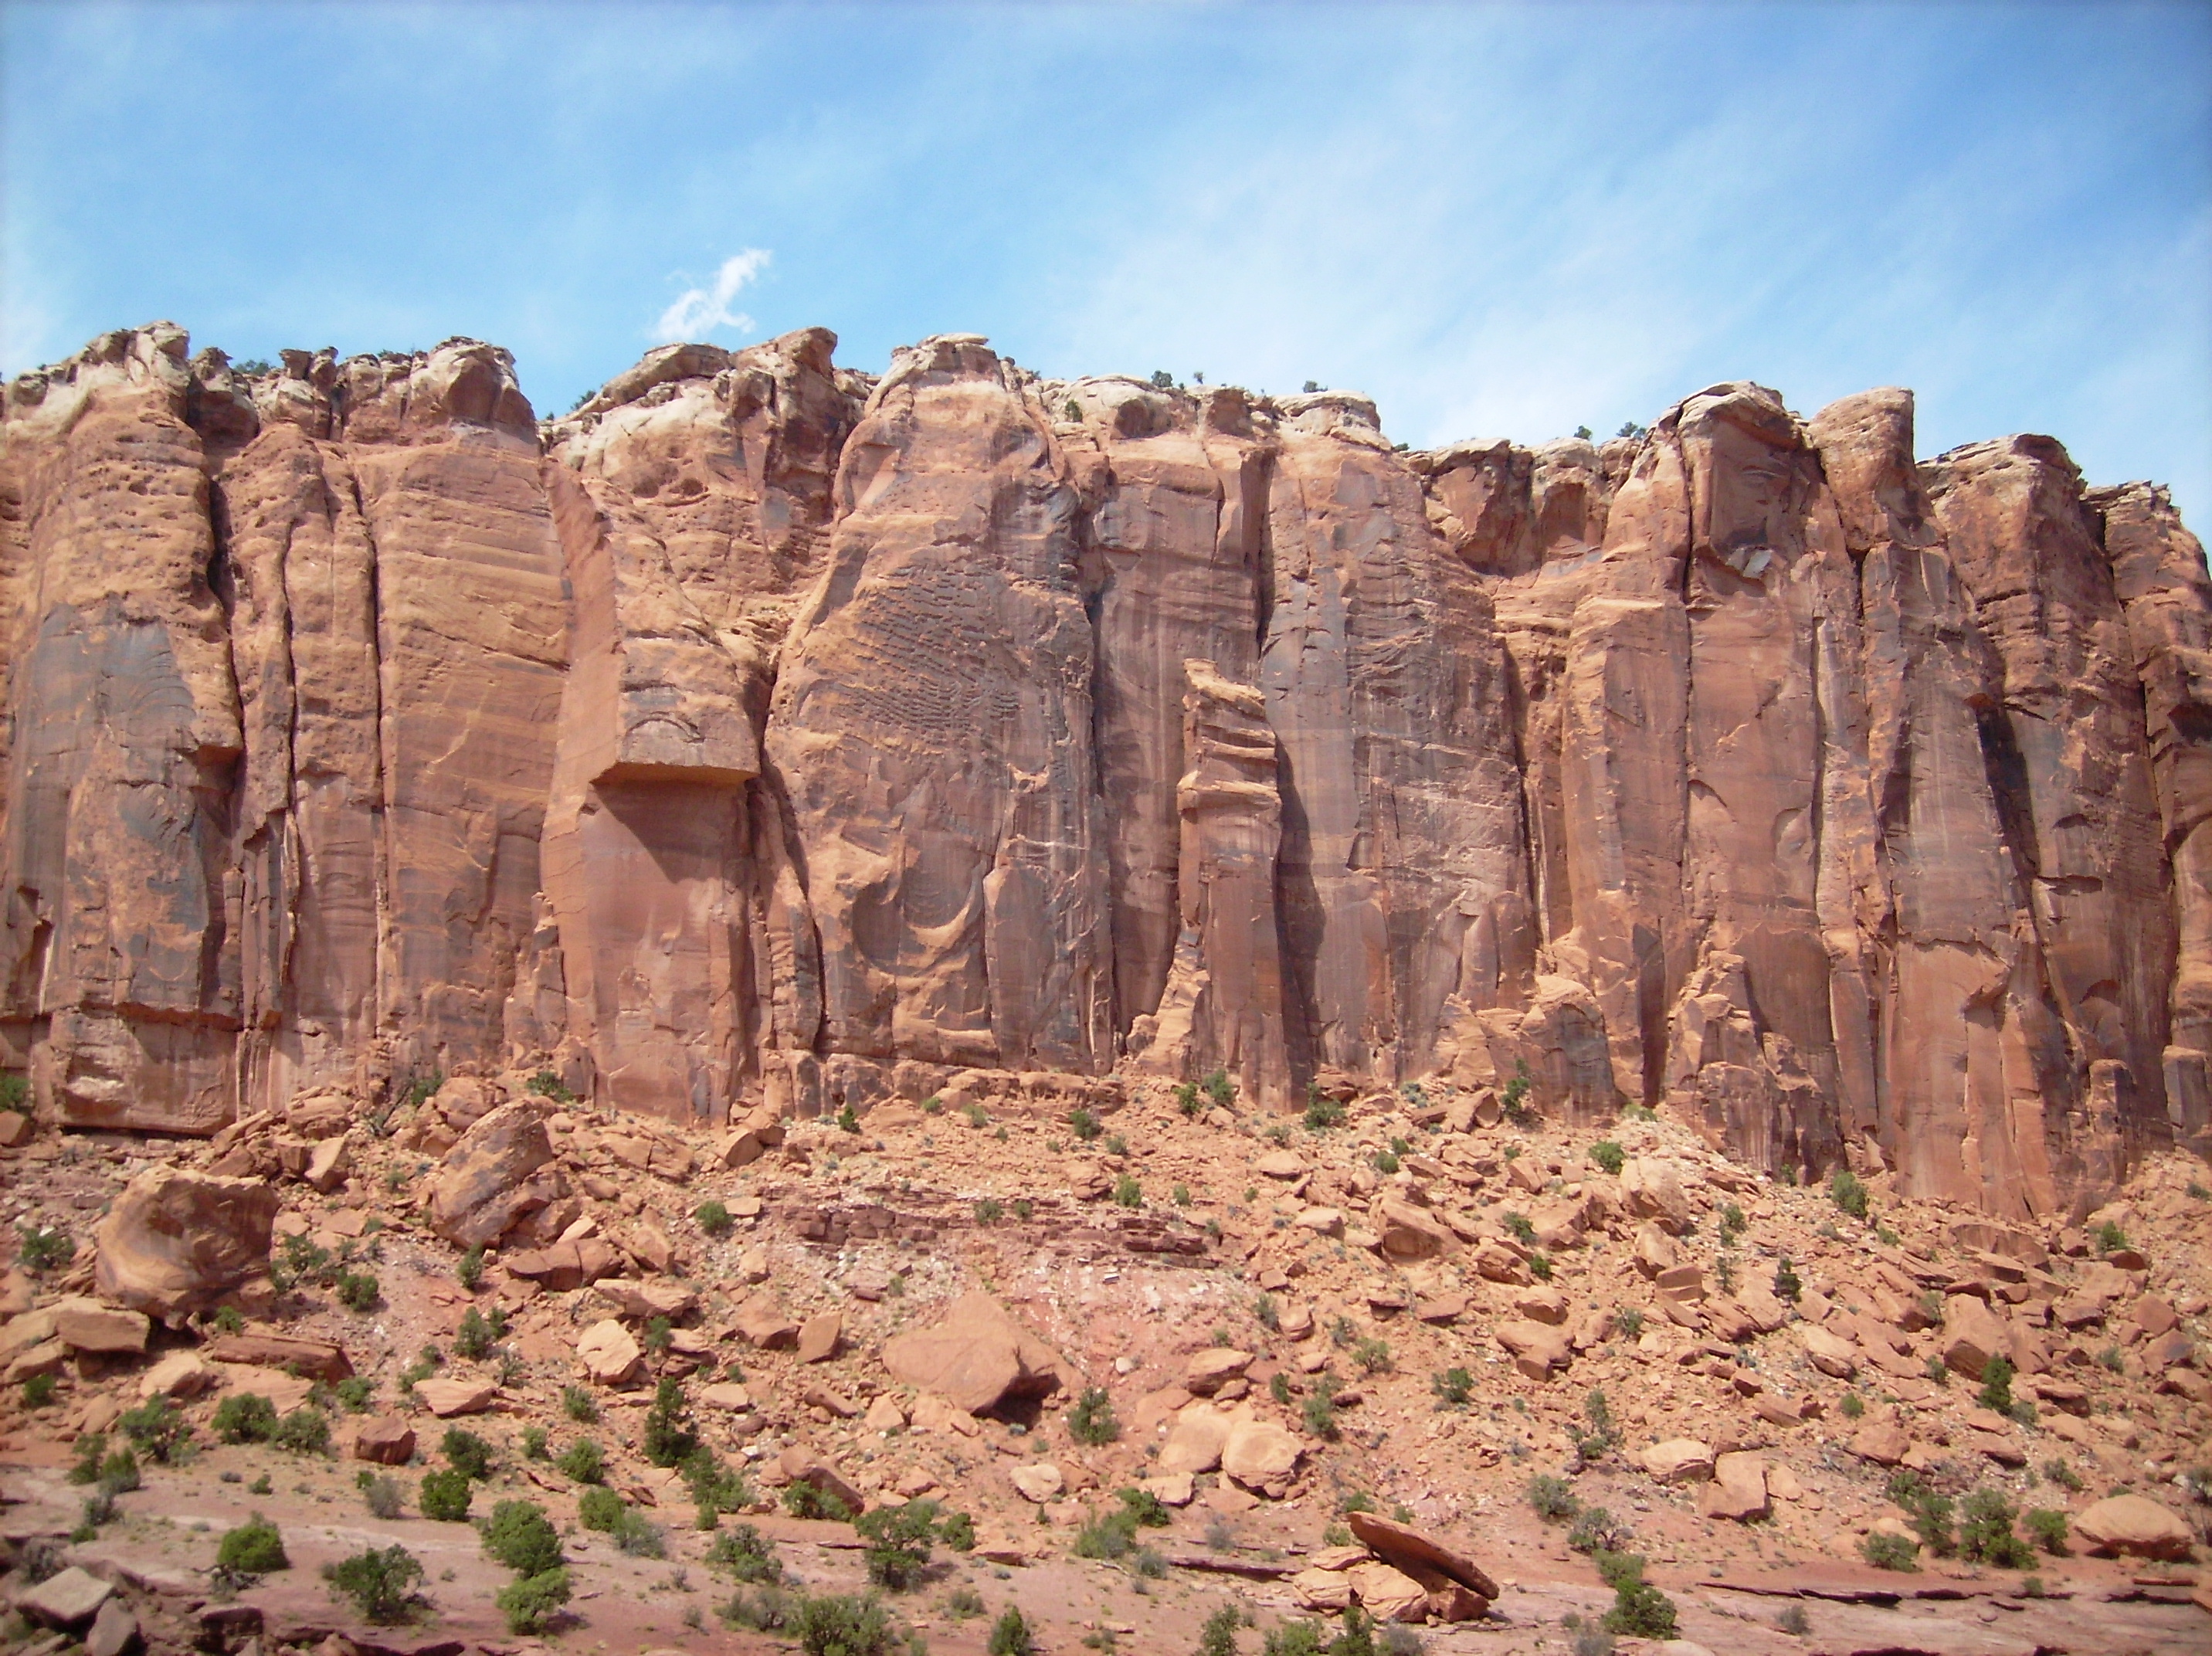
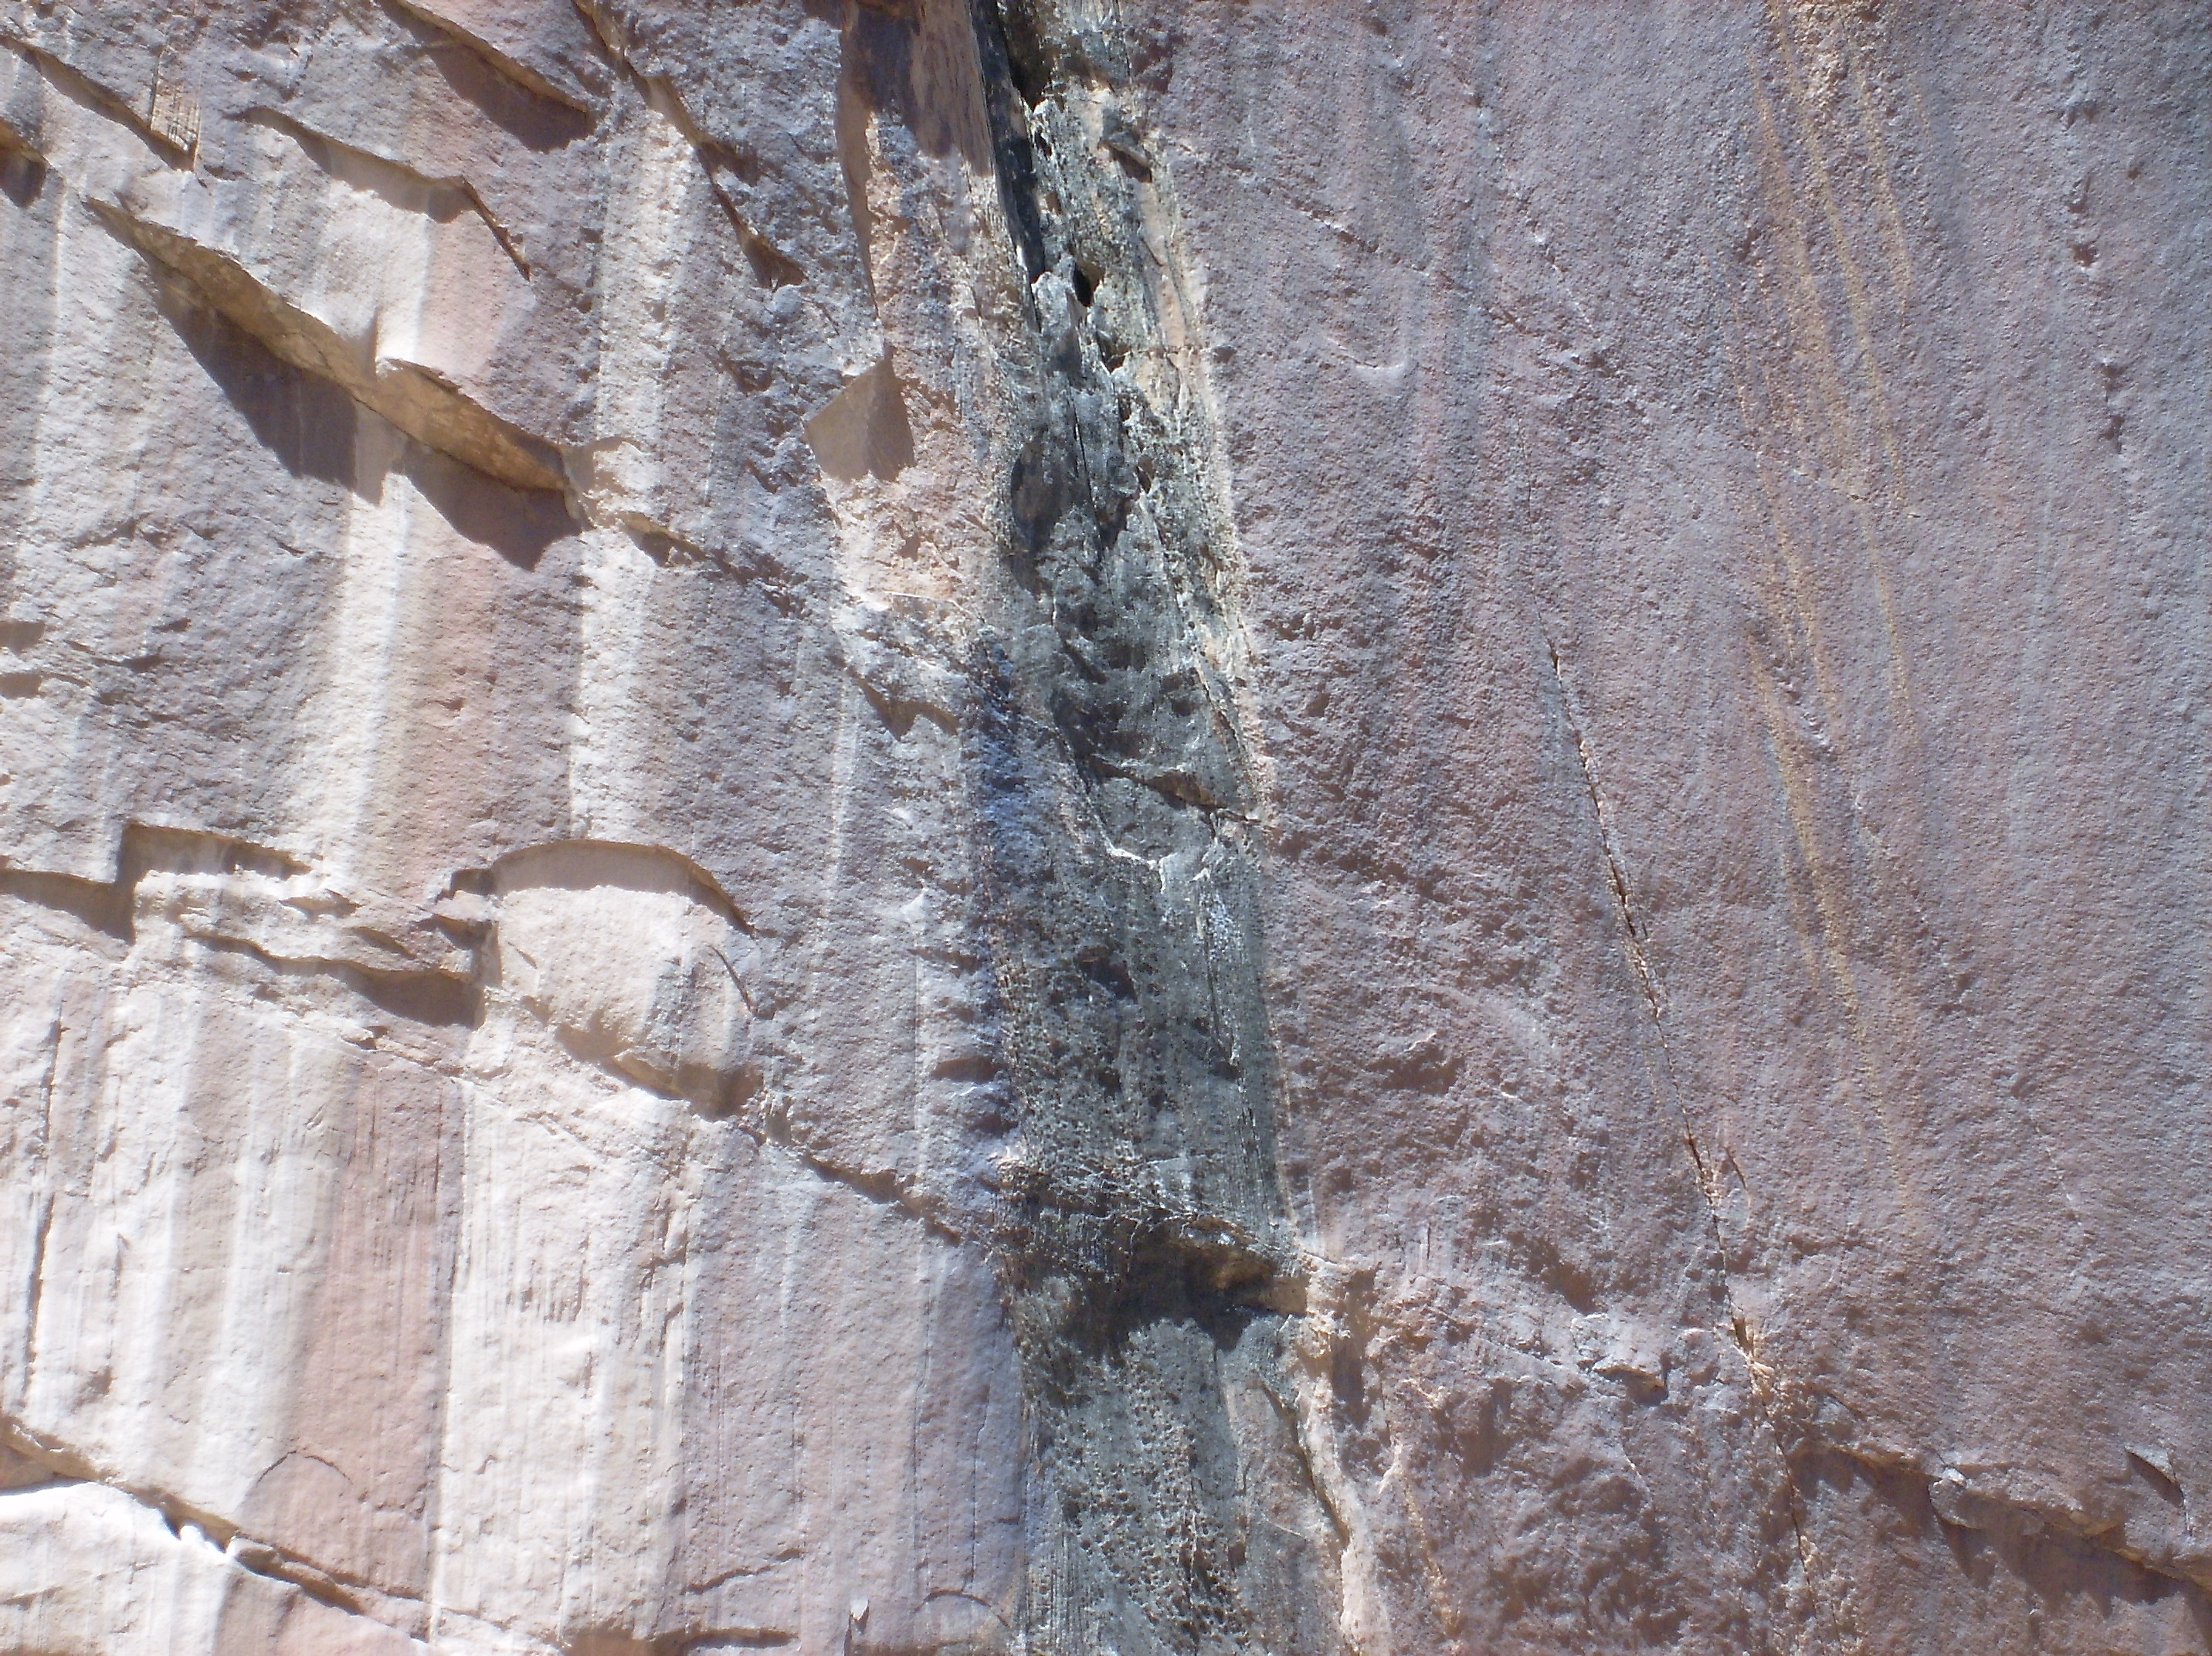
Megalithic structures many believe to be prediluvian tell a tale of a different environment. If one examines their extreme construction it becomes evident they were built to withstand plasma storms, and it explains why they are found with remnant magnetism, lightning scars and vitrification.
Ancient myths do not say a comet hit the Earth, or anything to indicate an impact. They say storms raged, the Earth erupted with water, dragons set fire to the land, Leviathan circled the Earth and Vimana flew in the sky. Many strange and complex visions were witnessed involving angels, demons and gods. They were in the skies and inside the Earth itself, as the mythologies say, because the entire planet’s circuitry was heating-up.
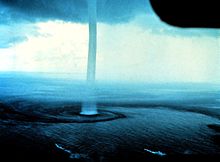
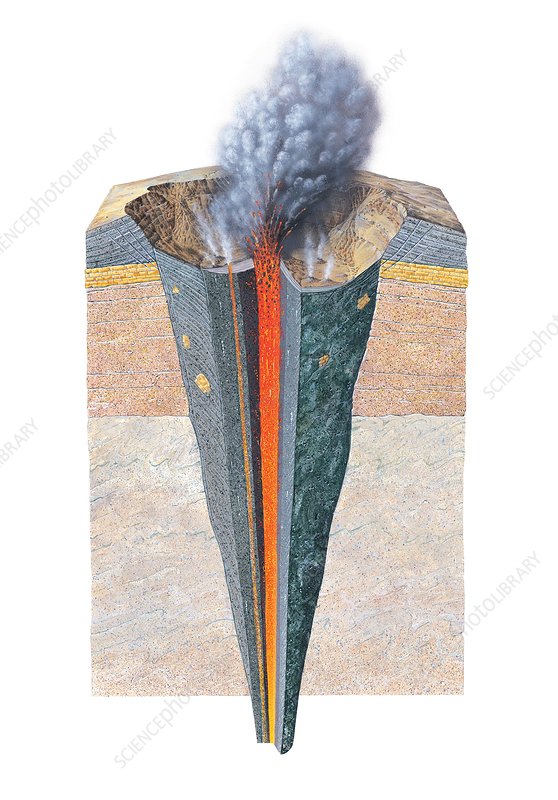
An impact would be hard not to notice. I think they would have made a note of that somehow on a petroglyph. They were witnessing plasma storms. Plasma storms shook the Earth and erupted the guts out of it by raising it’s internal potential, while cyclones formed at the feet of giant columns of auroral light. The visions they saw are what is recorded in myths, glyphs, columns and statues.
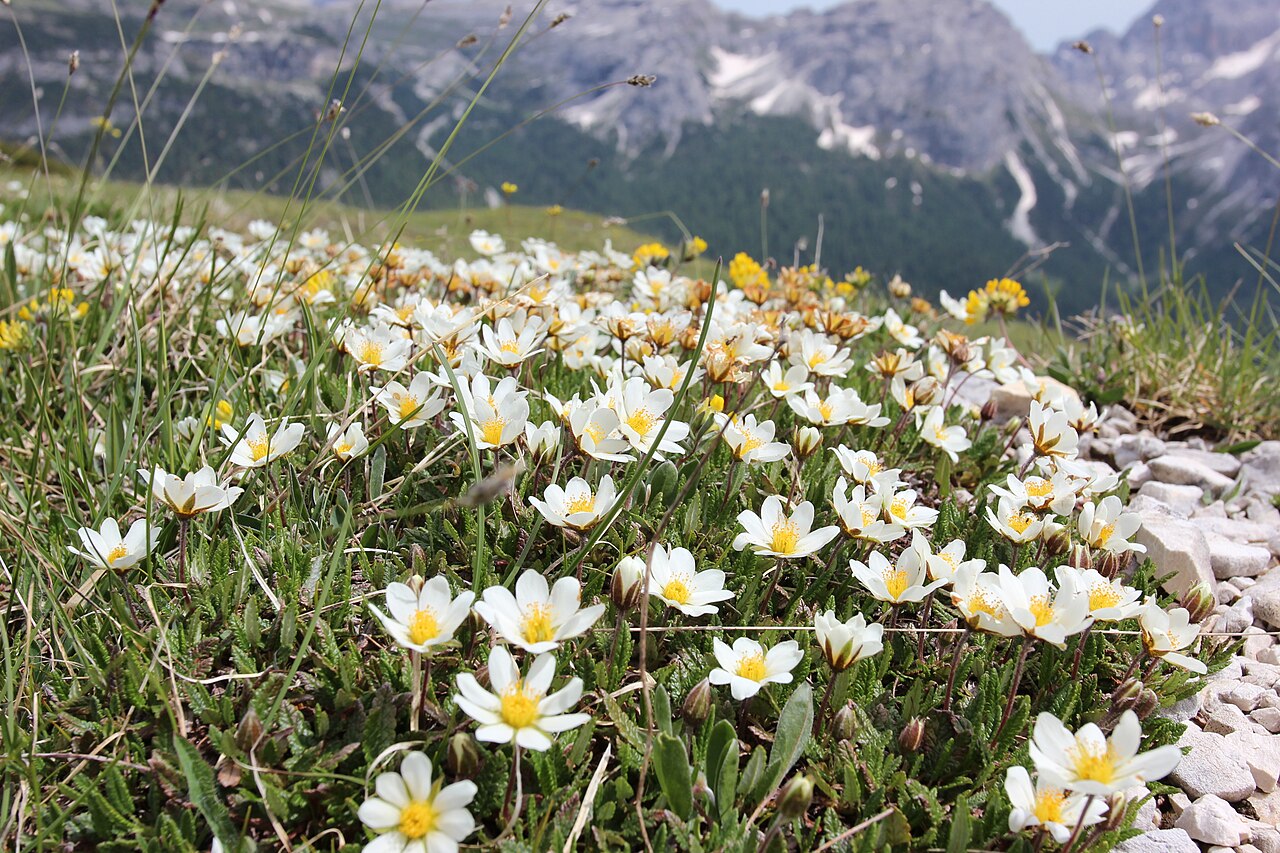
According to several dating methods, many petroglyphs were created around 12,000 years ago. That was the period of the “Younger Dryas“. Roughly a thousand-year period when the climate of half the Earth suddenly cooled, allowing the arctic flower, Dryas Octopetala to thrive everywhere. It also caused mass extinction of megafauna that could not adapt to the changing conditions.
Though climate scientists have tried to blame Mammoth farts, there is no evidence greenhouse gases were the cause, which has left the scientific community flummoxed. The Younger-Dryas is a mystery. It may have been a comet, the Sun flaring, cosmic rays from a supernova, or some event we haven’t imagined. It could have been Earth’s escape from Kronos, the ancient first Sun. Whatever it was, it happened very suddenly, flash freezing animals as they grazed, then burying them in mud. The period is marked by a mat of charred matter across the Americas and parts of Eurasia.
Taken in context, petroglyphs are substantial proof that the Younger Dryas was a plasma storm event. As is the geology and the condition of frozen remains of animals caught in the maelstrom. Even mainstream geophysicists like Dr. Robert Schoch have come to this conclusion, as he wrote about in “Forgotten Civilization: The Role of Solar Outbursts in our Past and Future“. Dr. Schoch recognized the significance of Peratt’s work. He suggests an extreme Solar Storm fits the Younger Dryas evidence very well.
Following this event the world changed. Megafauna were nearly wiped-out. The landscape made desolate, raised by fire and flood. Humans who survived the cataclysm did so together in Anatolia, part of the fertile crescent of land between the Tigris and Euphrates rivers. The earliest constructions of an organized society discovered so far, are several Neolithic megaliths dated to the Younger Dryas period.
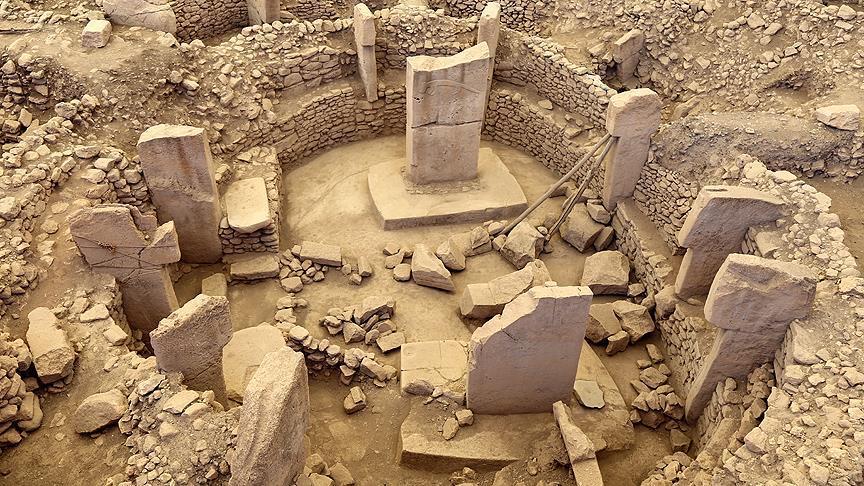
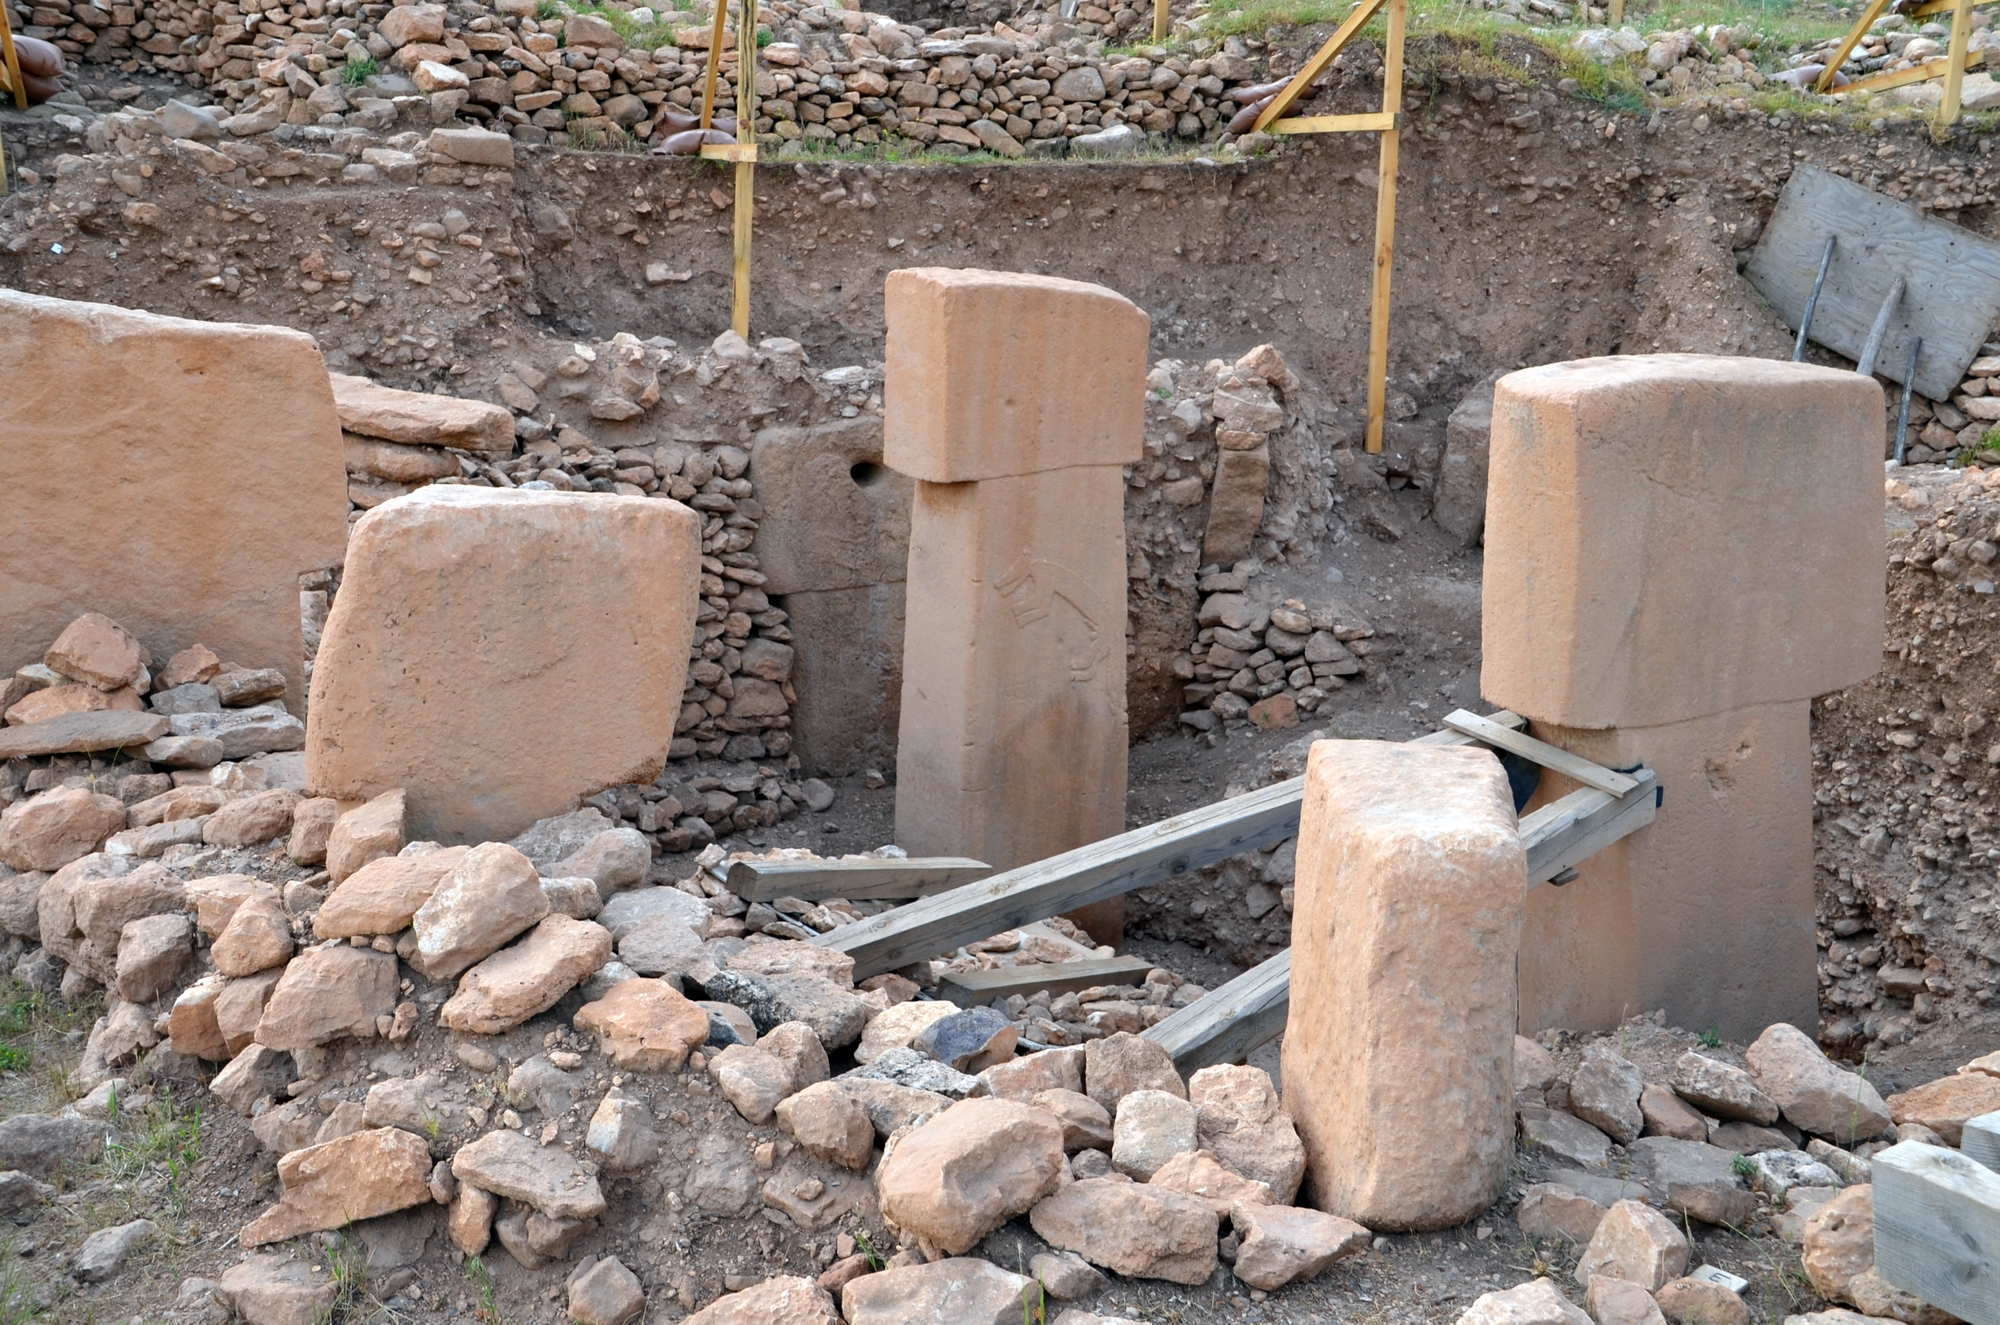
Best known are Gobekli Tepe and Karahan Tepe, in Turkey, which have been dated to 9,700 B.C., at the end of the Younger Dryas. But new sites continue to be uncovered with earlier dates, indicating some of them were occupied during, or even before, the Younger Dryas event. Which brings us to the ReDunk information I hope Dan considers.
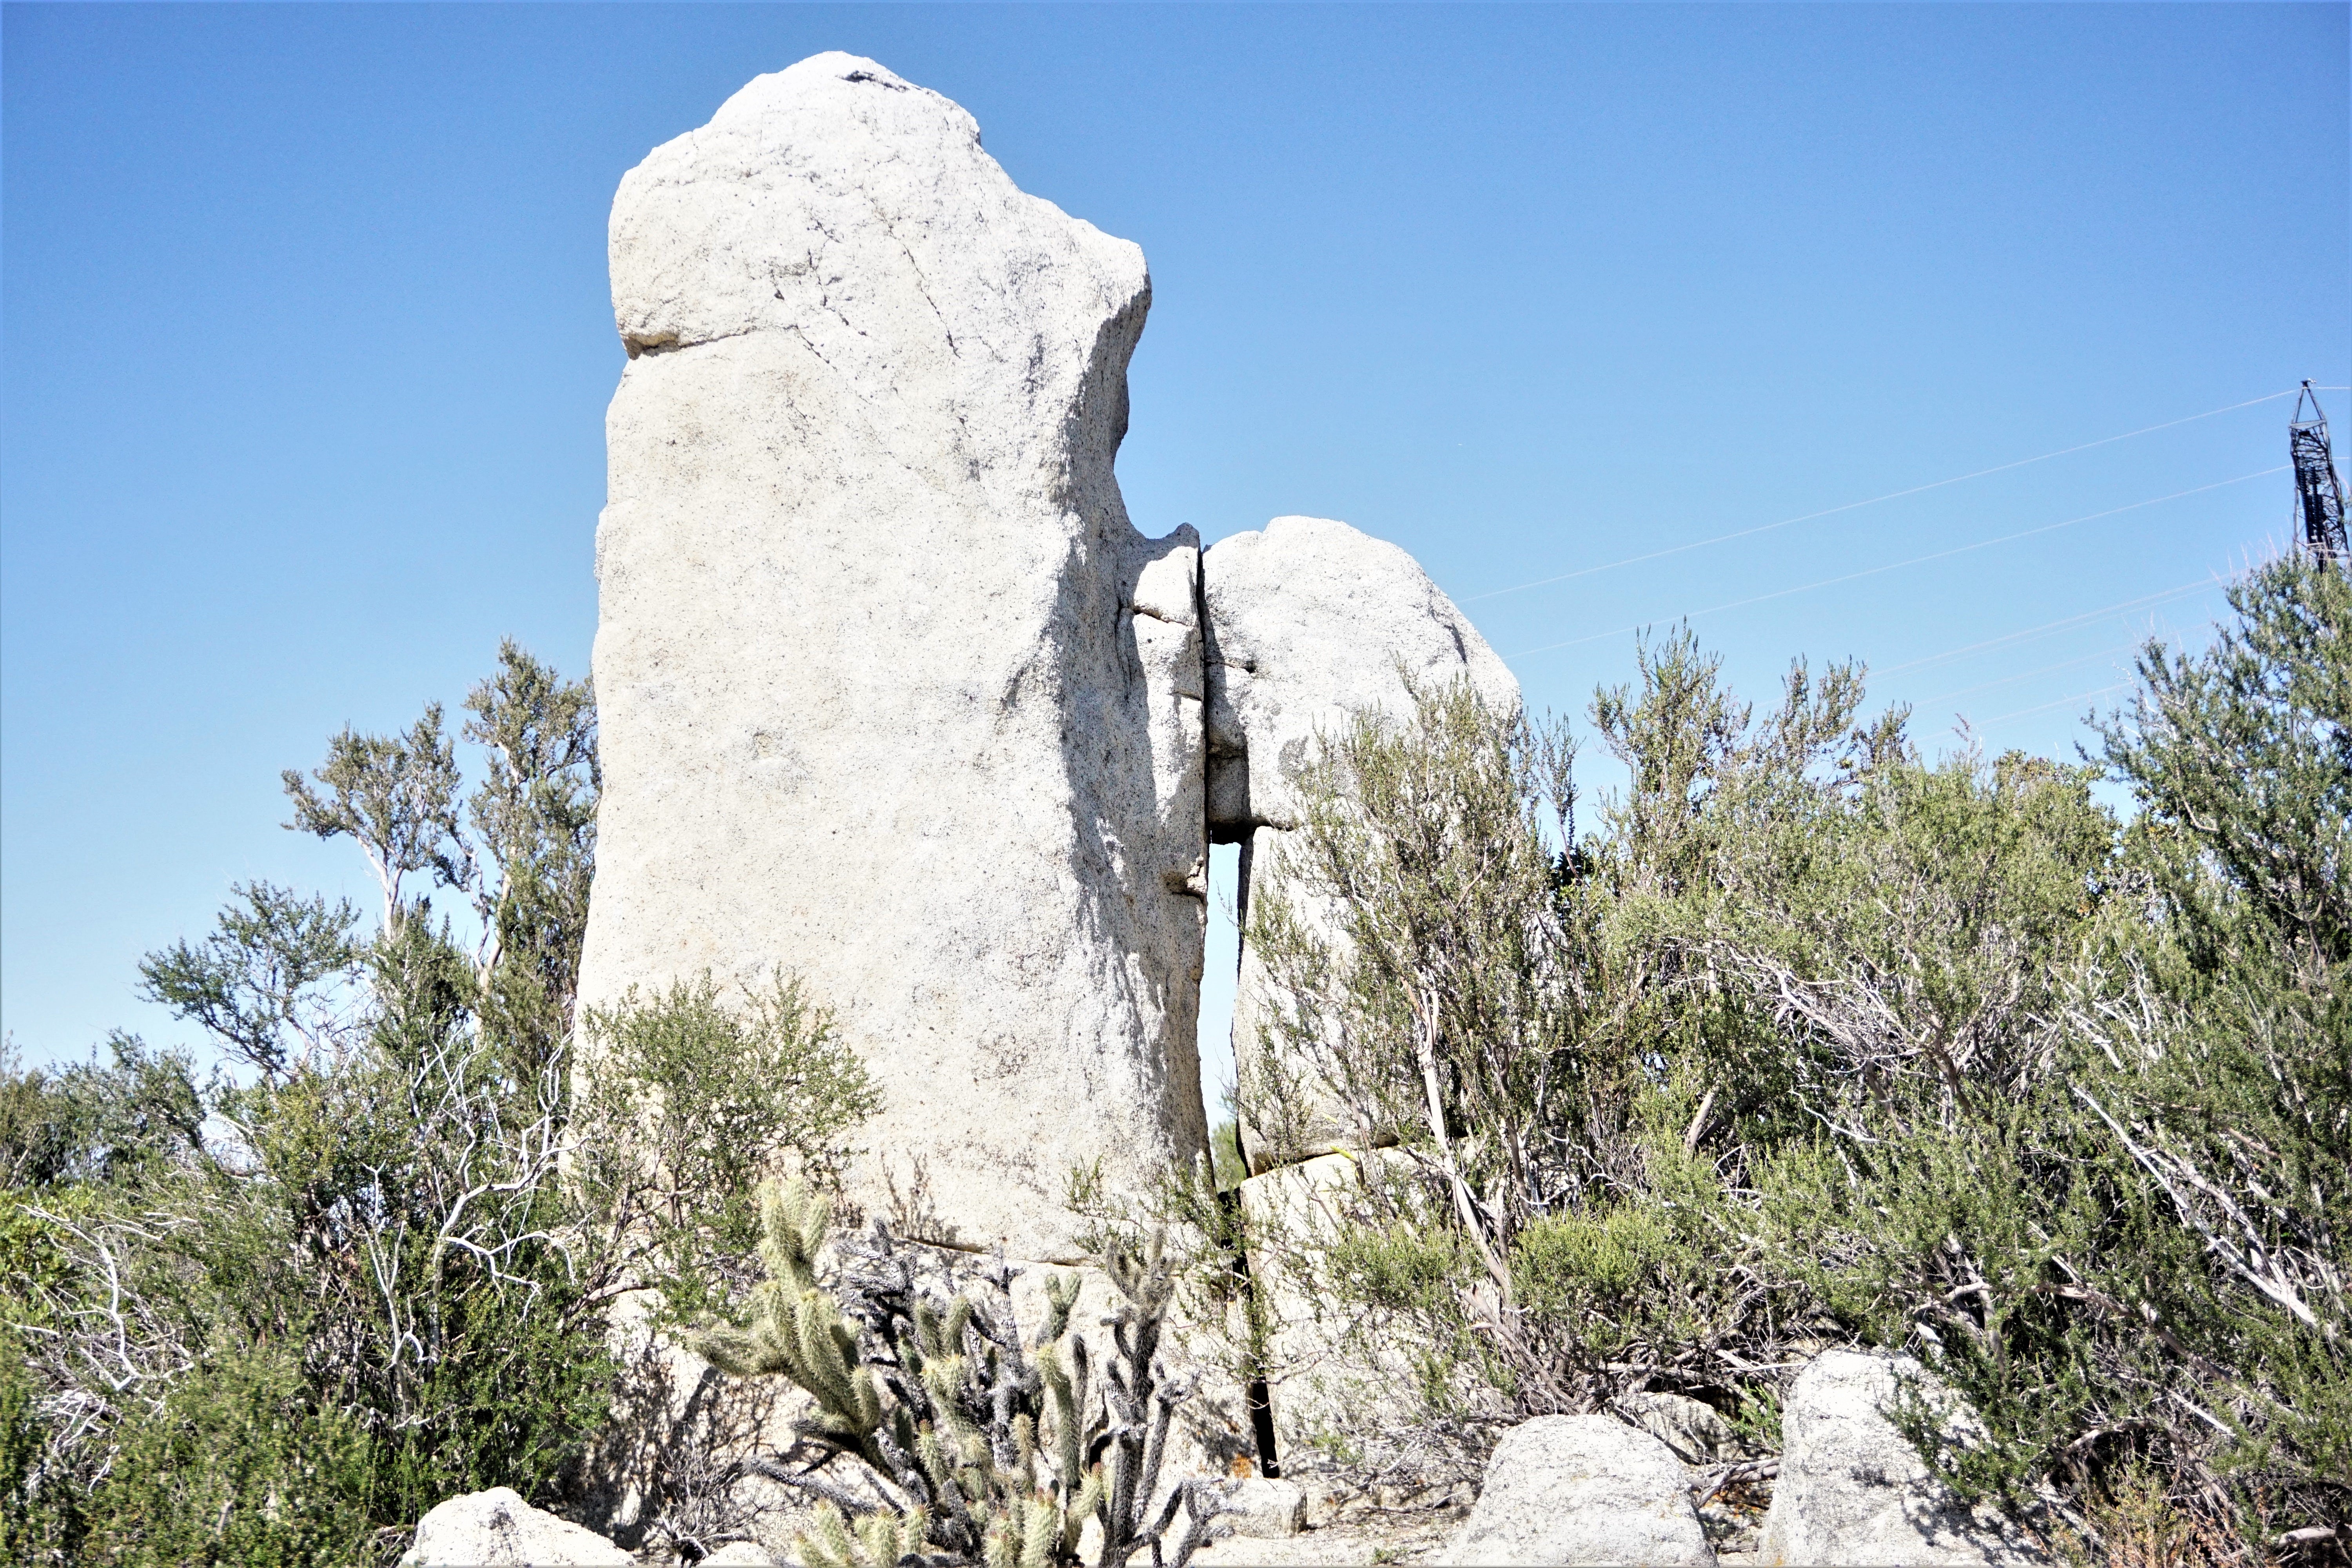
A common feature found at these sites is the “T” pillar. Their meaning is apparently significant, but remains a mystery. There is no discernible structural purpose for the shape. They seem to be more for a spiritual tradition given how some are decorated with carvings, and how they are used in ringed enclosures reminiscent of Ancient Pueblo Kivas of the American Southwest.
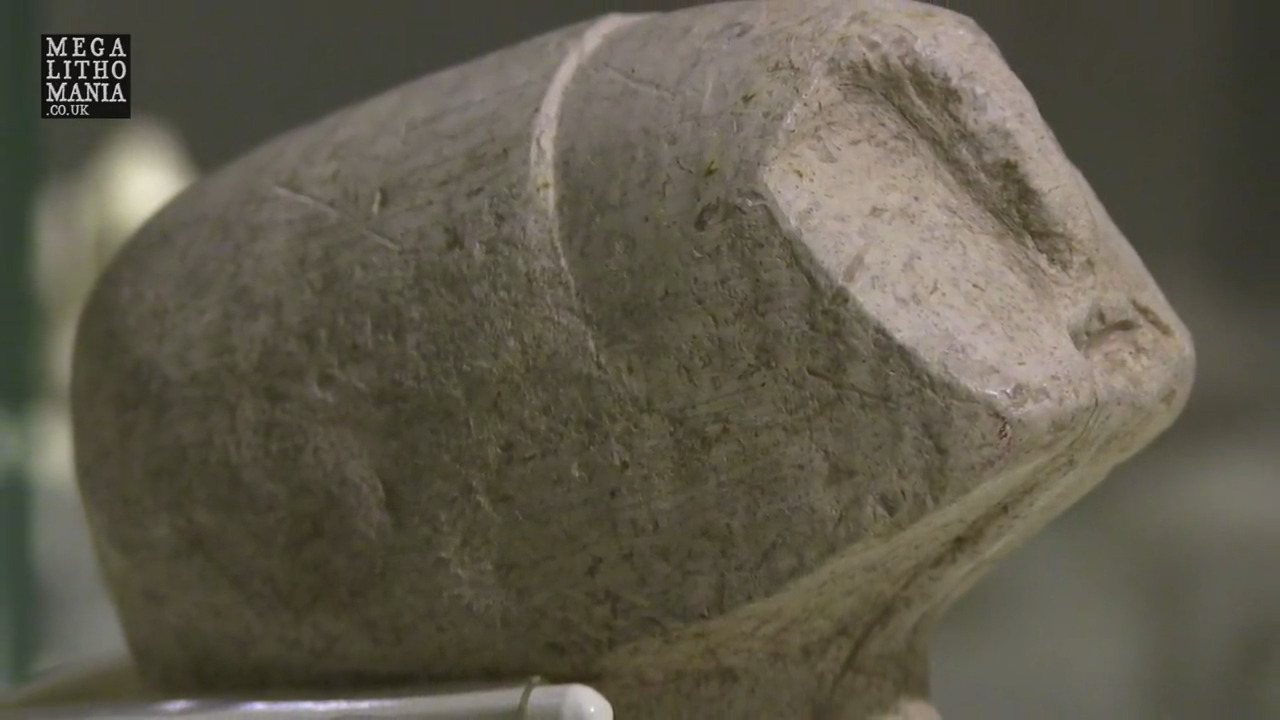
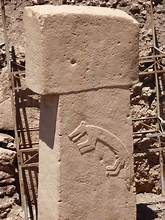
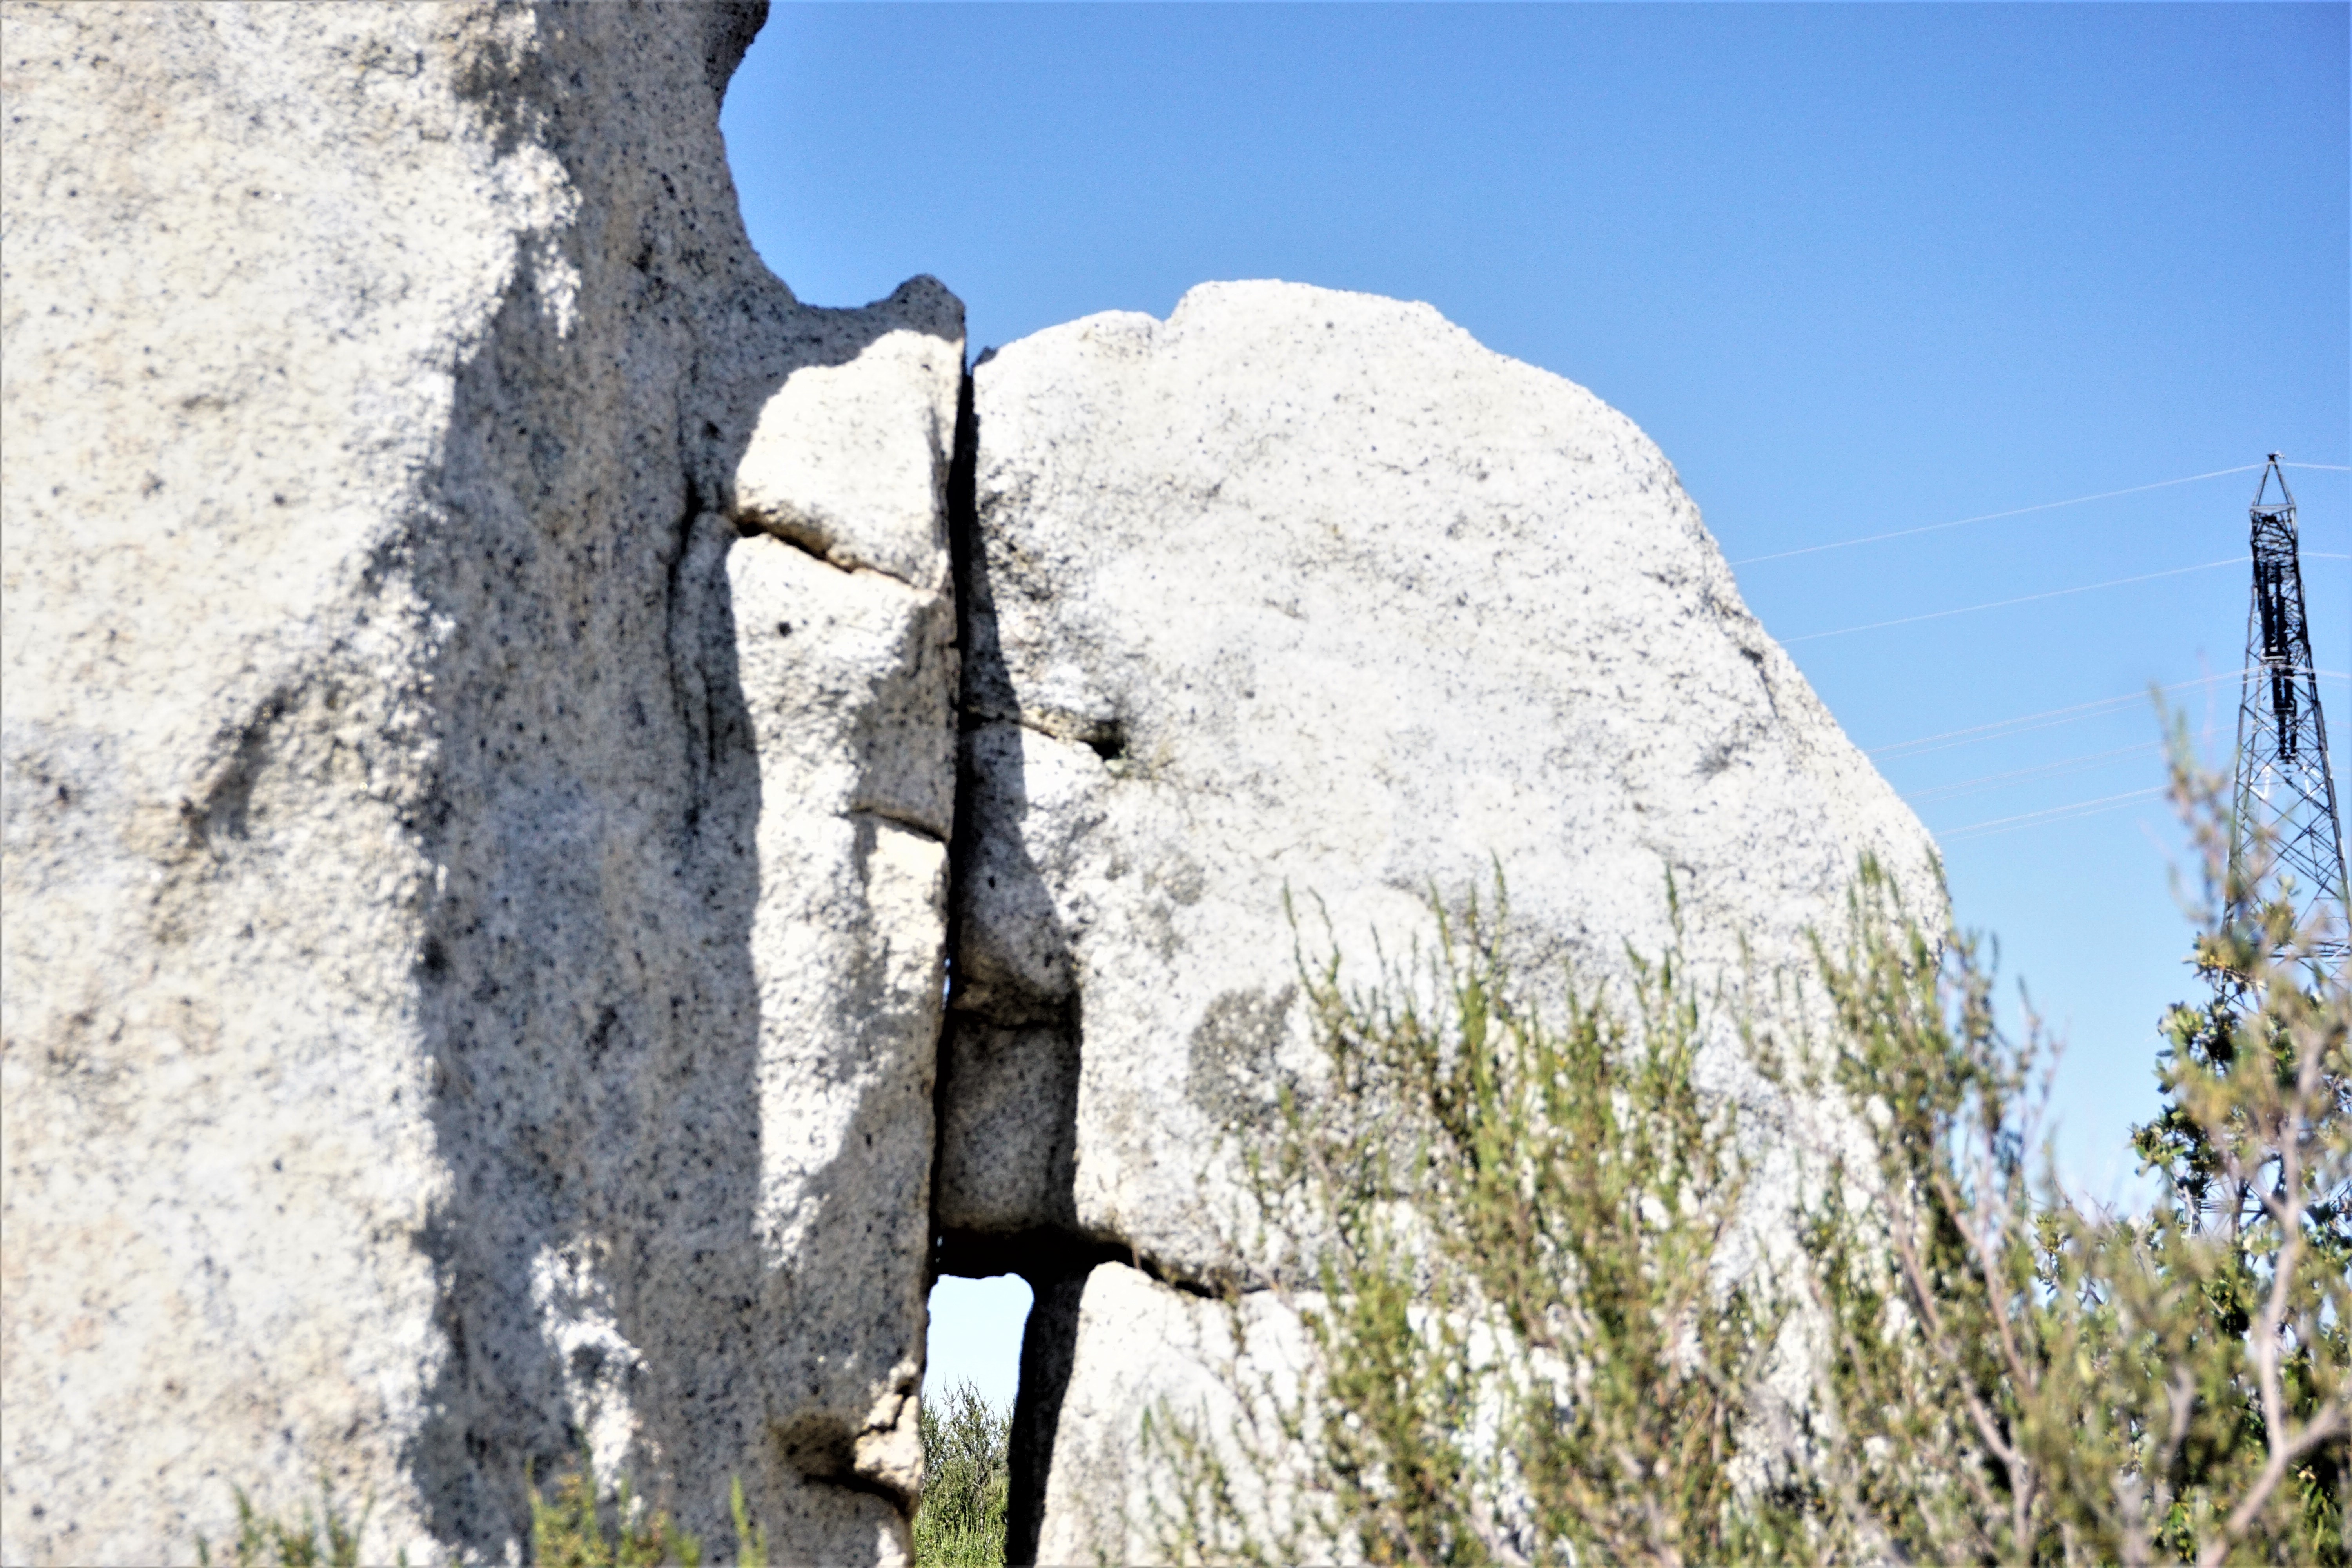
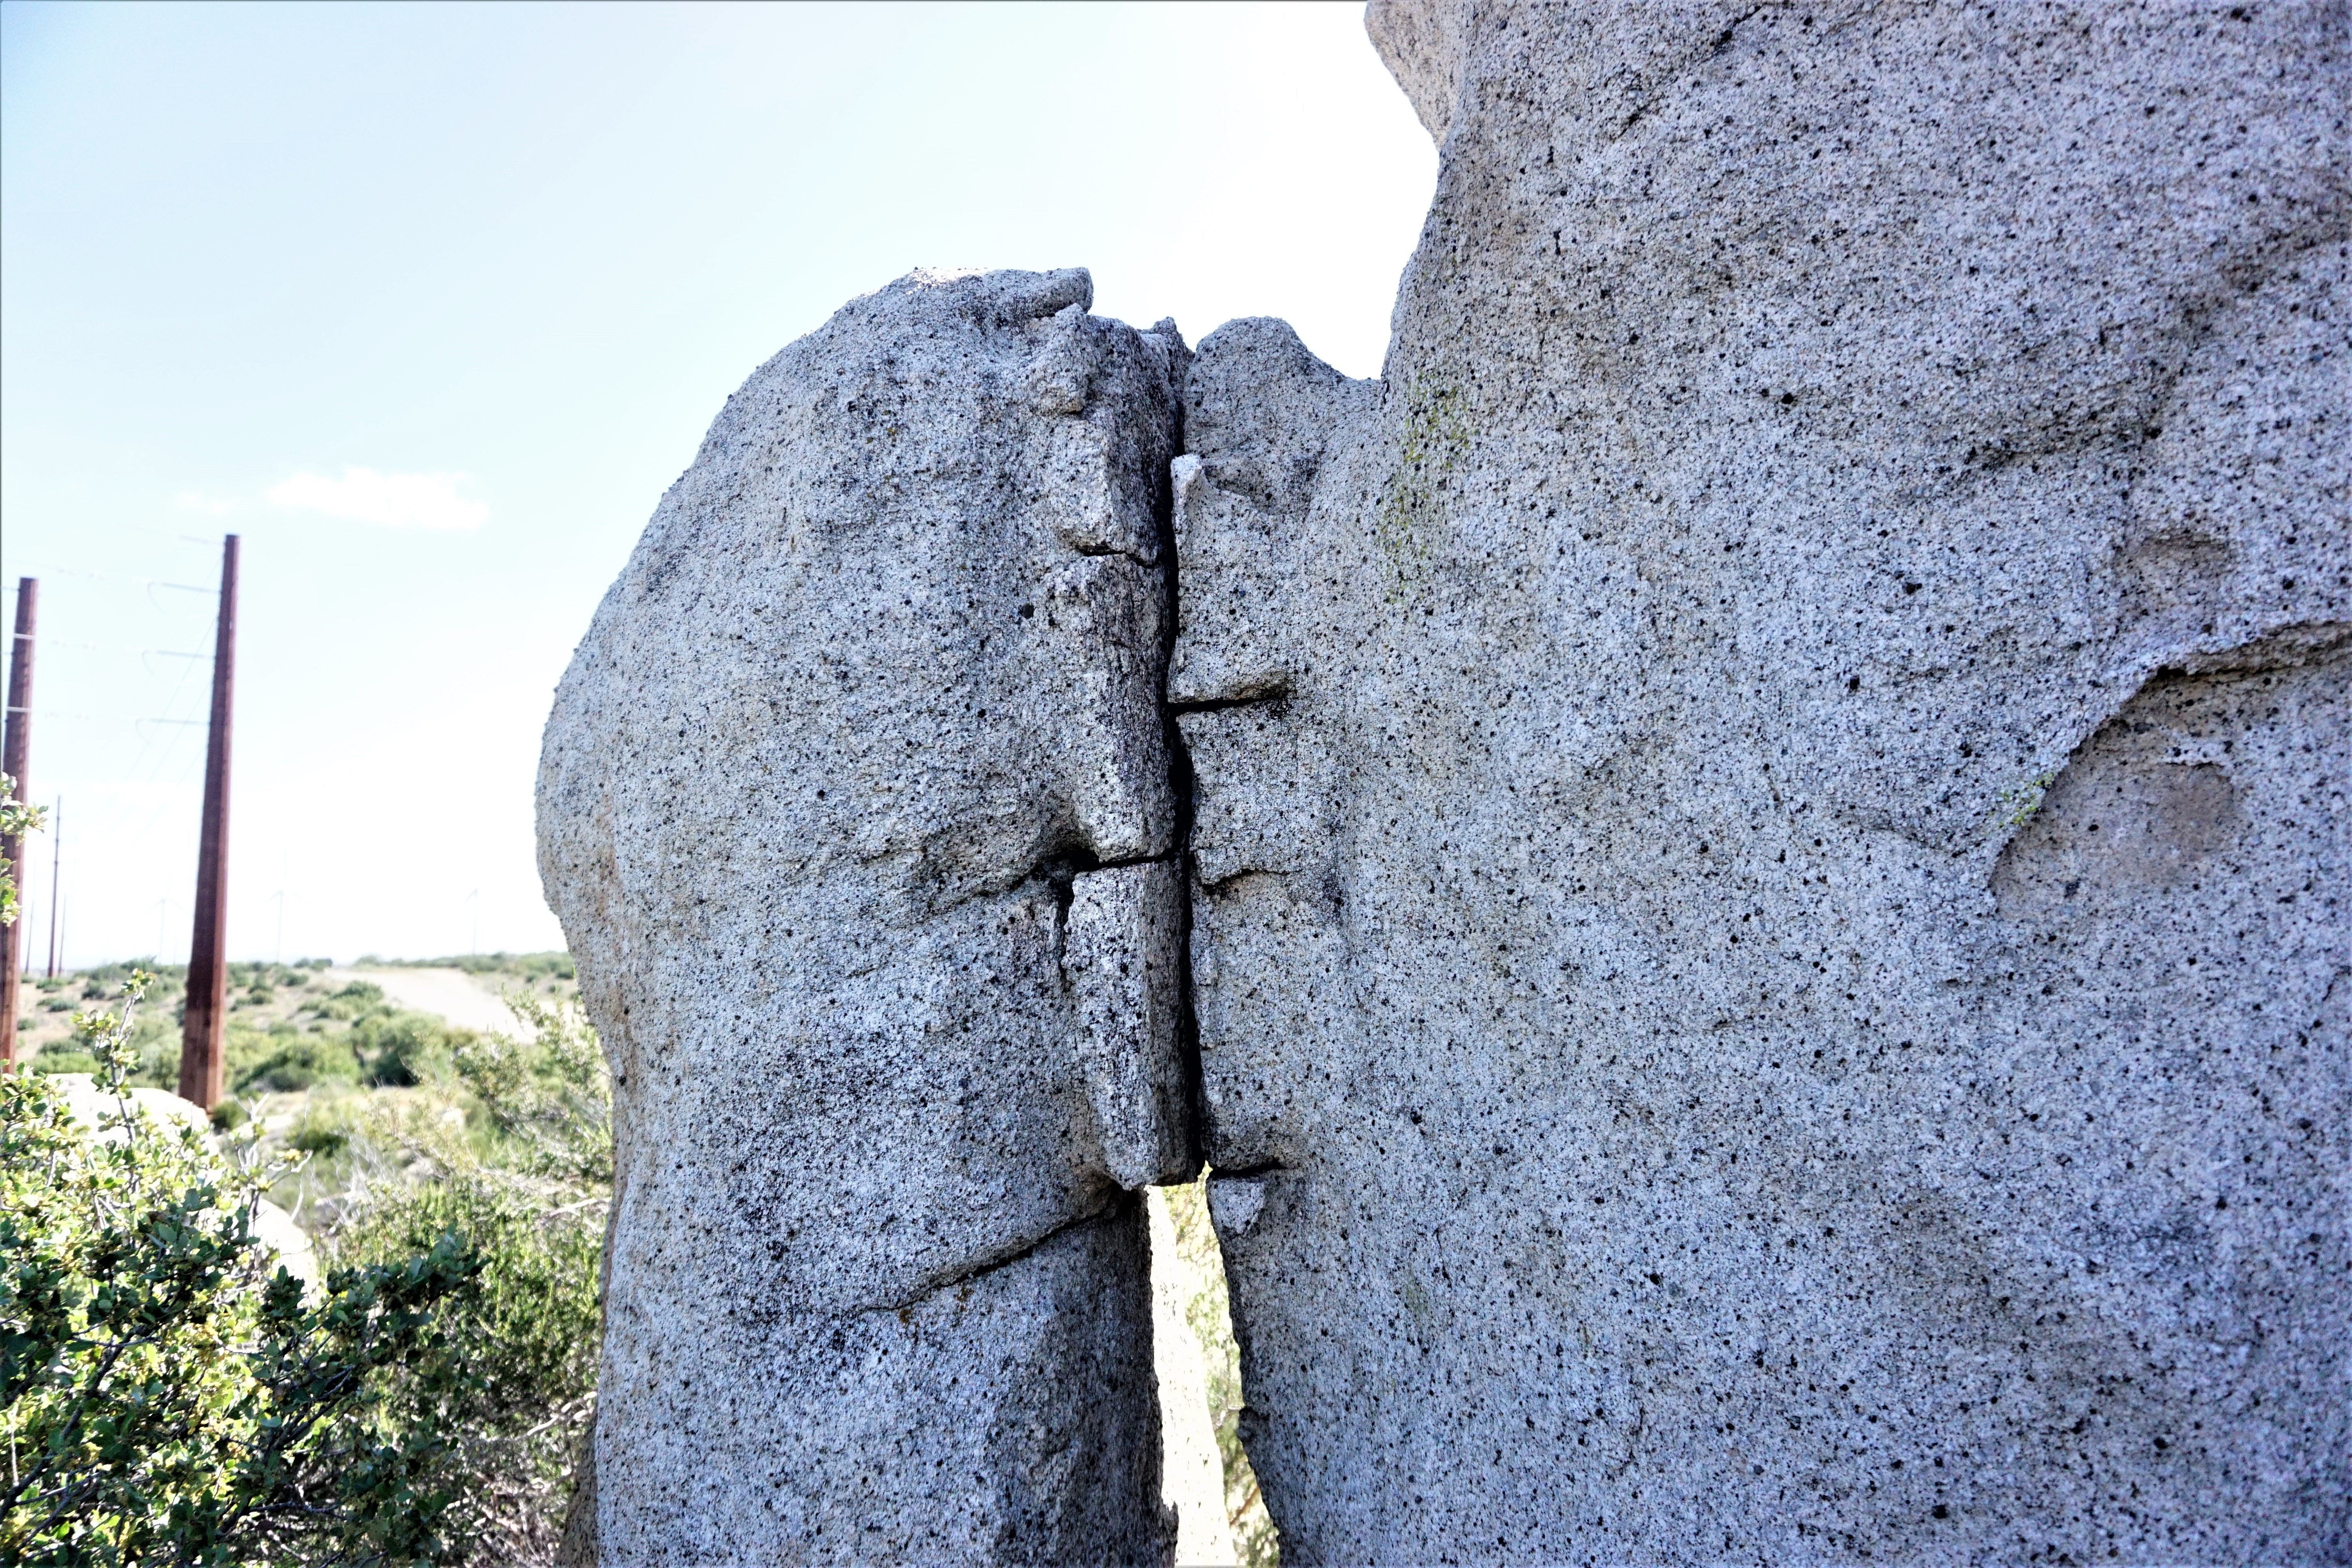
What is unusual about this “T” pillar found with a human face carved into it, is that “T” pillars don’t usually have faces. They do often display arms and hands carved into the pillars, as well as other imagery, but not faces. Also, there are similarly pillar-like stone statues found at these sites with heads similar to this “T” pillar. So, the question is: what does this all mean?

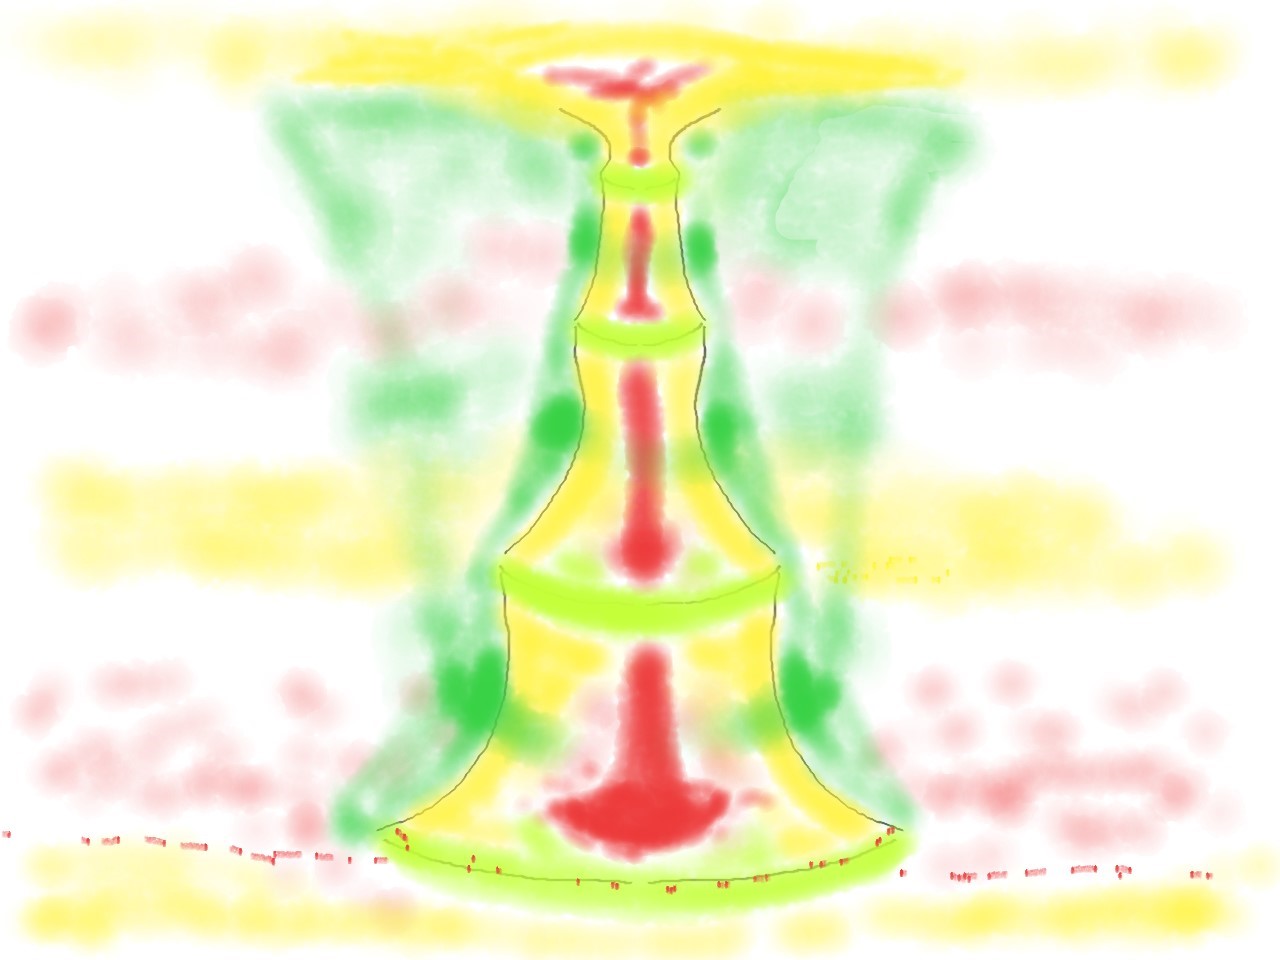
It is my opinion the “T” pillars represent the Earth’s magnetic field lines, fired-up with glow-mode currents. The pillars, like squatterman and other petroglyphs, are a physical record of what was witnessed as a space-storm brewed over the Earth’s poles.
Columnar rays of light, grouped in a ring with two prominent rays in the center. The prominent pillars represent Birkeland currents, delivering energy from an unknown extraterrestrial source. The ring of pillars surrounding them represent magnetic field lines glowing with induction currents, embedded in the encircling walls representing auroral curtains of light.
Note that in the artist’s rendition of Gobekli Tepe in Figure 8, the walls appear as one full ring, surrounded by two partial rings that don’t meet, but overlap. This is how counter-rotating curtains of auroral lights actually appear in the sky. The central pillars, the surrounding pillars and the ring walls are all structured the same as polar aurora.
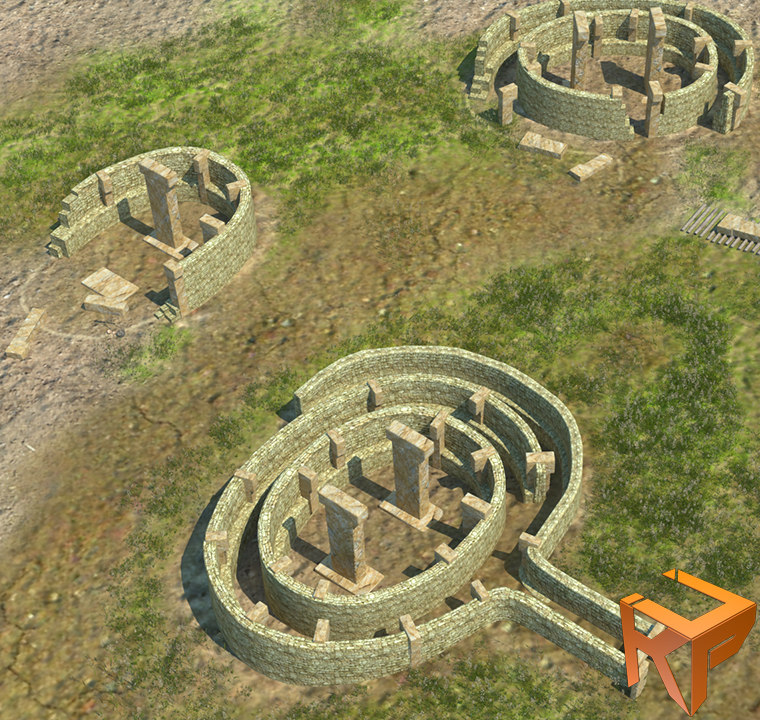
Astro-archaeologists have noted the enclosures appear to have certain solar alignments, which also makes sense if the enclosures represent the Earth’s magnetic field. Specific regions of the sky where images appeared, when they appeared, and how they appeared would correlate with Earth’s orientation with respect to the Sun, Moon and any other external influences on the magnetic field.
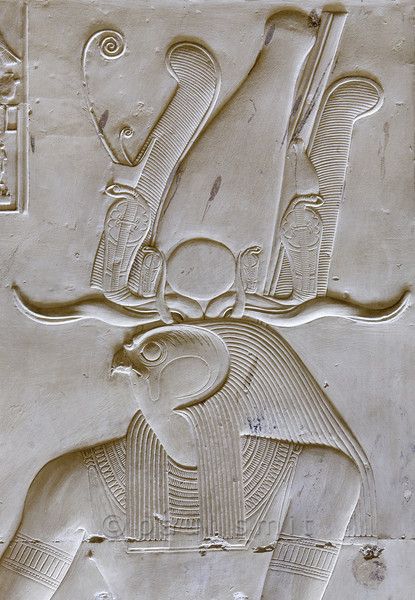
The heads, I believe, were shapes made of light radiating from energized plasma. They were transient effects that made different shapes, some that looked like faces with a little imagination. Sometimes they looked like just a big pair of eyes, bird heads, or fish heads, too.
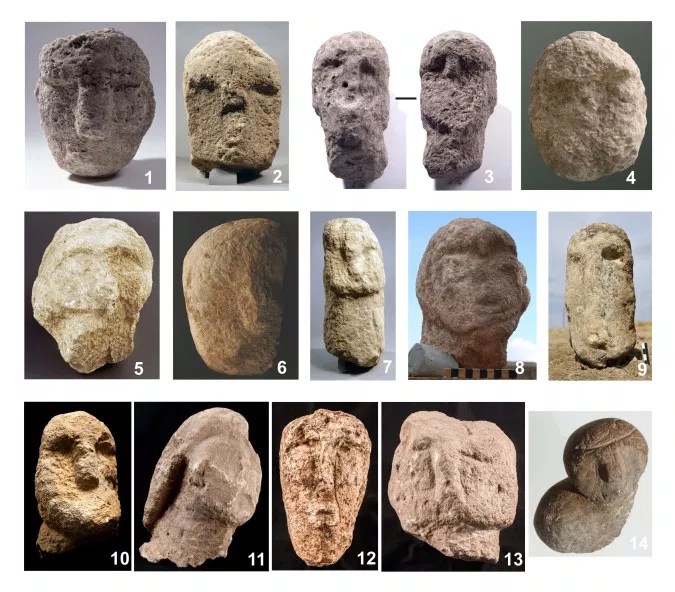
The first pillars were simple “T” structures. The first heads, found at the same sites on pillar-like sculptures, were not much more. A projecting brow and vertical bar that gives an impression of eyes and a nose. There is a consistent design language and it isn’t very human-like. A long bar-like nose, hollow eyes and no mouth, or just the hint of one, lantern jaw and sometimes a skull cap, hair, or helmet feature.
It’s more like the template for a face, like the stylized, vacant-eyed statuary department stores use to display clothing. Nothing is there to distinguish them as individual human beings. And since these are the earliest sculptures, they are likely the most true to what was actually witnessed. It was enough for fear and shock to stimulate the imagination into believing they were Gods supervising Earth’s destruction.

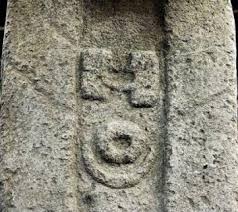
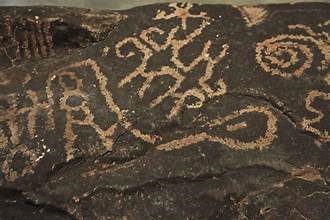
The most compelling evidence the “T” pillar represents plasma aurora aren’t the heads, but the iconography on the pillars. For one thing, some of it matches petroglyphs, proving the link with plasma discharge. But the main evidence this depicts plasma discharge is their match with excited hydrogen.

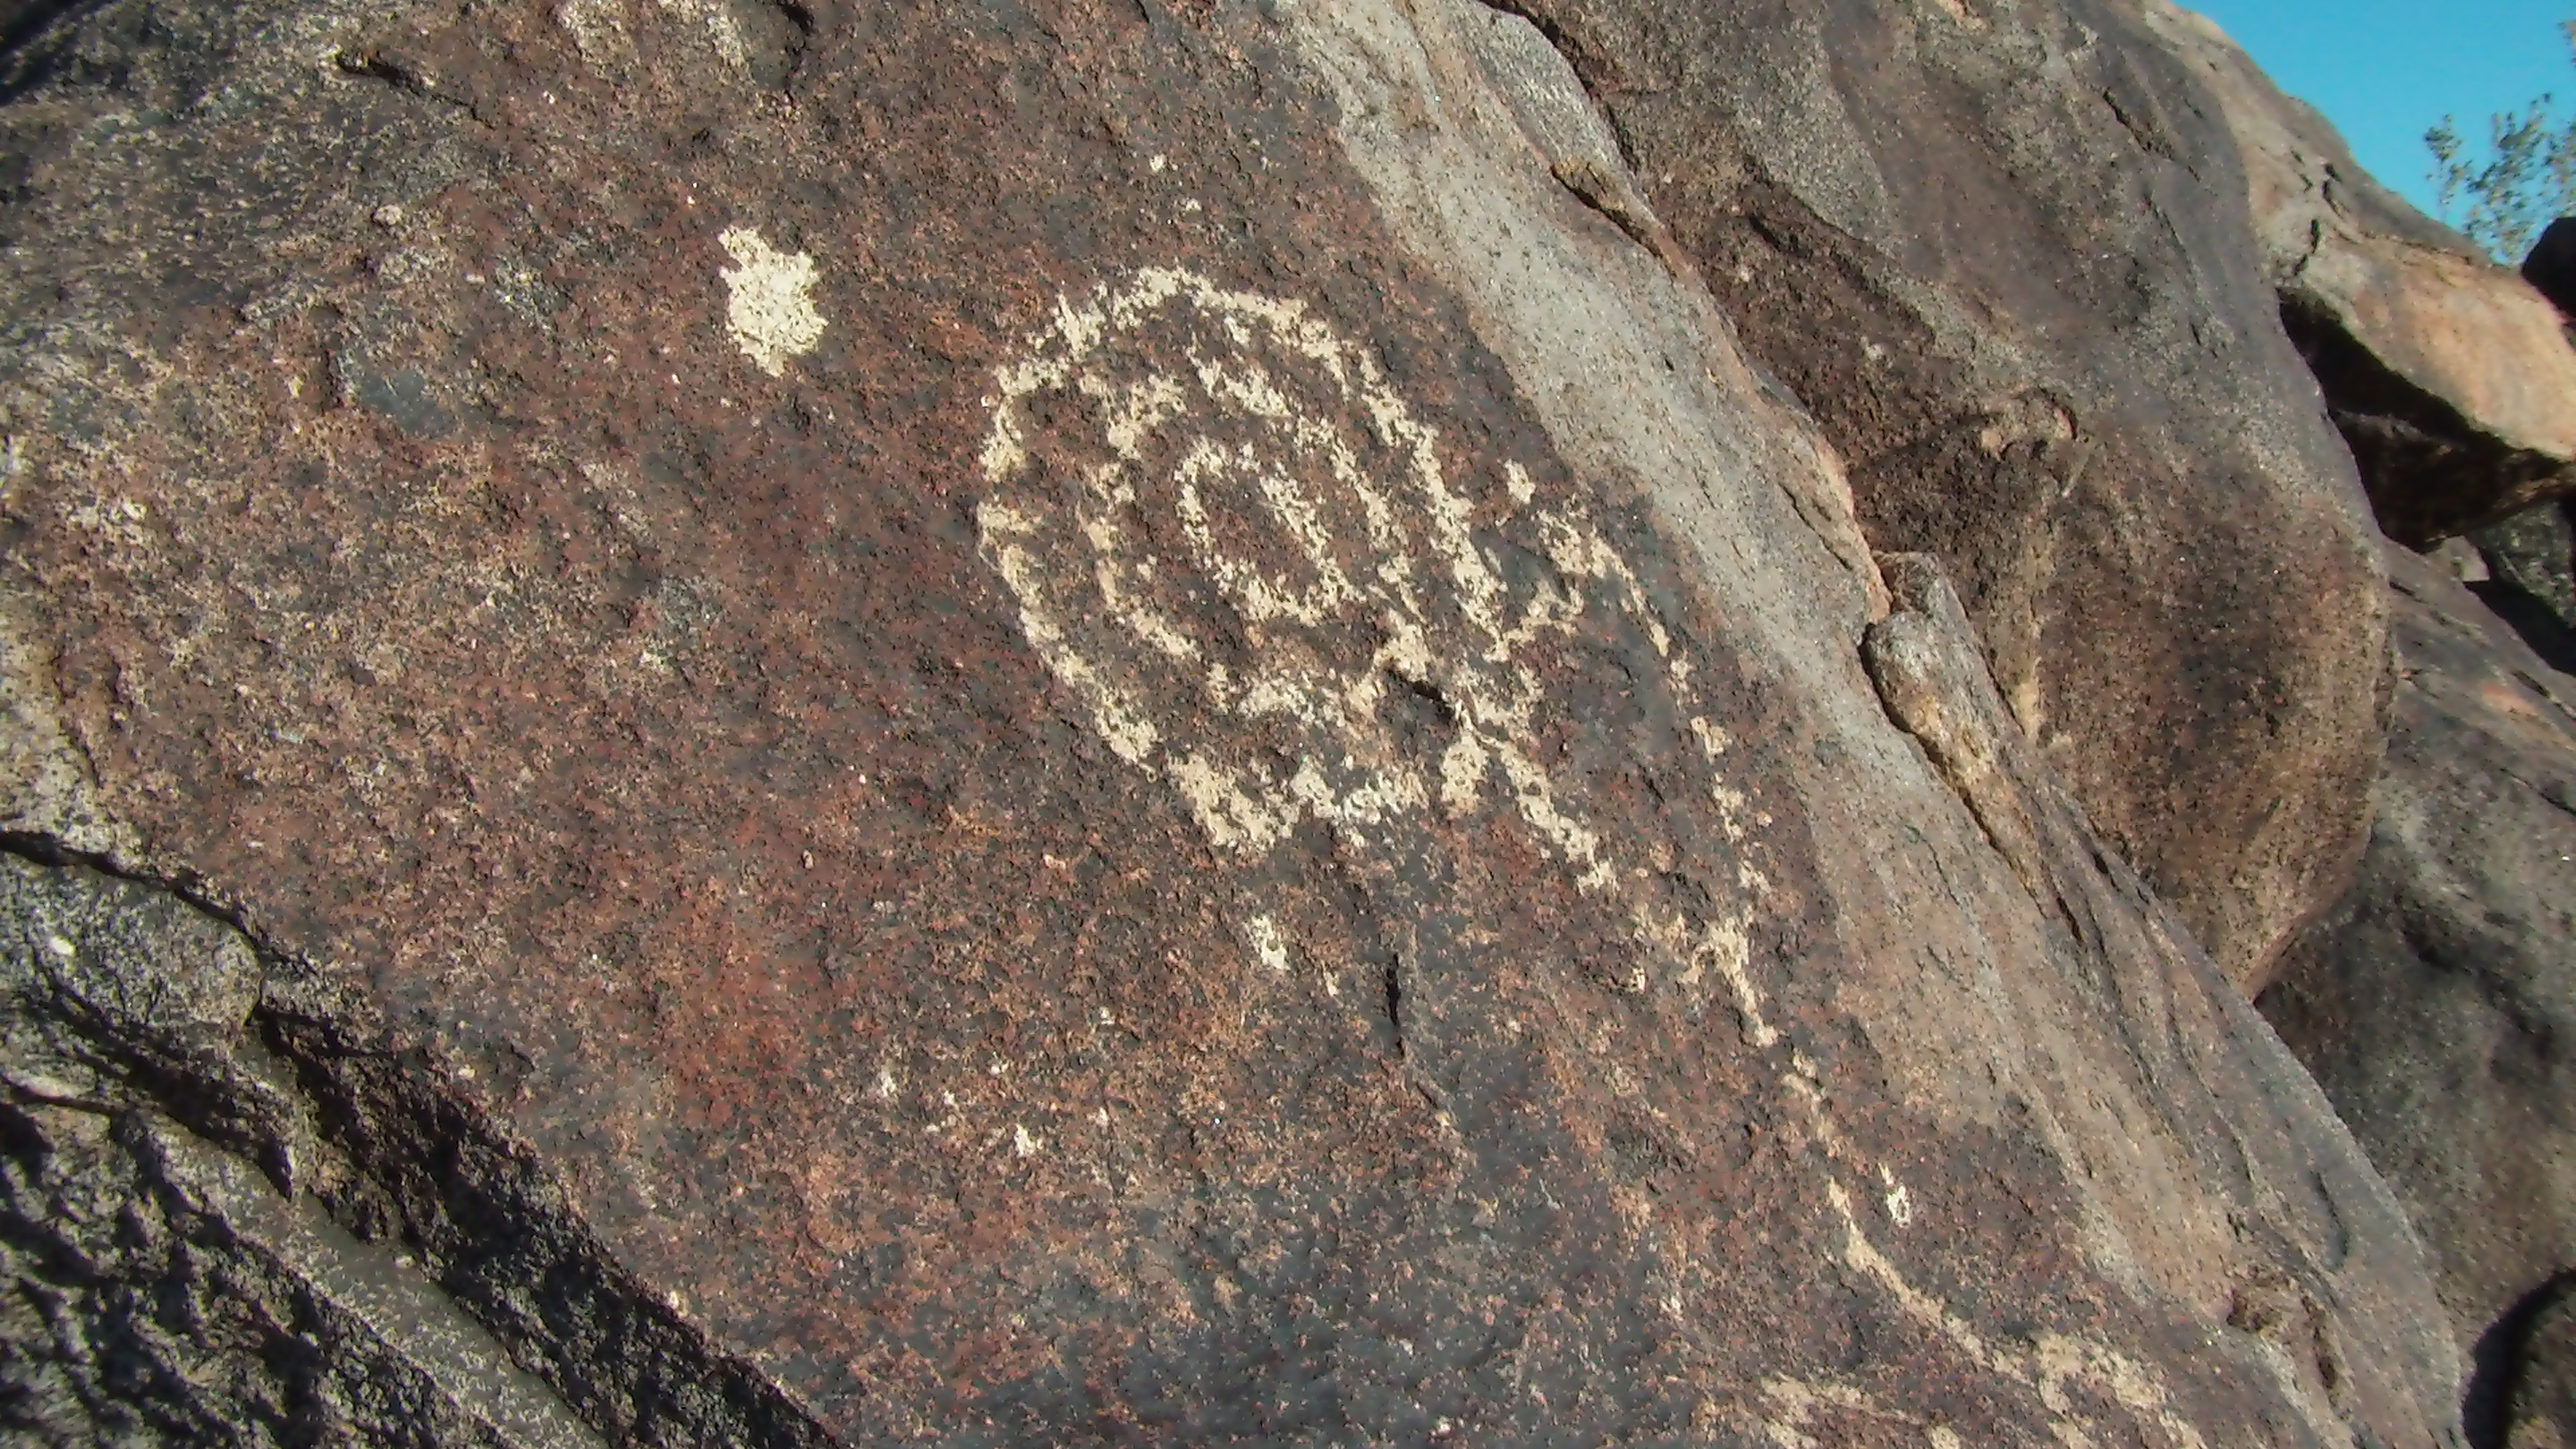
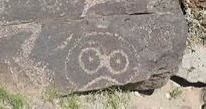
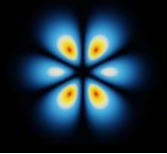
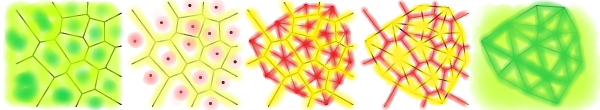
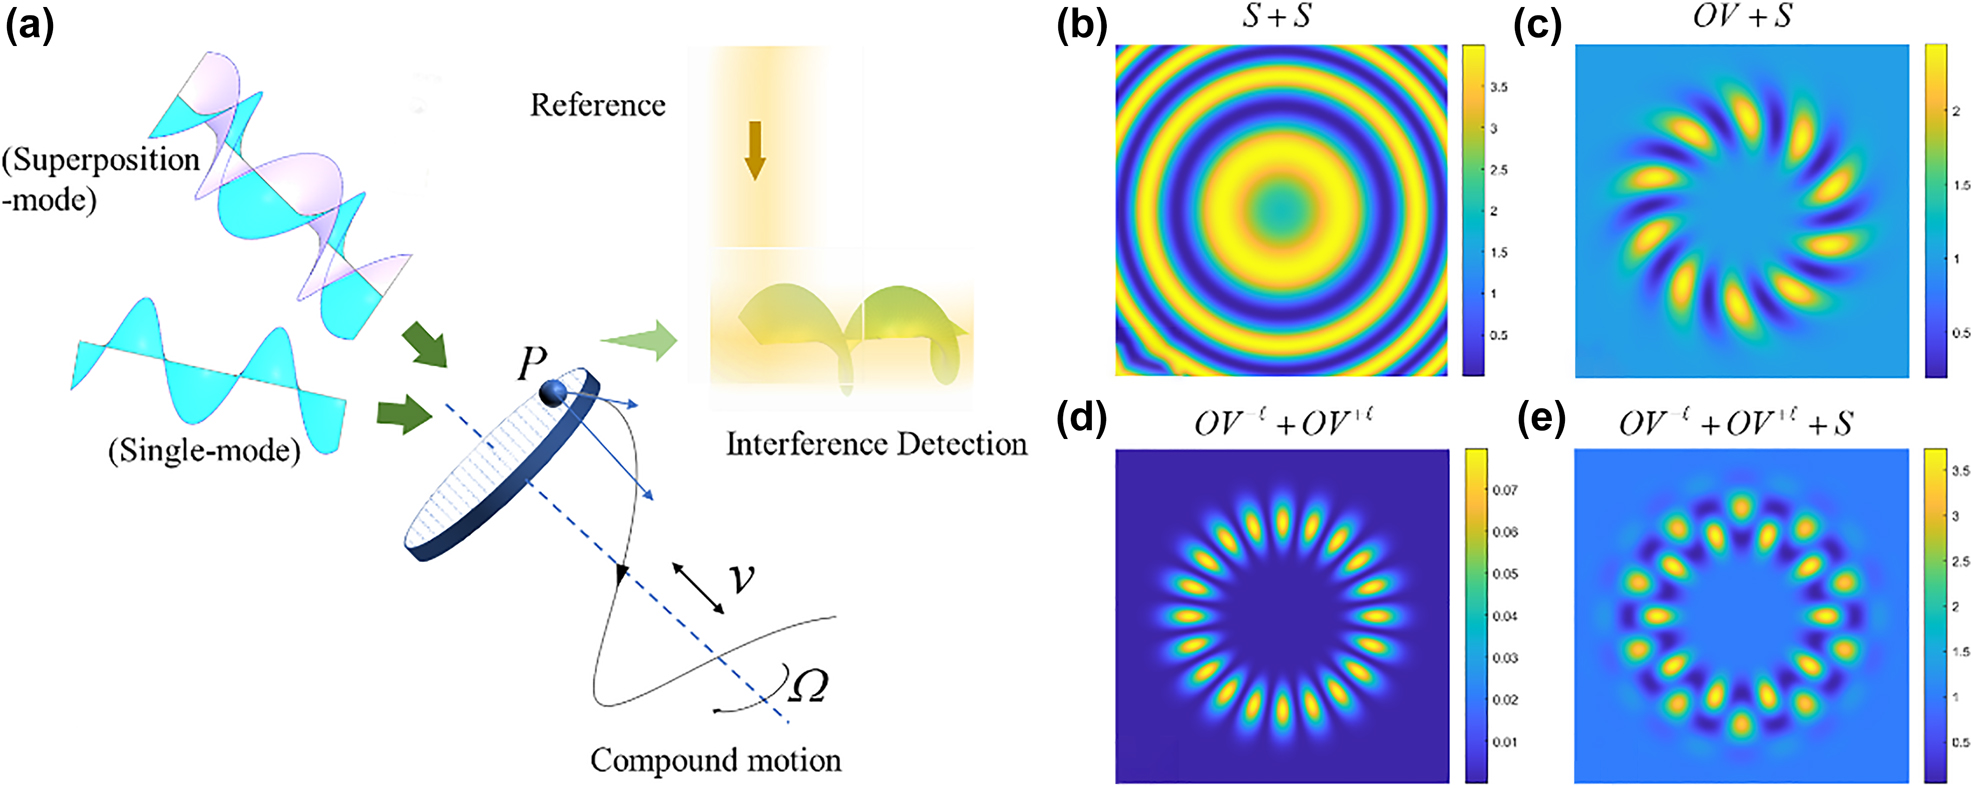
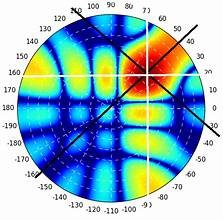
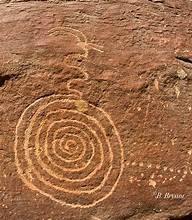
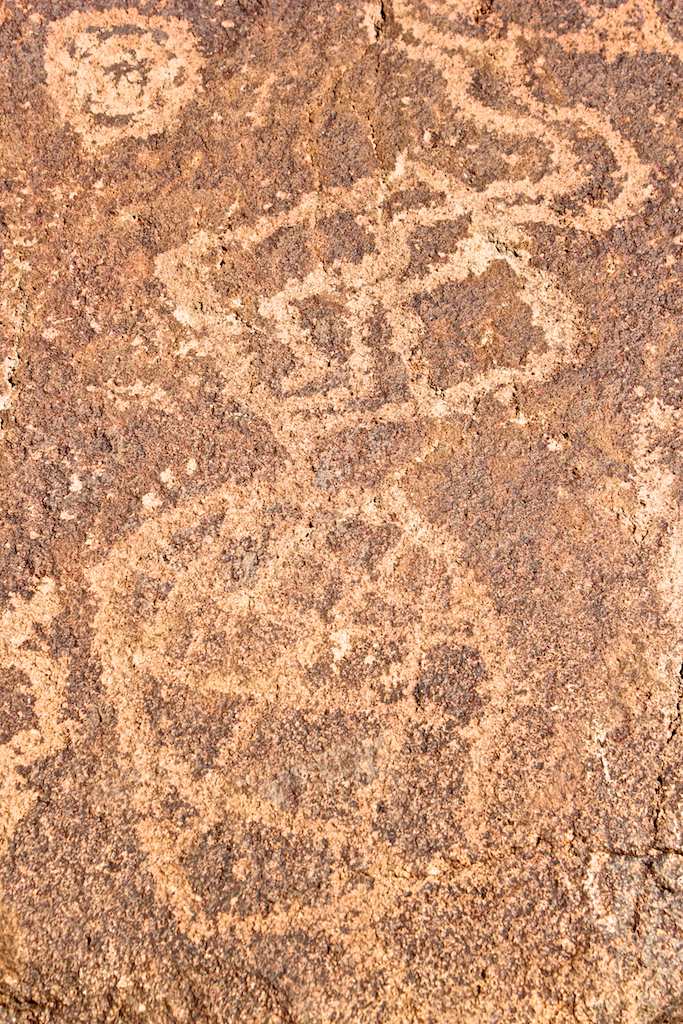
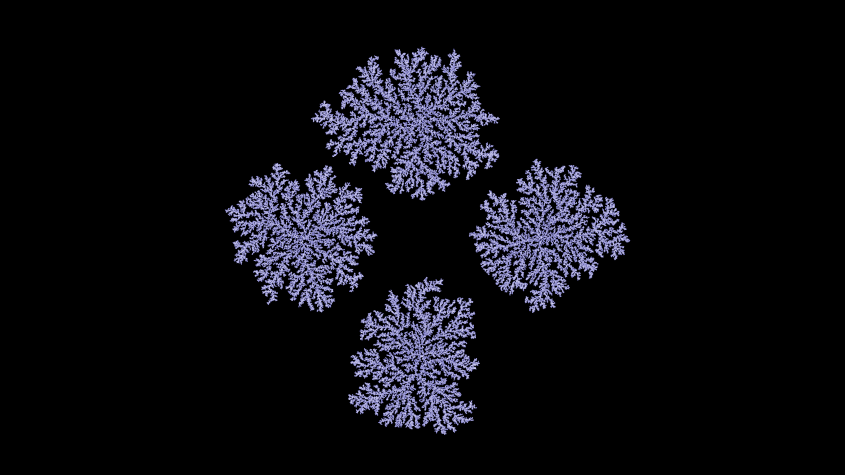
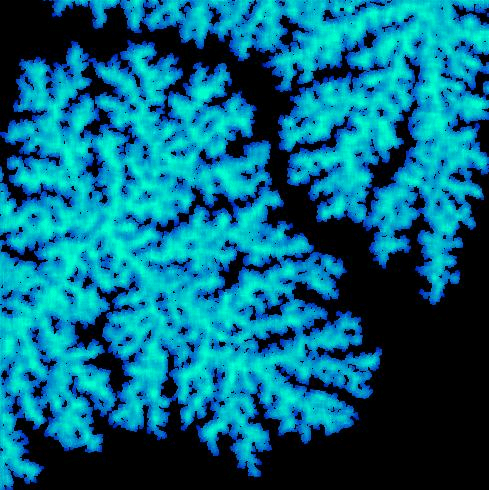
Excited hydrogen atoms vibrate in spherical harmonic frequencies which make the patterns shown in figure 12. These same patterns appear in petroglyphs, as well as the pillars at Gobekli Tepe and other ancient iconography. For example, concentric rings are a common petroglyph found in the same panels with squatterman. Hydrogen makes concentric rings in four different spherical frequencies, shown on the far left in Figure 12, and in Figure 13 alongside sample petroglyphs.


As energy poured into the thin plasma outer reaches of the atmosphere, it met layers of hydrogen. In a plasma storm, hydrogen would be produced in large quantities by electrolysis of surface water. An energized layer of plasma composed of hydrogen resonating at this particular frequency will holographically portray this signature form, at scale across the whole energized region.
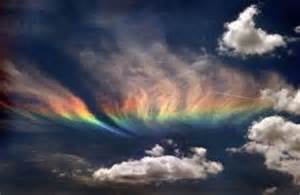
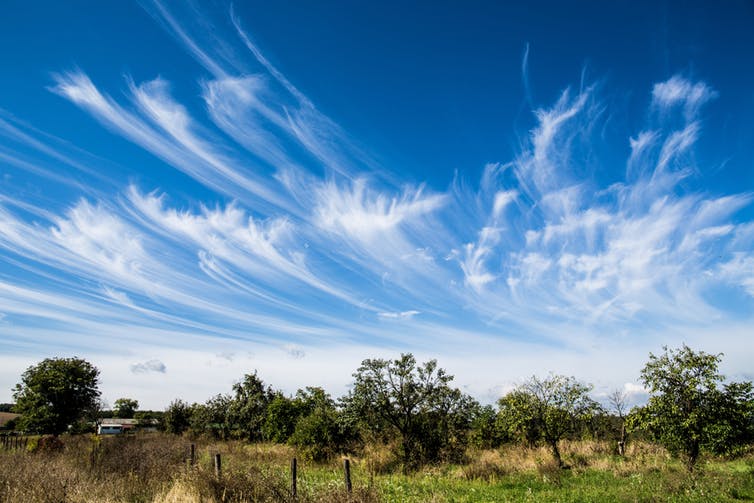
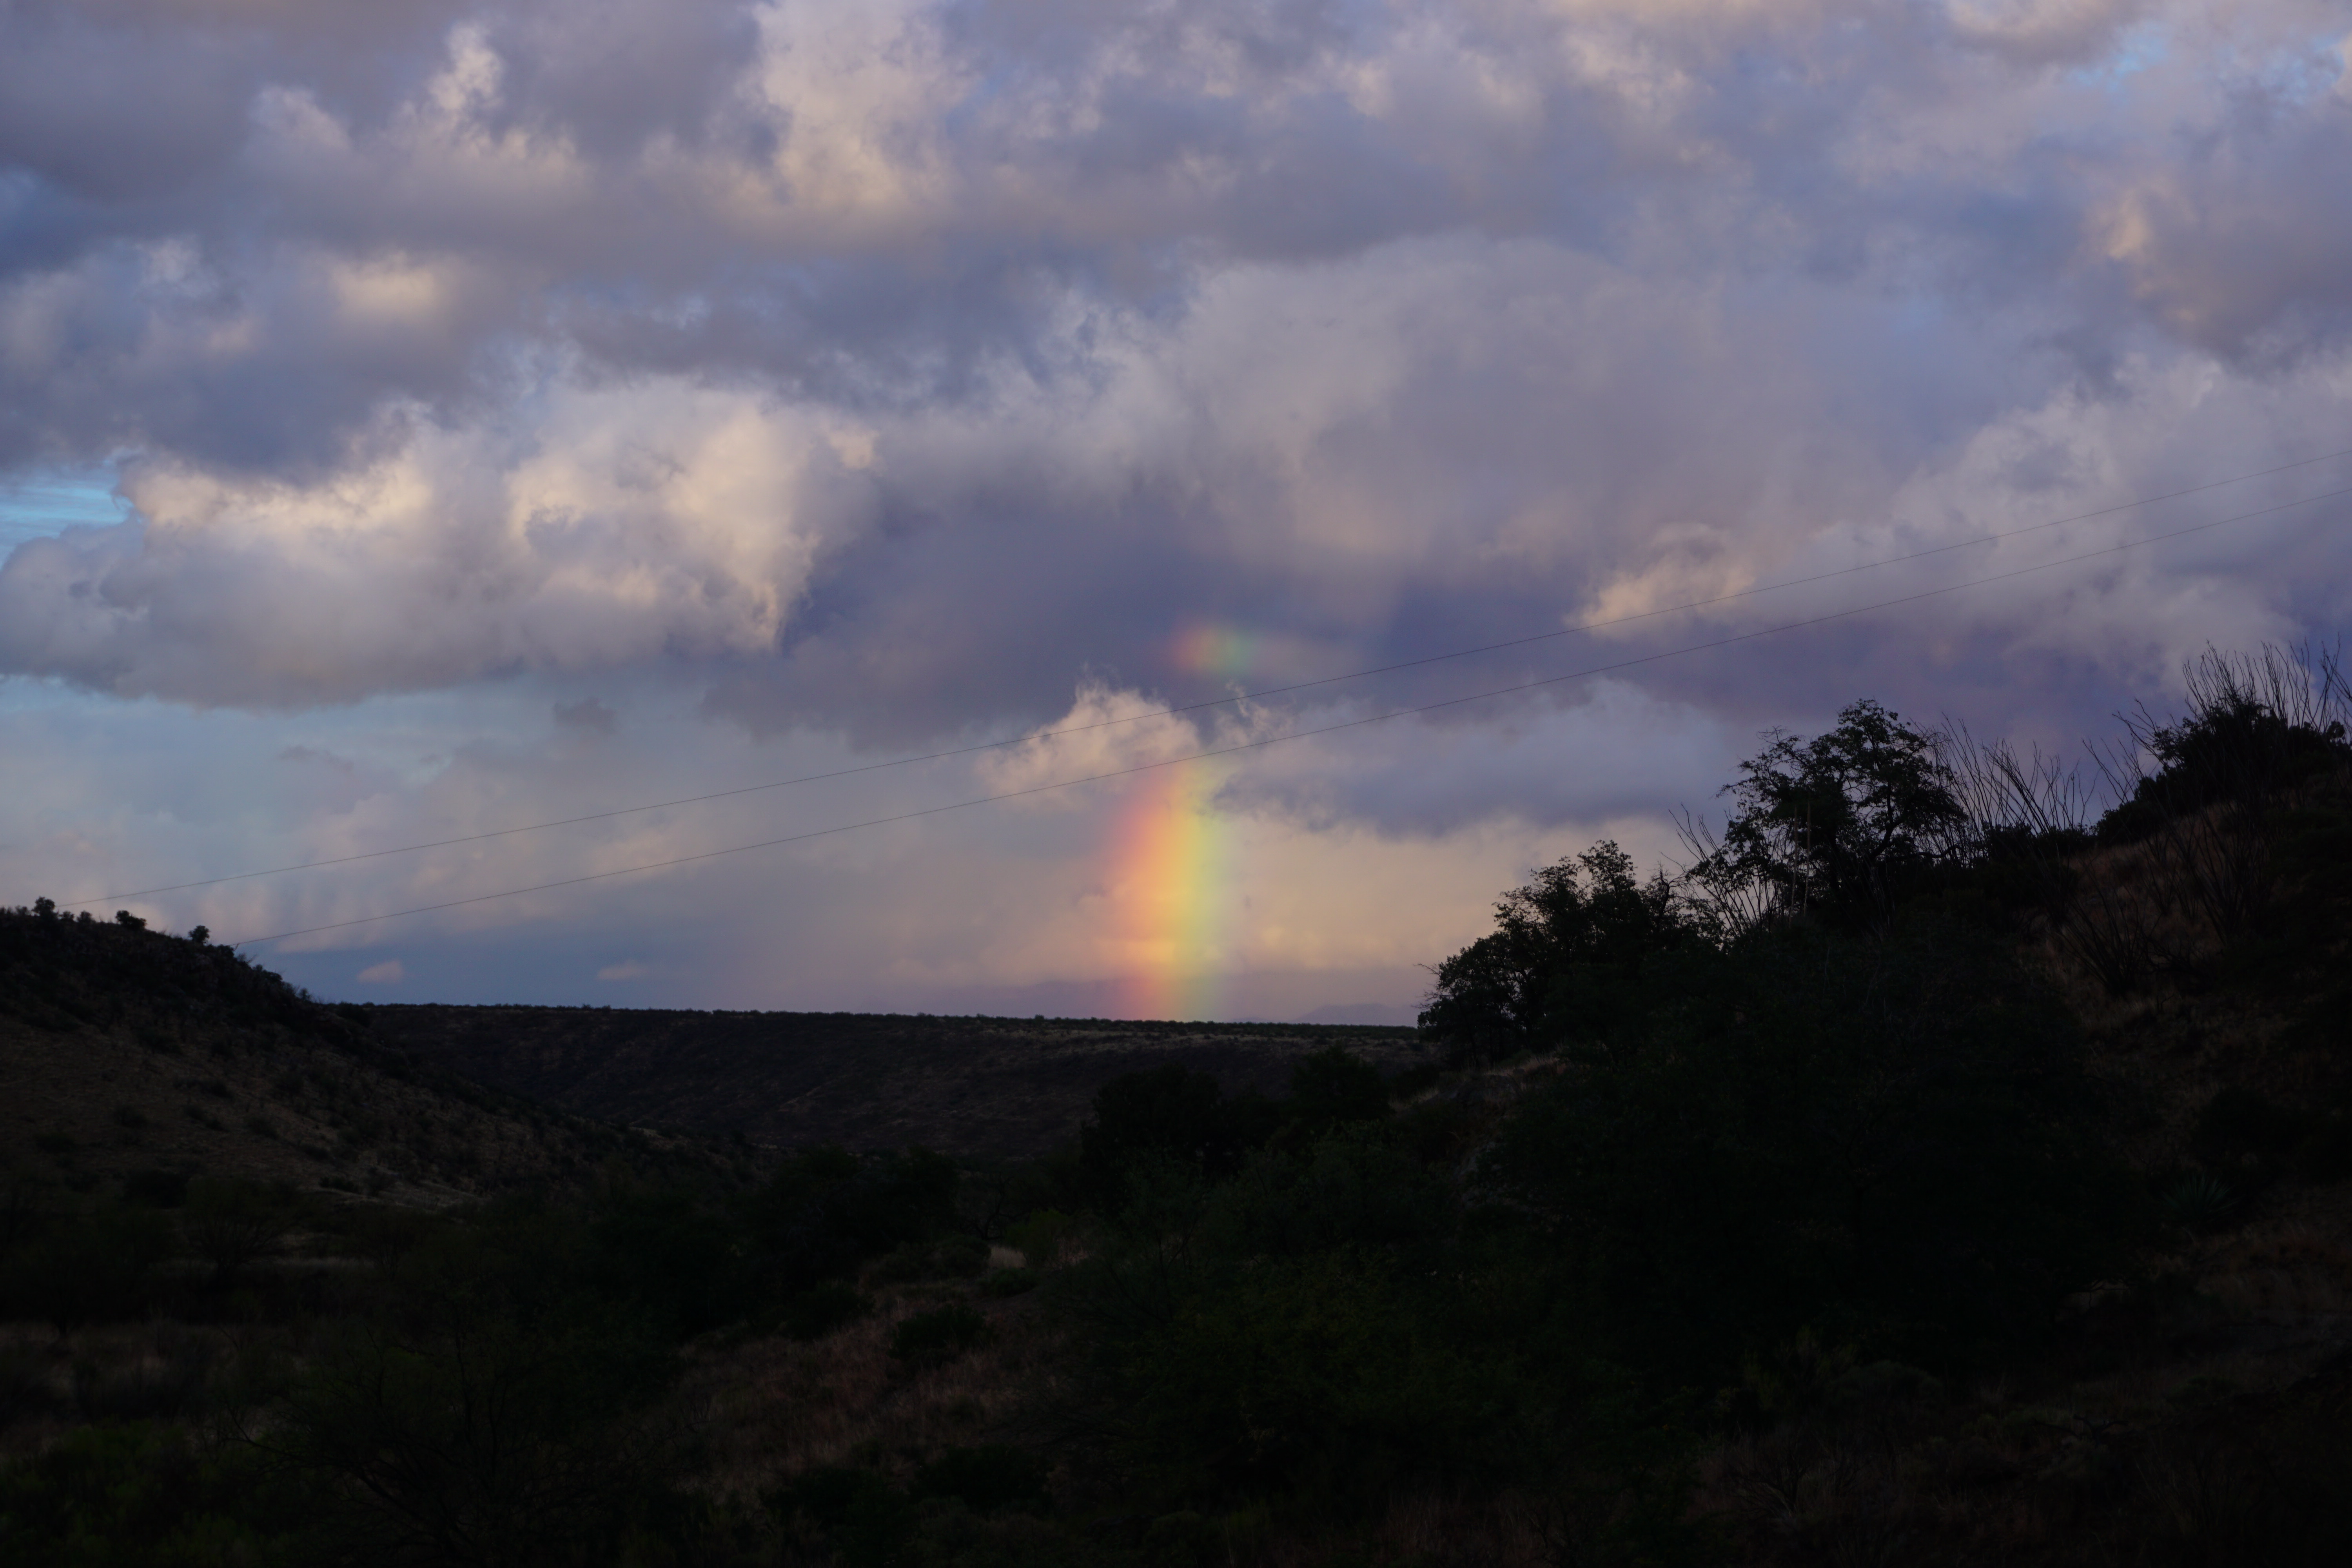
Coherent light structures are observed in the sky all the time, even though there is no lens, or prism involved, only tiny particles of water vapor acting holographically to form large structures, like rainbows, moon rings and other atmospheric phenomena. Hydrogen in a plasma will do the same thing.
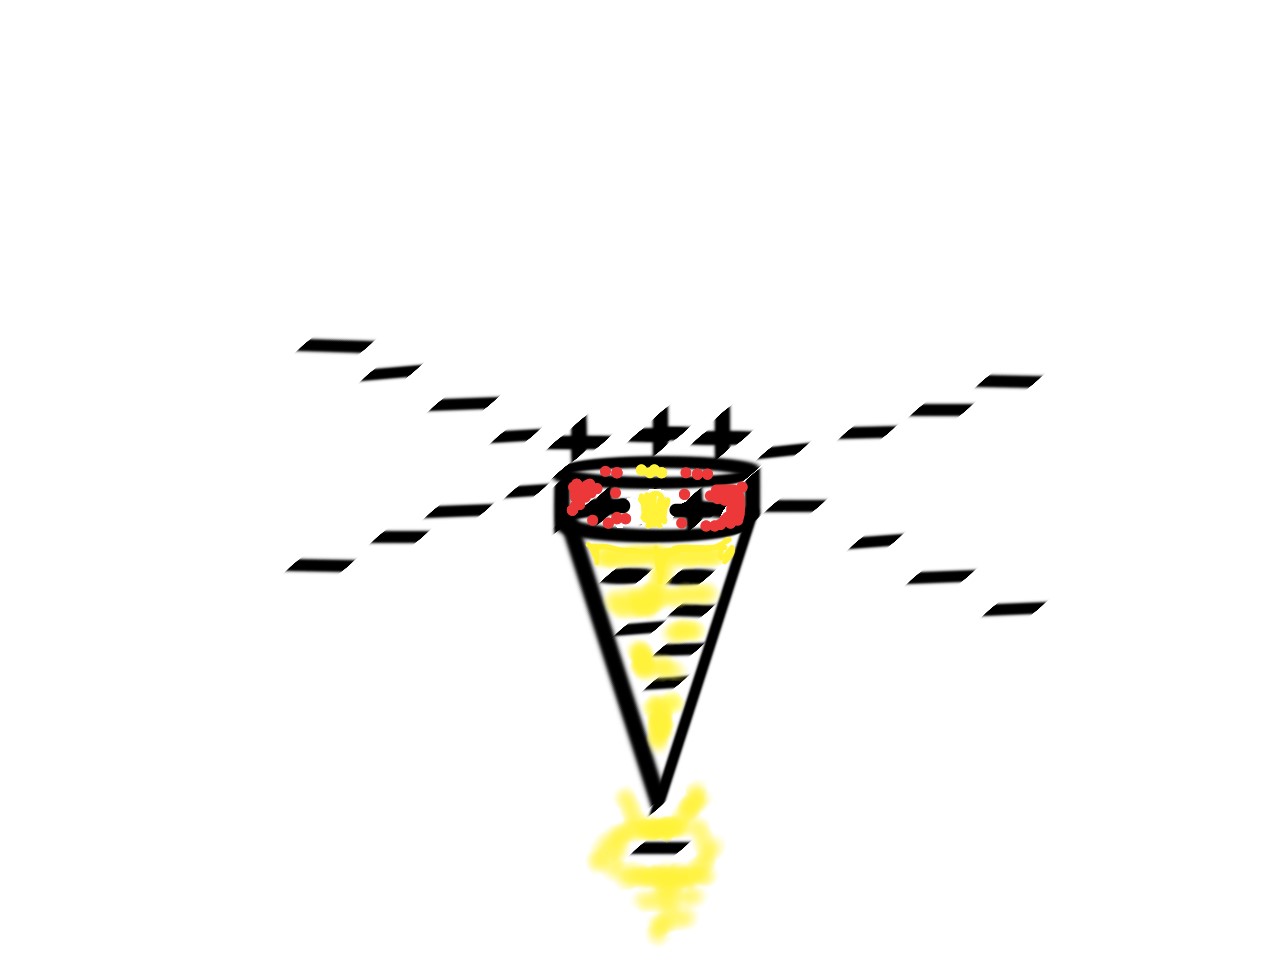
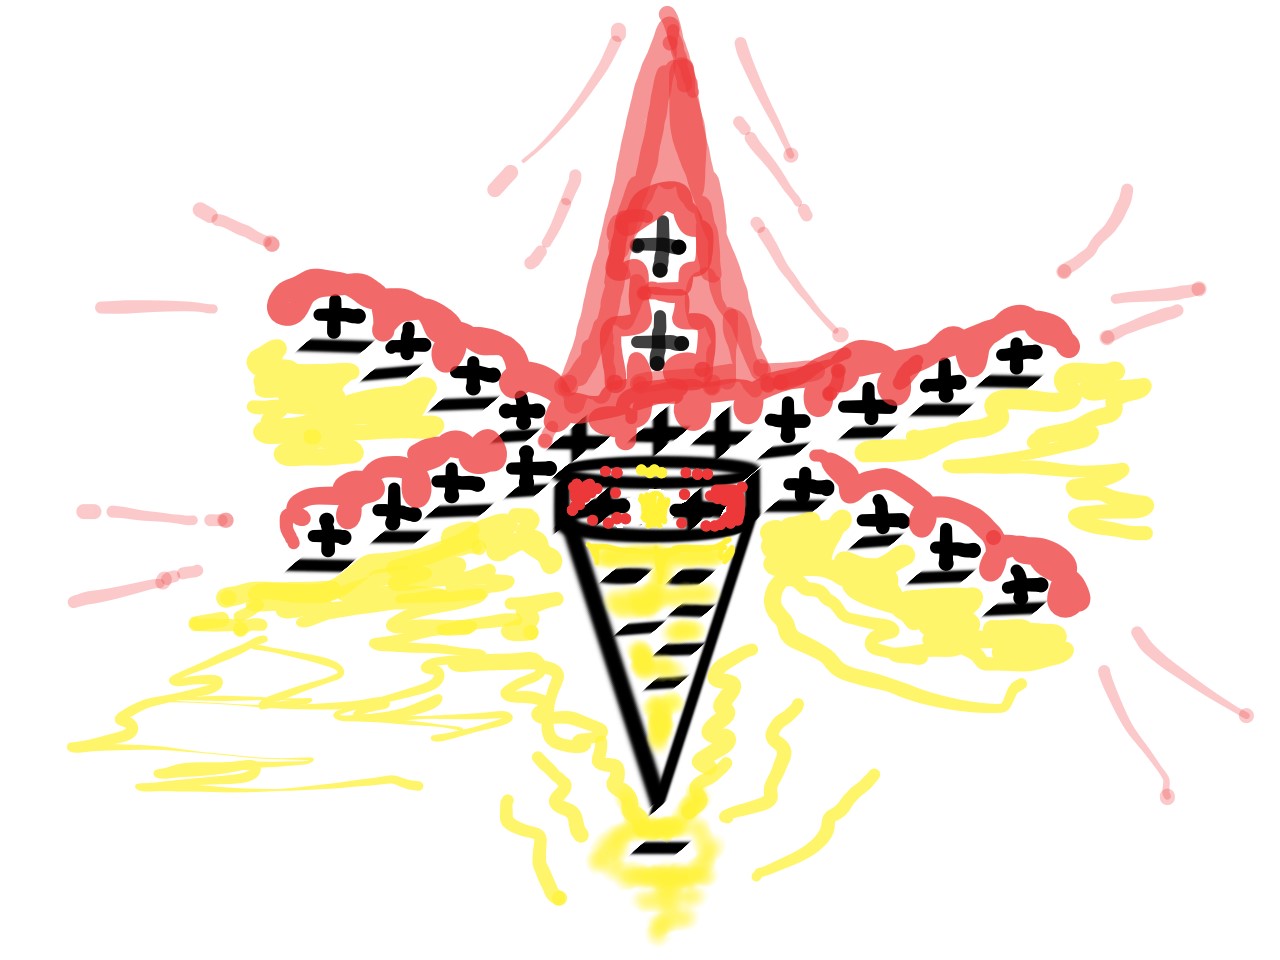
There is structure to the plasma because the electric field is vertical and perpendicular to the layer of hydrogen, creating a standing wave interference pattern. Each standing wave forms a cell, like a bubble of charge density that tessellates into spherical nodes vibrating at spherical frequencies.
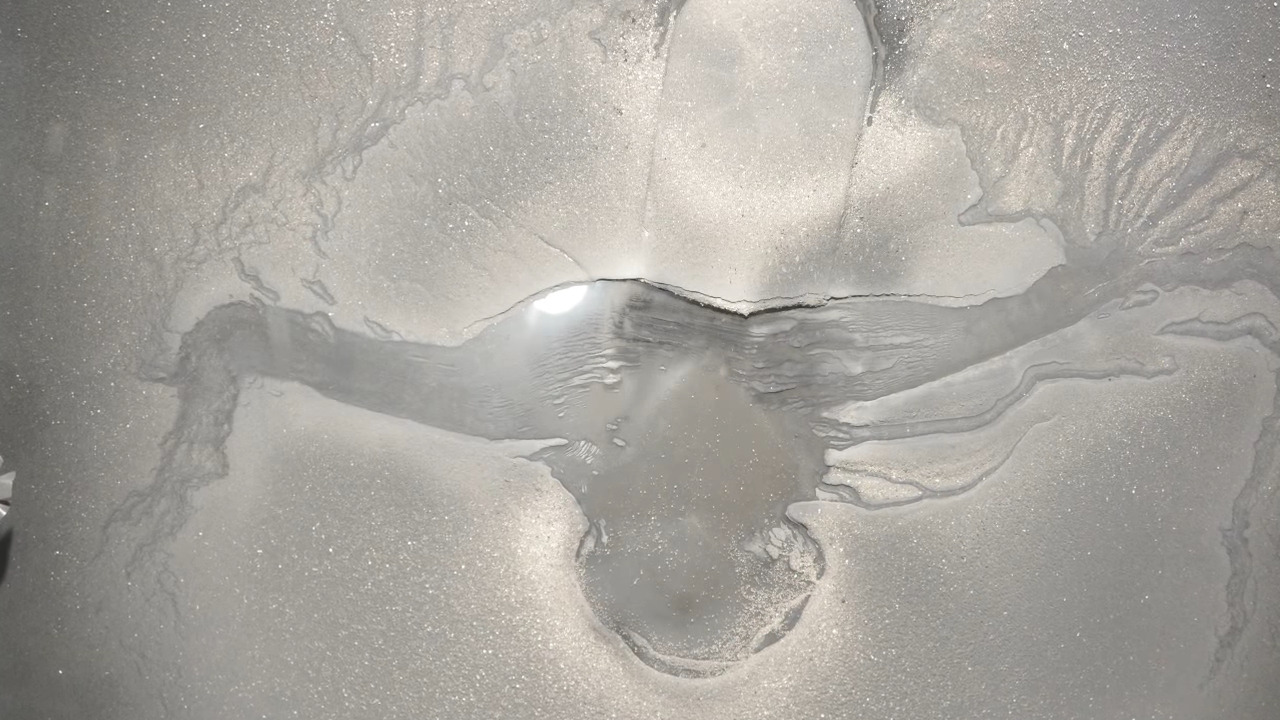
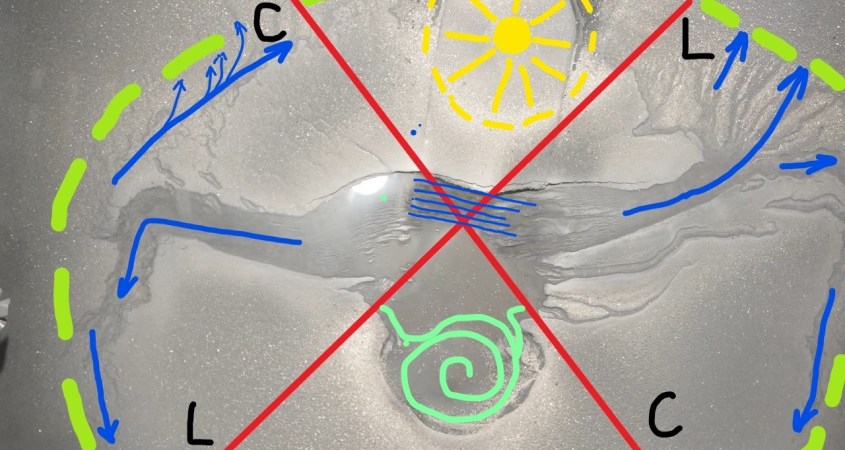
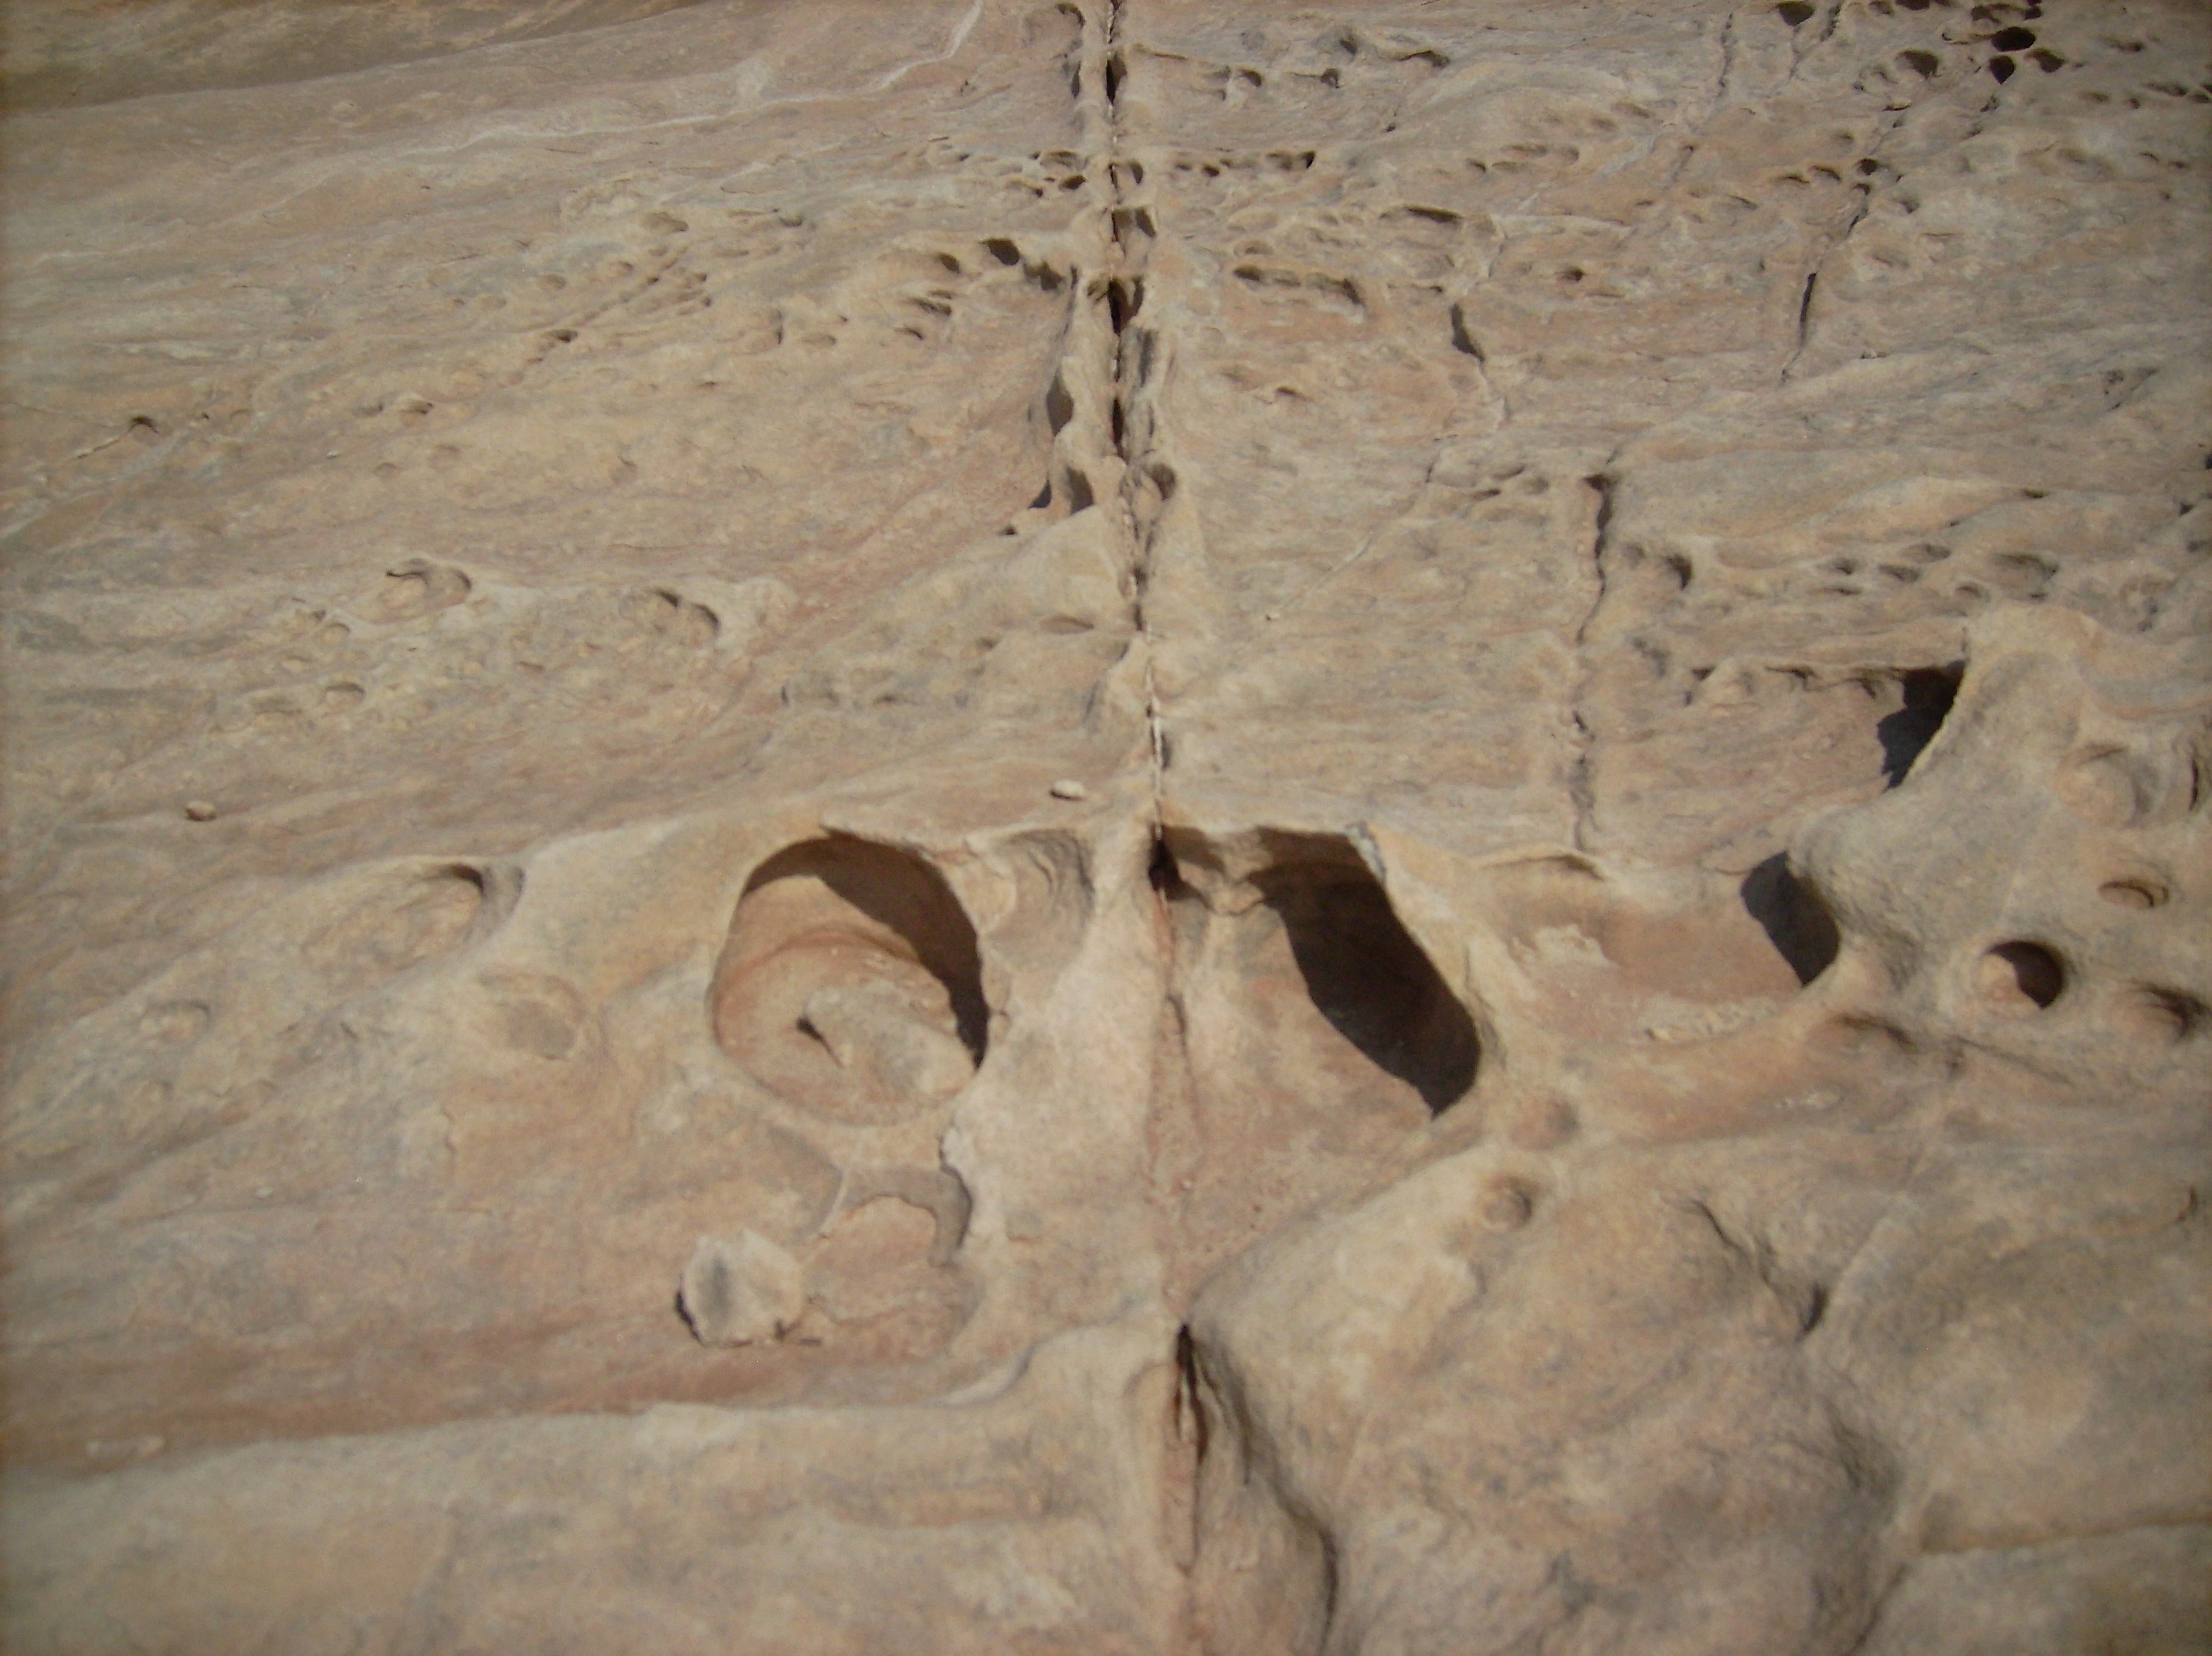
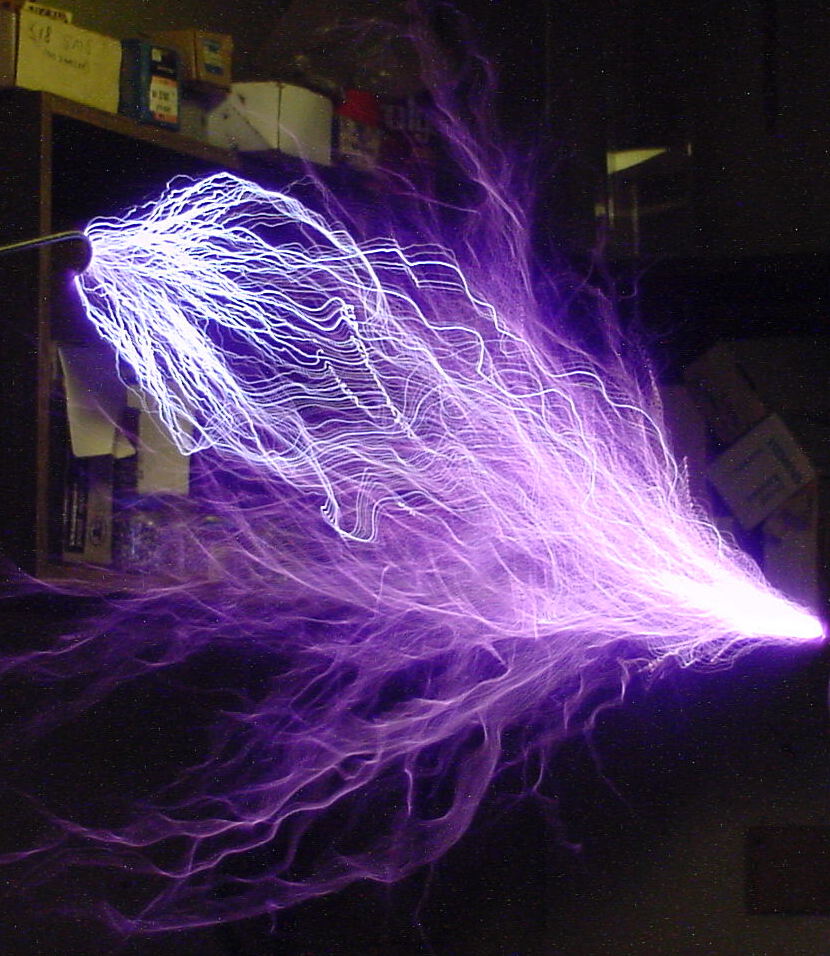
Tessellation of standing waves is also why some common aurora appear as columns of light, like in Figure 14. It is the same phenomena that makes the patterns of light beneath the waves in this pool in Figure 15. The wave structure itself focuses light, defining the wave troughs and peaks in light and shadow. Petroglyph images are also tessellated wave patterns. They were made by glowing waves of plasma instead of sunlight and water.

In fact, not all petroglyphs display animals, or anything recognizable. Many petroglyphs display cellular patterns like the pool water, as shown in Figure 16.


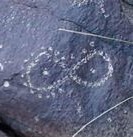
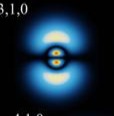
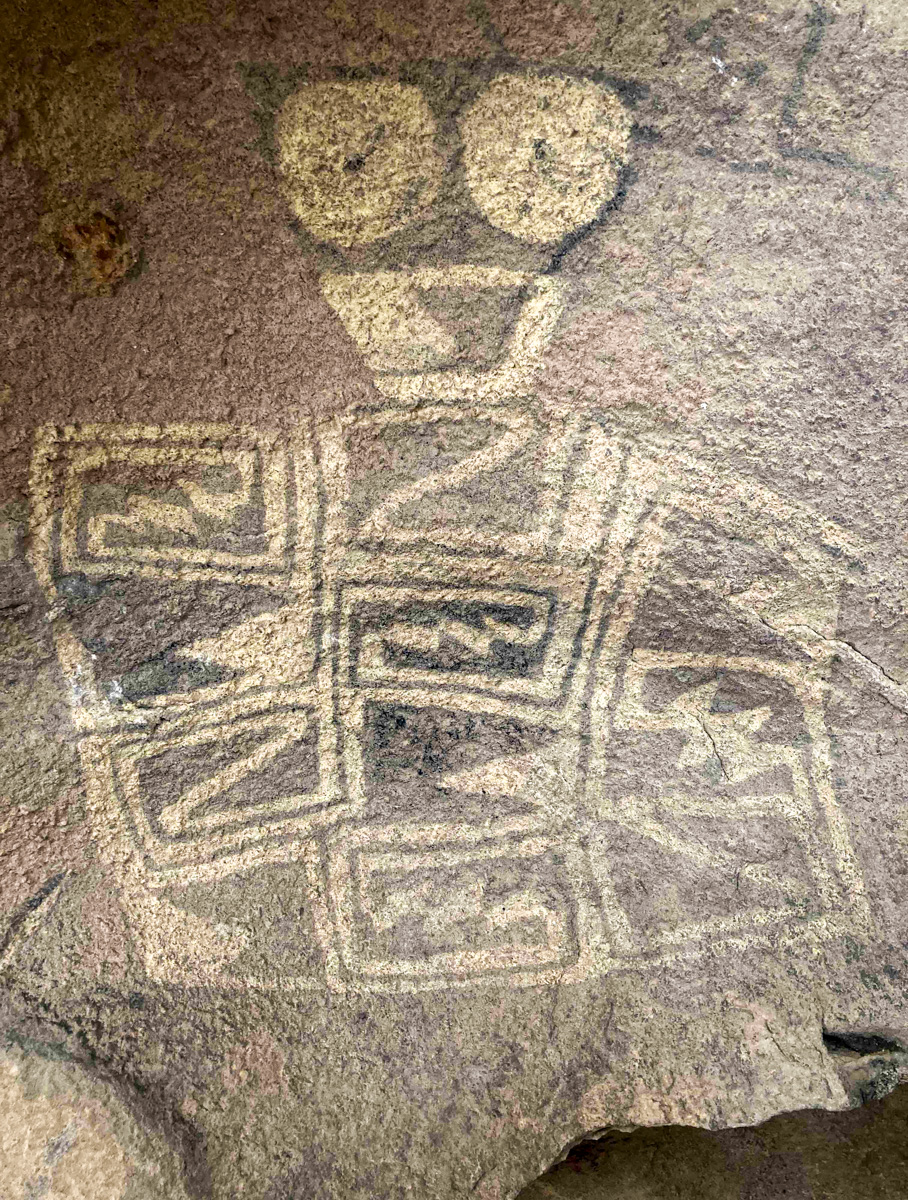
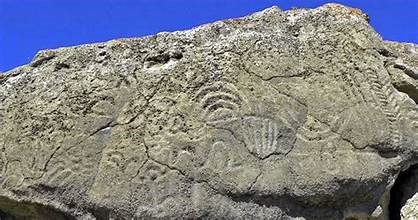
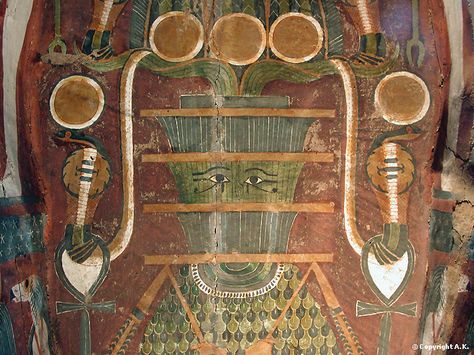
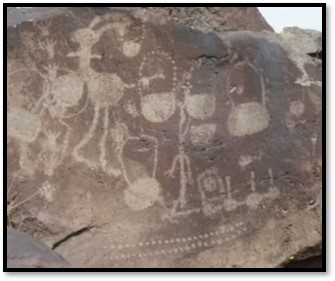
A common image recorded in petroglyphs and elsewhere is known as “goggle-eyes”. As you can see in Figure 17, goggle-eyes are sometimes portrayed alone and sometimes incorporated into a face, or pillar-like anthropomorphic statues. Goggle-eyes are found in petroglyphs alongside squatterman and concentric rings. Goggle-eyes are formed by hydrogen.


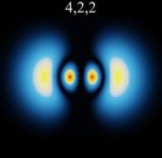
At other spherical frequencies, hydrogen forms other patterns similar to ones found on Gobekli Tepe pillars, and elsewhere, proving these were being witnessed in the heavens from around the world. Certain designs that look like dumbbells, or horseshoe magnets facing each other are found on the pillars in Turkey, as well as indigenous African art, thousands of miles and centuries away. They are also patterns created by excited hydrogen that resemble the letters “H”, “I” and “U”, shown in Figure 18.


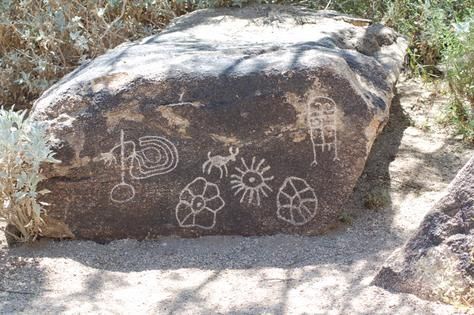
Stars and flowers are another common theme seen in petroglyphs and ancient iconography that auroral hydrogen is responsible for. The star is the inverse of the flower, and both were portrayed as light emissions oscillated from the flower-shaped outer boundary to the star-like inner filamentary structure of the tessellated plasma cell.

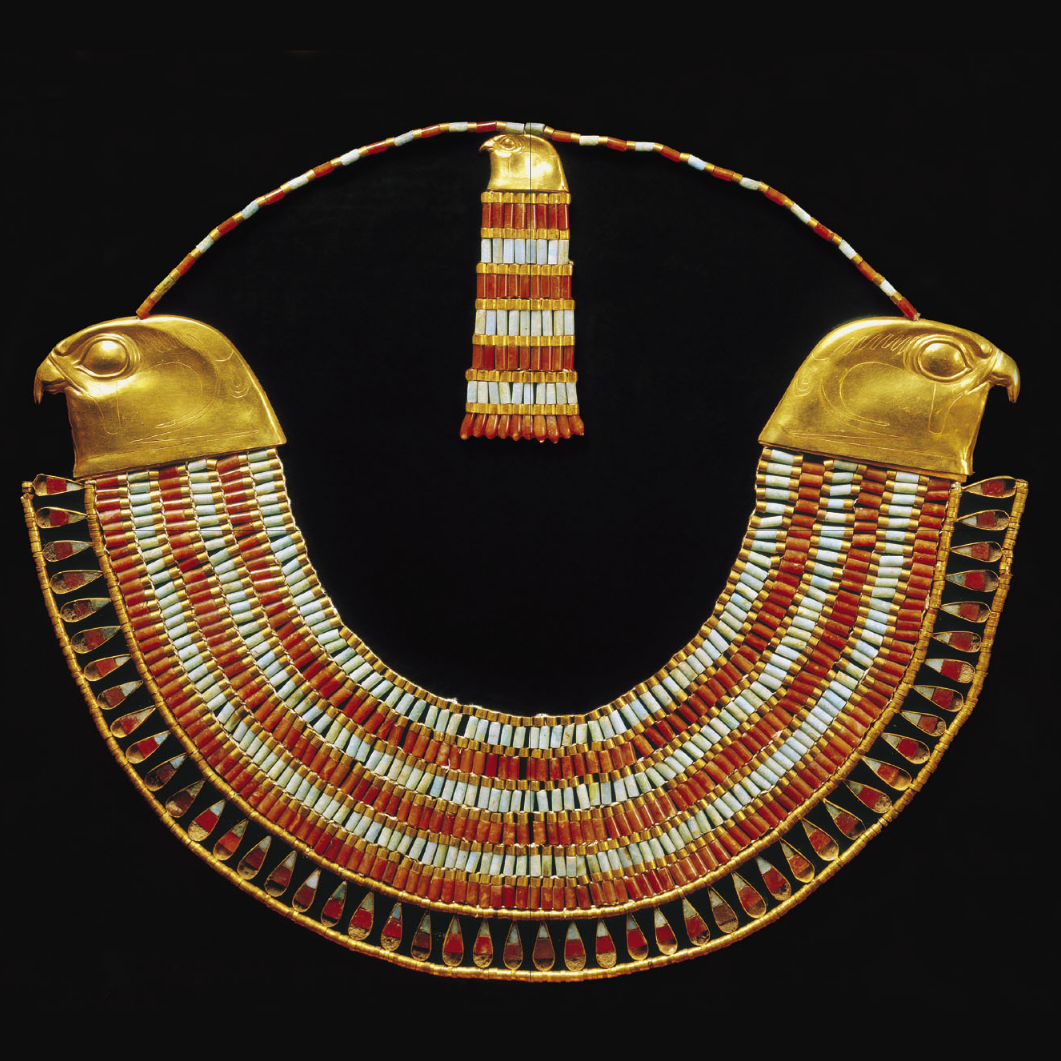
Other forms made by plasma, not necessarily hydrogen, include certain animals, like birds, often shown as a sequence of repeating patterns. They are on pillars as well as petroglyphs, again proving the link as something universally seen around the world.

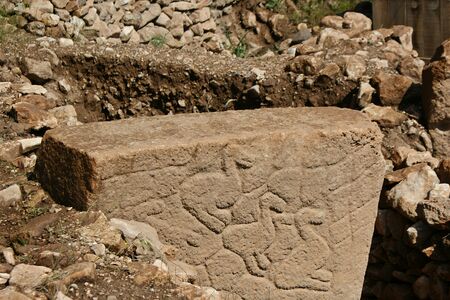
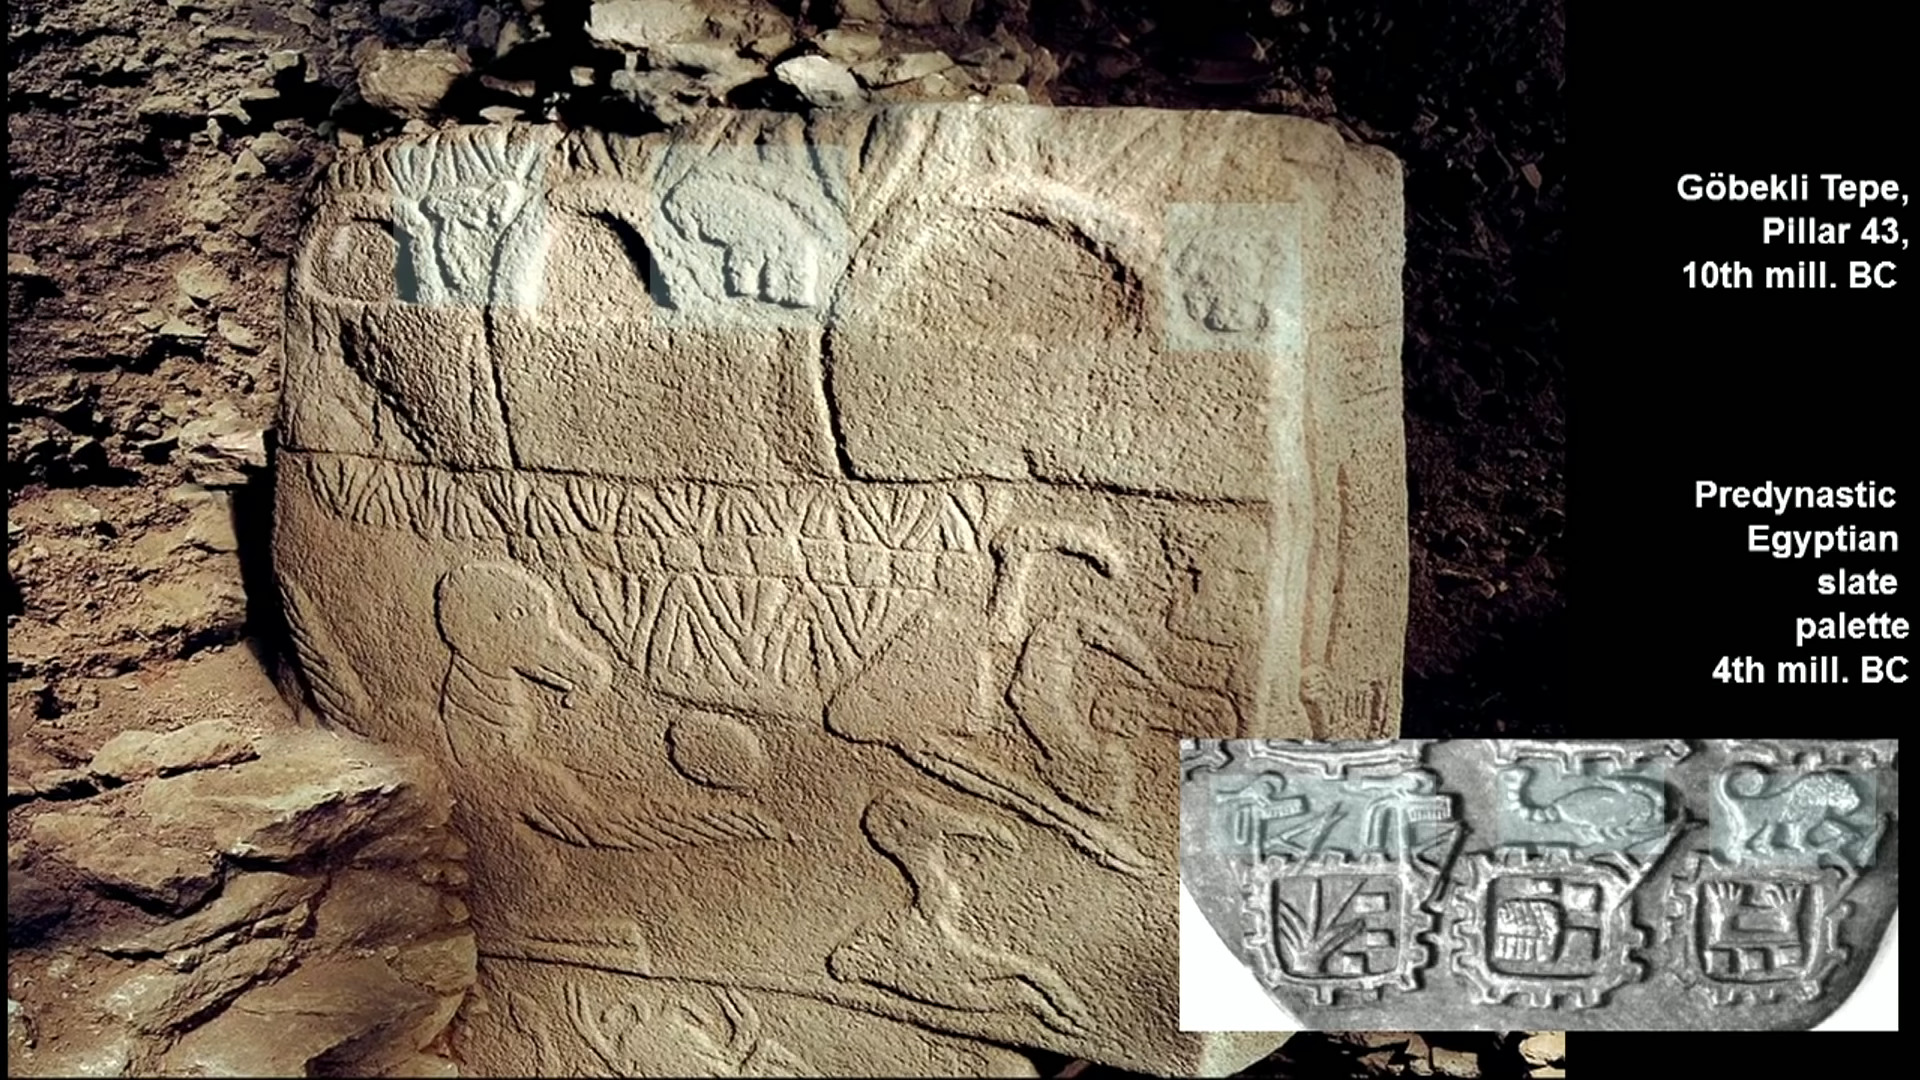
Repeating forms, especially in rows and columns, is a feature unique to high energy plasma. They are another effect caused by tessellated interference patterns in energized plasma. Instead of one tessellated cell lighting, charge diffuses through a patch of identical standing waves, lighting-up repeating features in each.

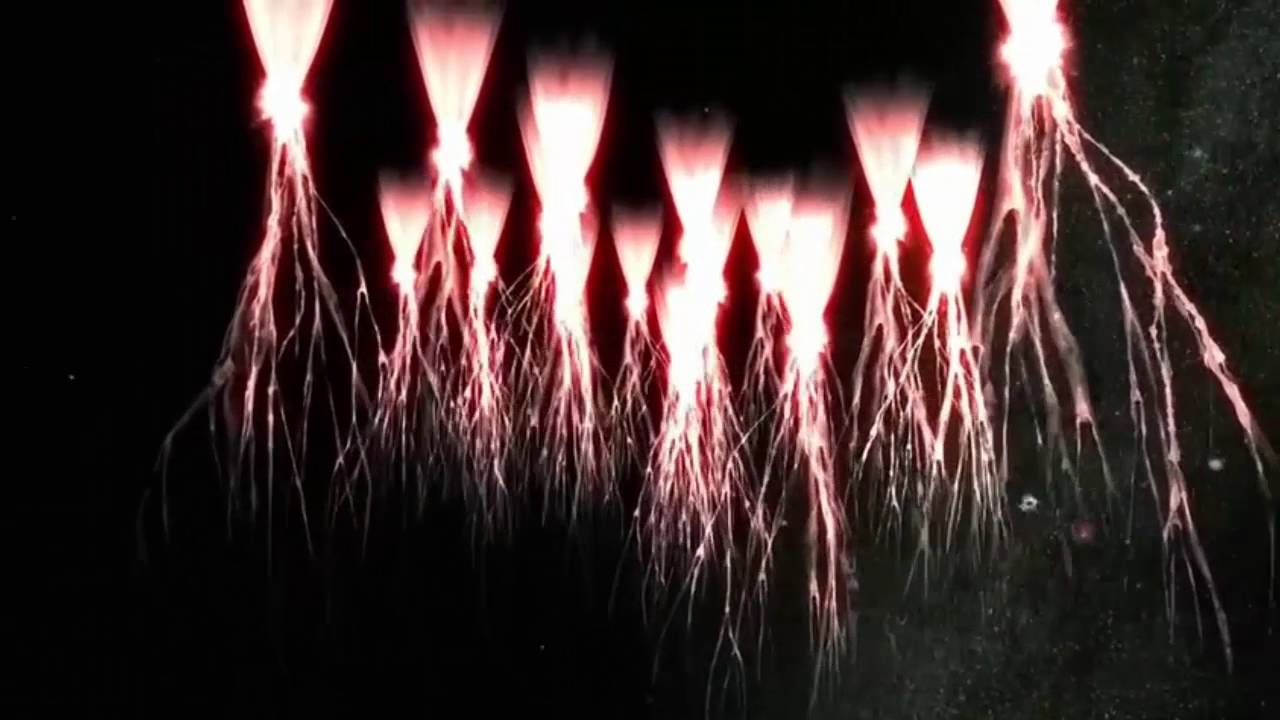
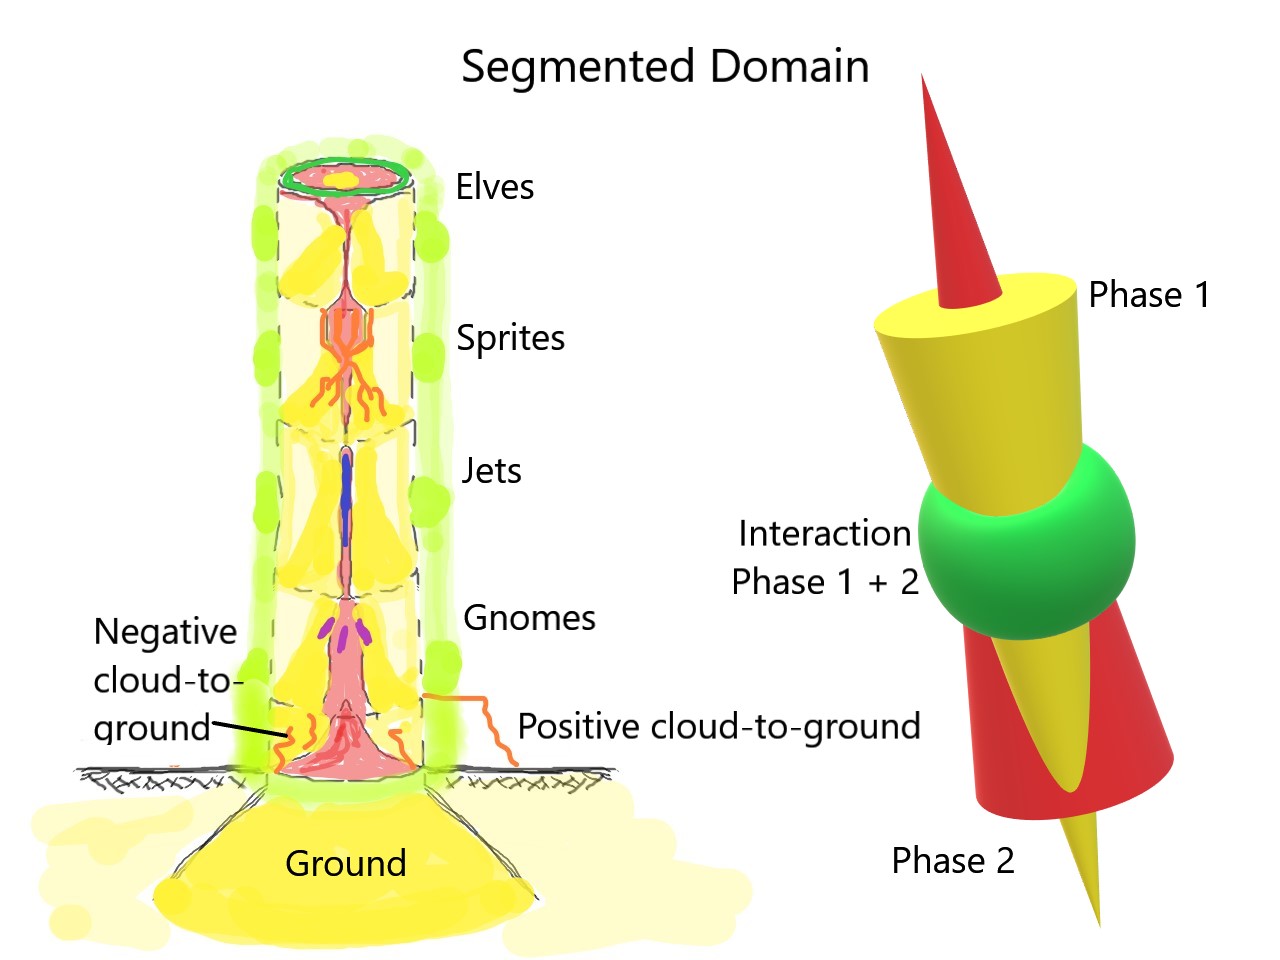
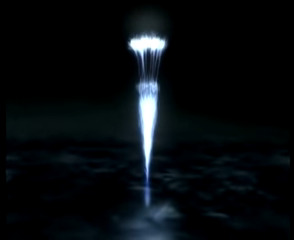
We can see the same thing above thunderstorms with high speed cameras. Figure 22 shows self-similar plasma sprites appear like a school of jellyfish as multiple high altitude tessellated cells discharge in-phase.
It is no coincidence that high energy plasma “Z-pinch” creates a human form, or that interference patterns in a plasma makes forms that resemble living organisms. The universe is holographic with a fabric of pure aetheric energy, so every form is a fractal harmony of wave patterns. Repeating forms in Nature is the rule, not the exception.
Science says petroglyphs and pictographs depict local fauna, scenery and normal activities, like people hunting and dancing. Please, take note of the images and see if things look normal to you. For once, we have a clear example of scientists suffering pareidolia.
There is continuity of images and themes in the artwork of ancient Anatolia that is repeated in rock art around the world. “T” pillars are an example of this and present an astonishing implication. “T” pillars are not exclusive to these sites in Turkey. They are found in all ancient cradles of civilization. Like ‘squatterman’ and “Jacob’s Ladder’ which are found in petroglyphs around the world, a form of the ‘T-pillar is found at megalithic sites around the world.
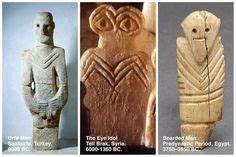
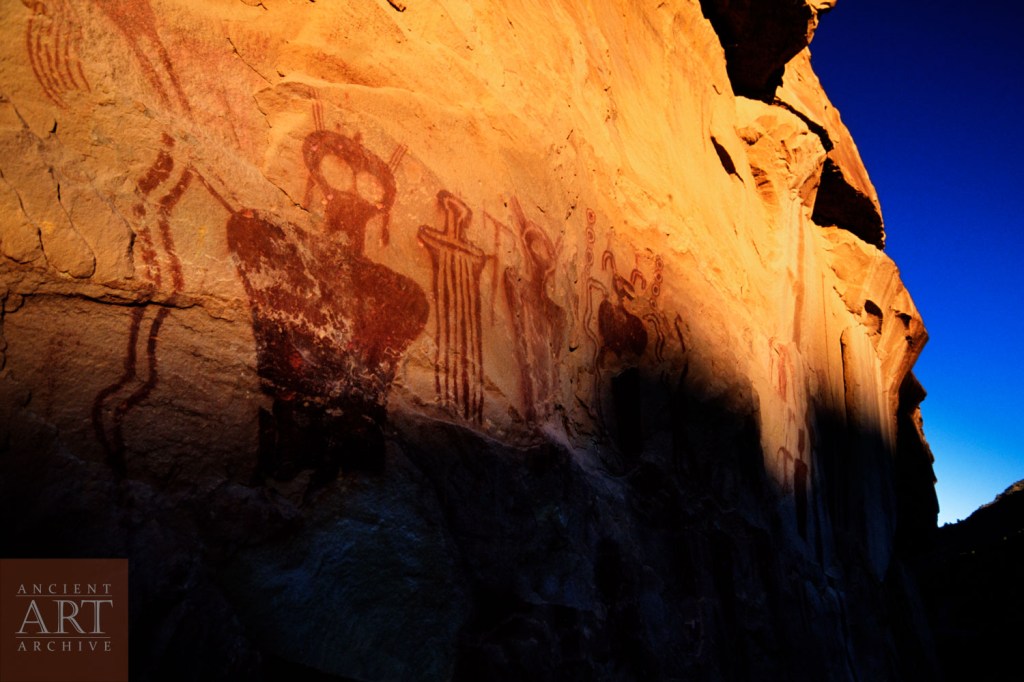
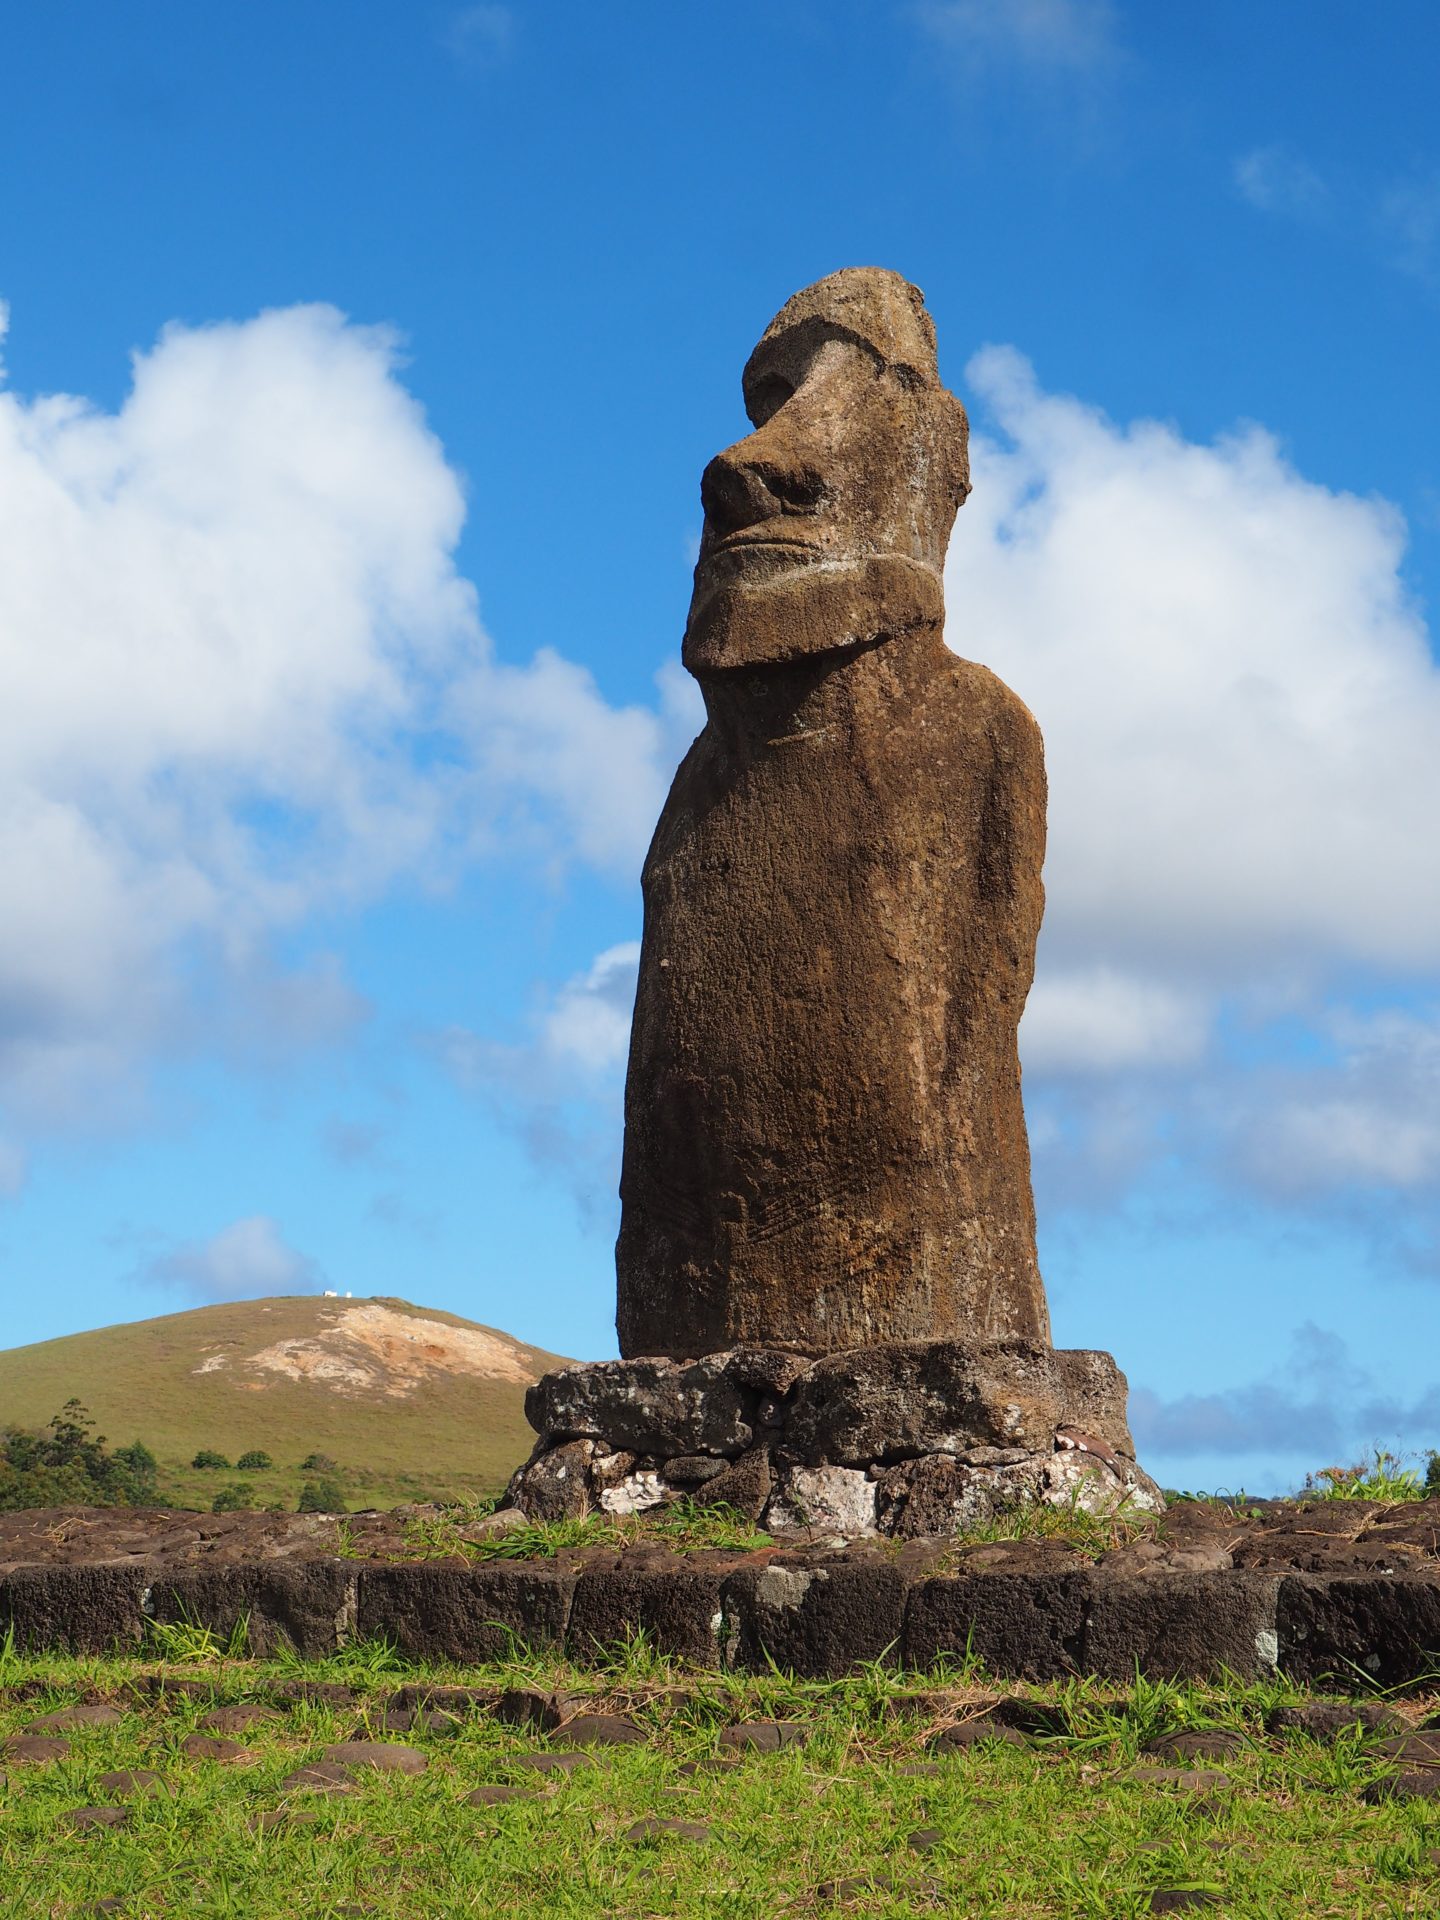
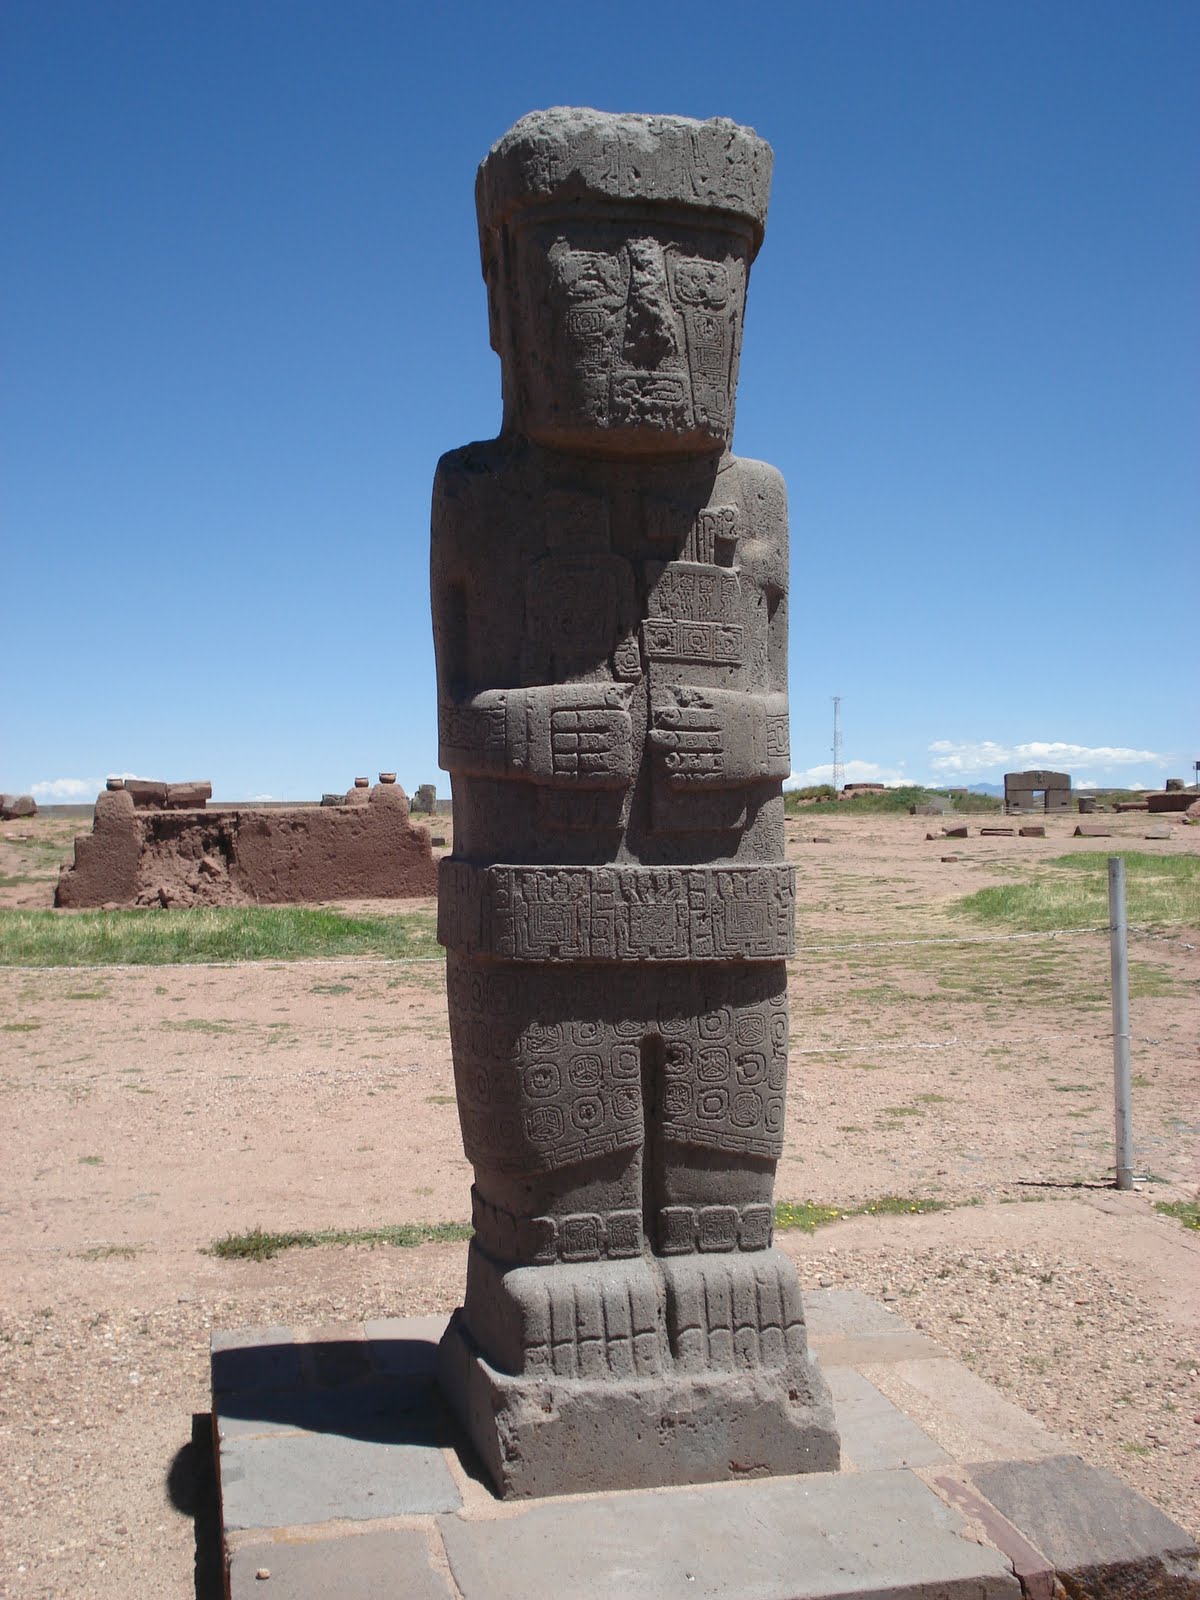
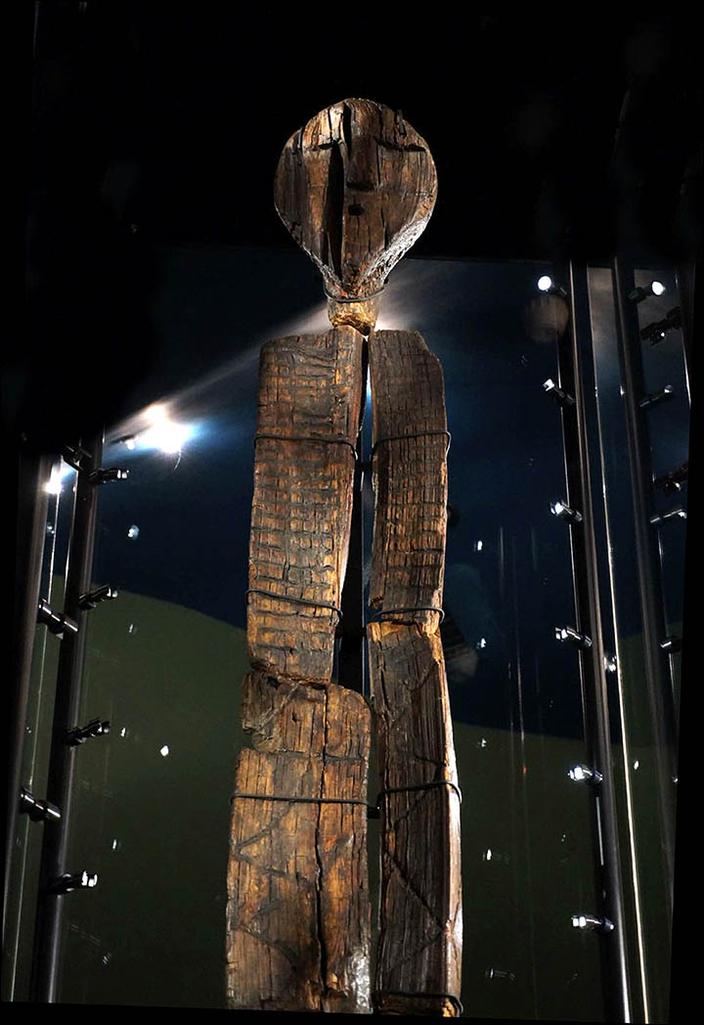
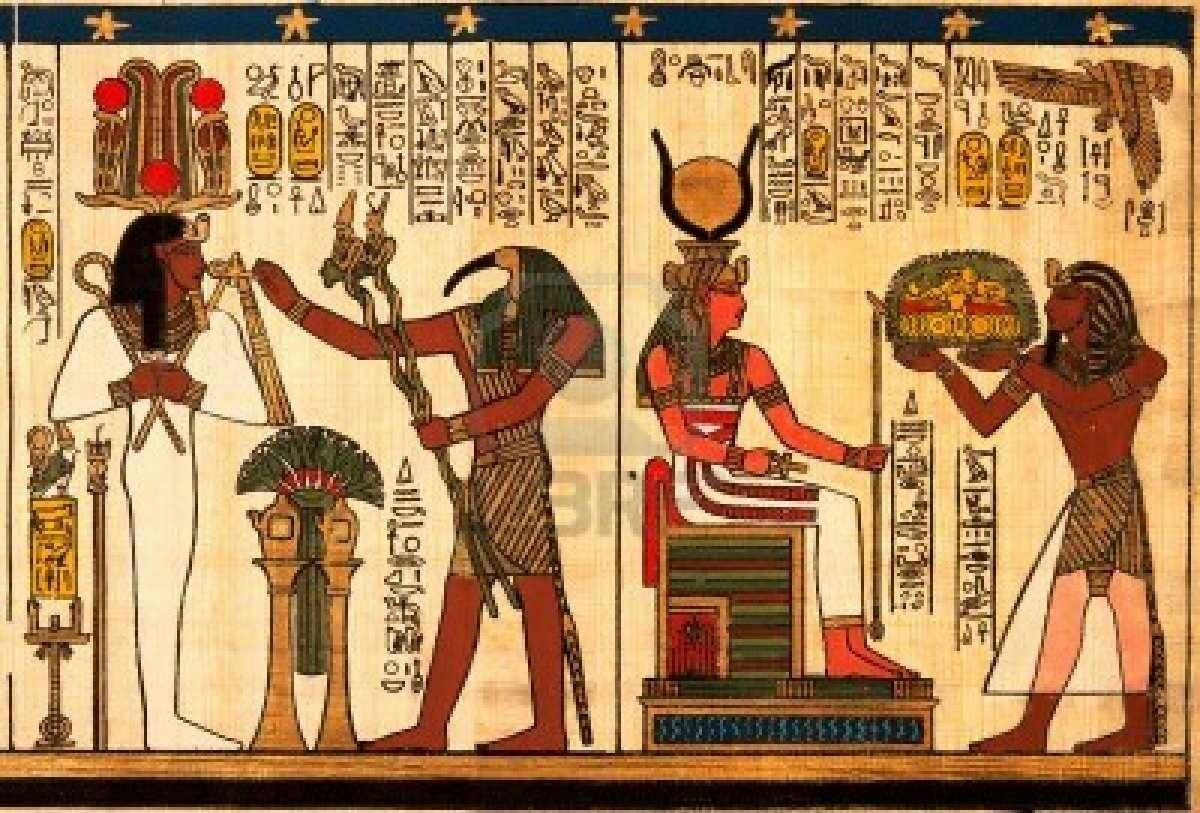
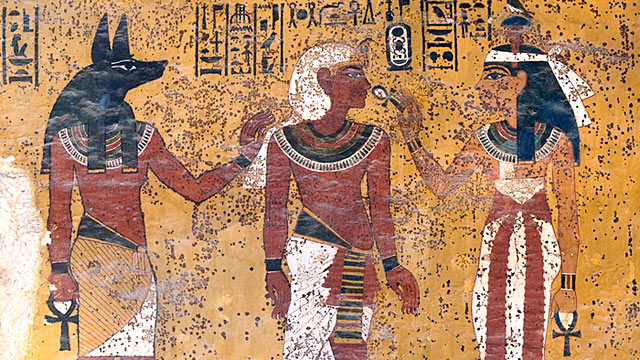
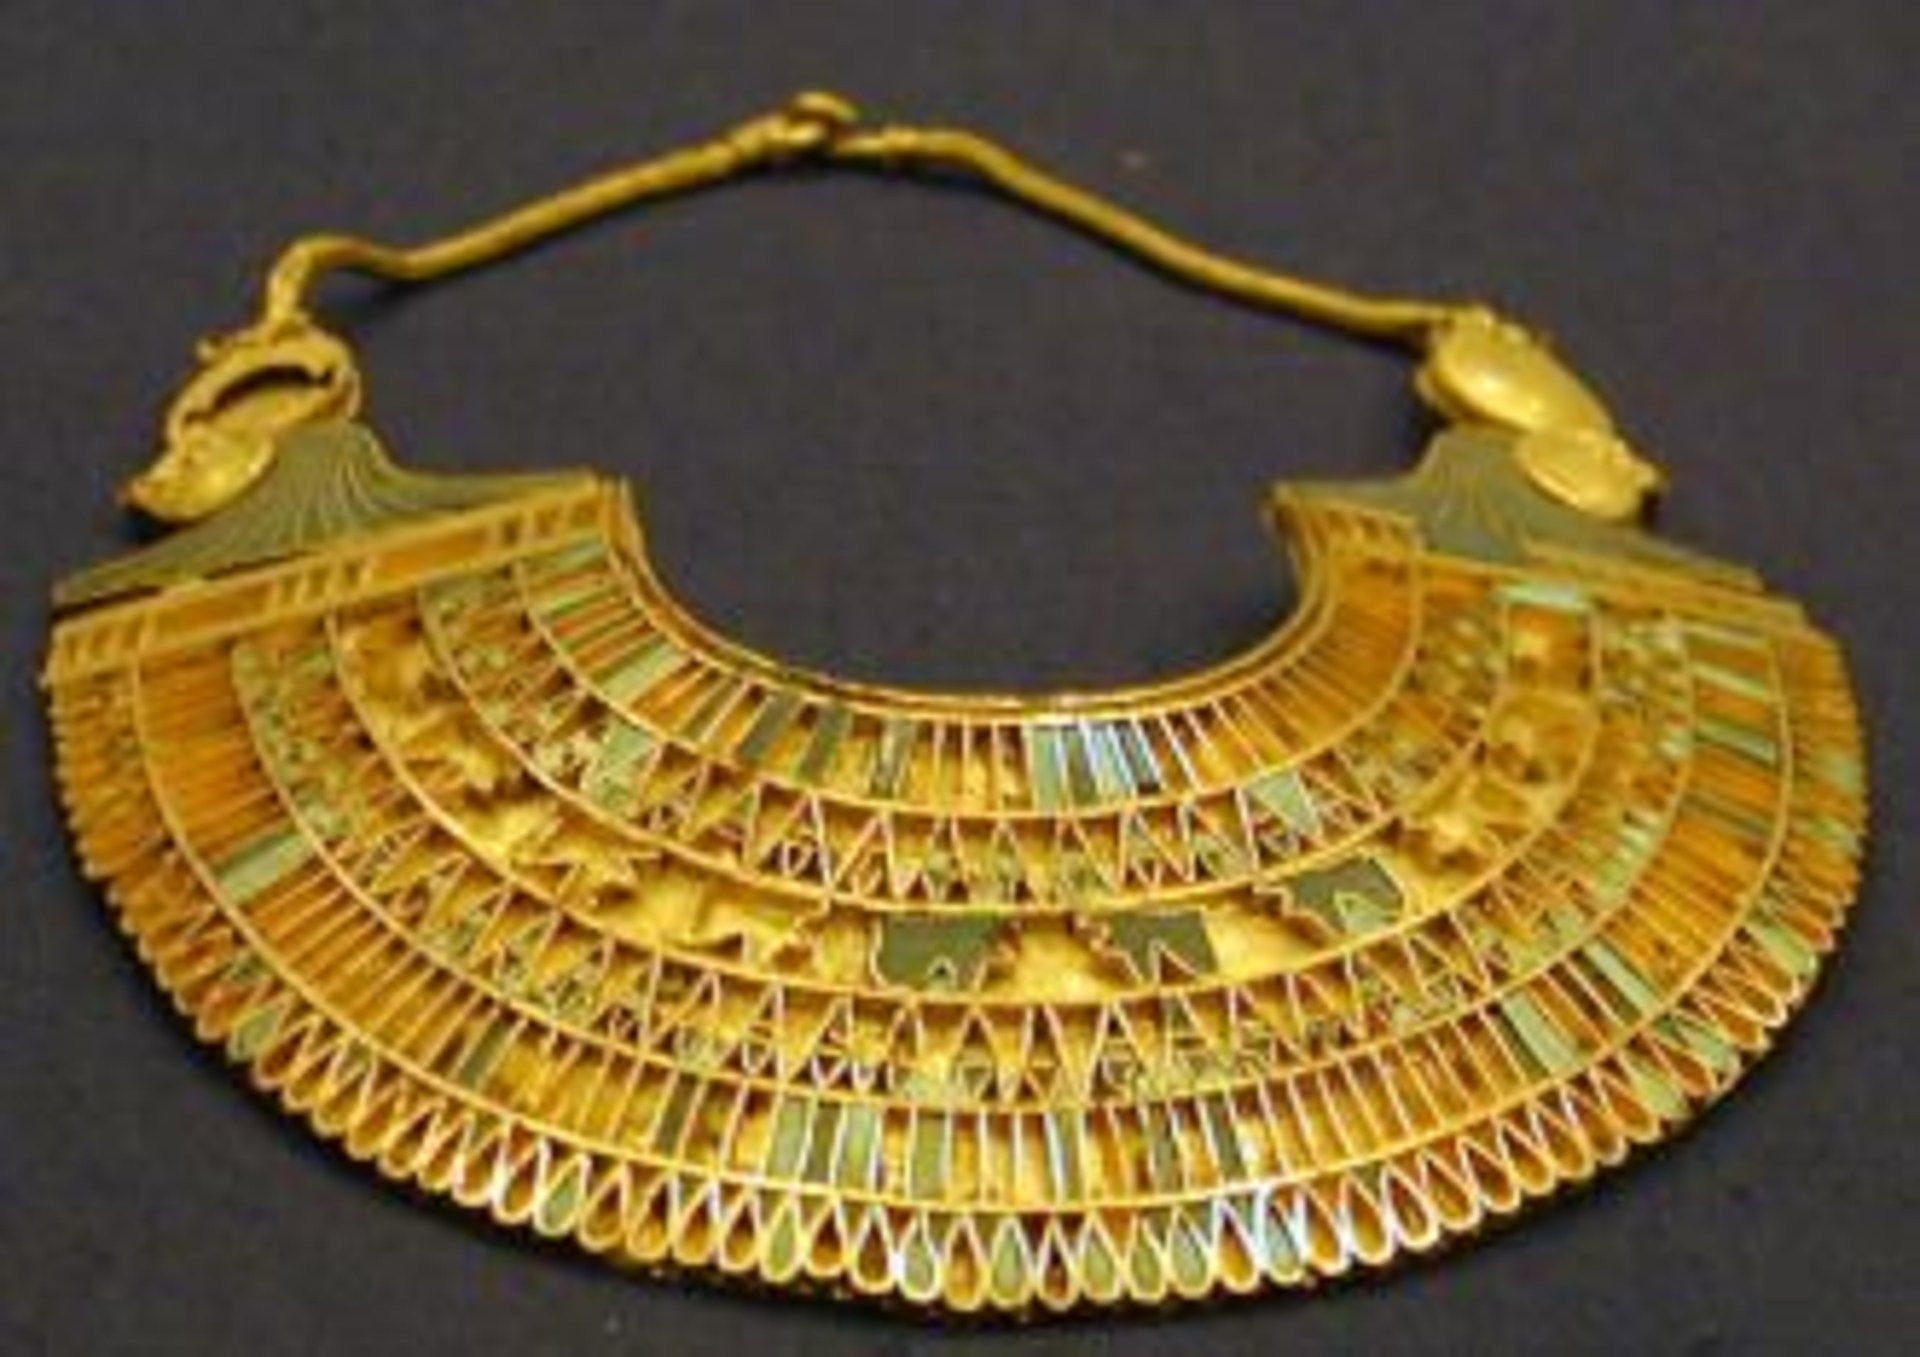
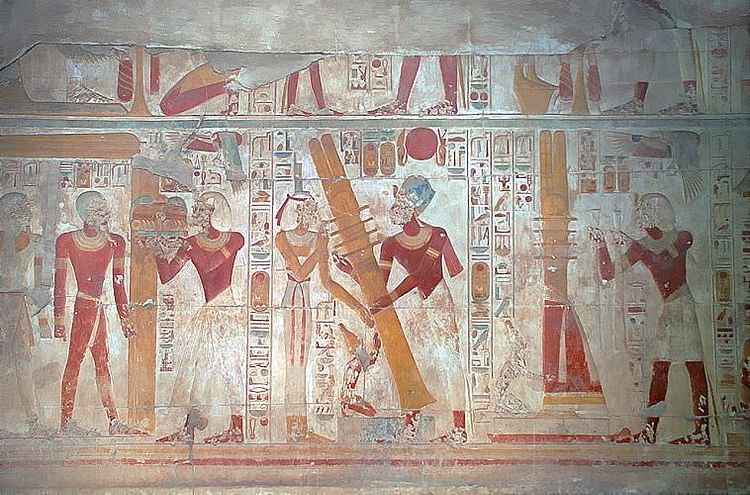
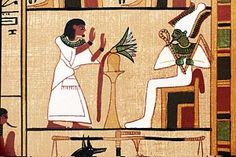
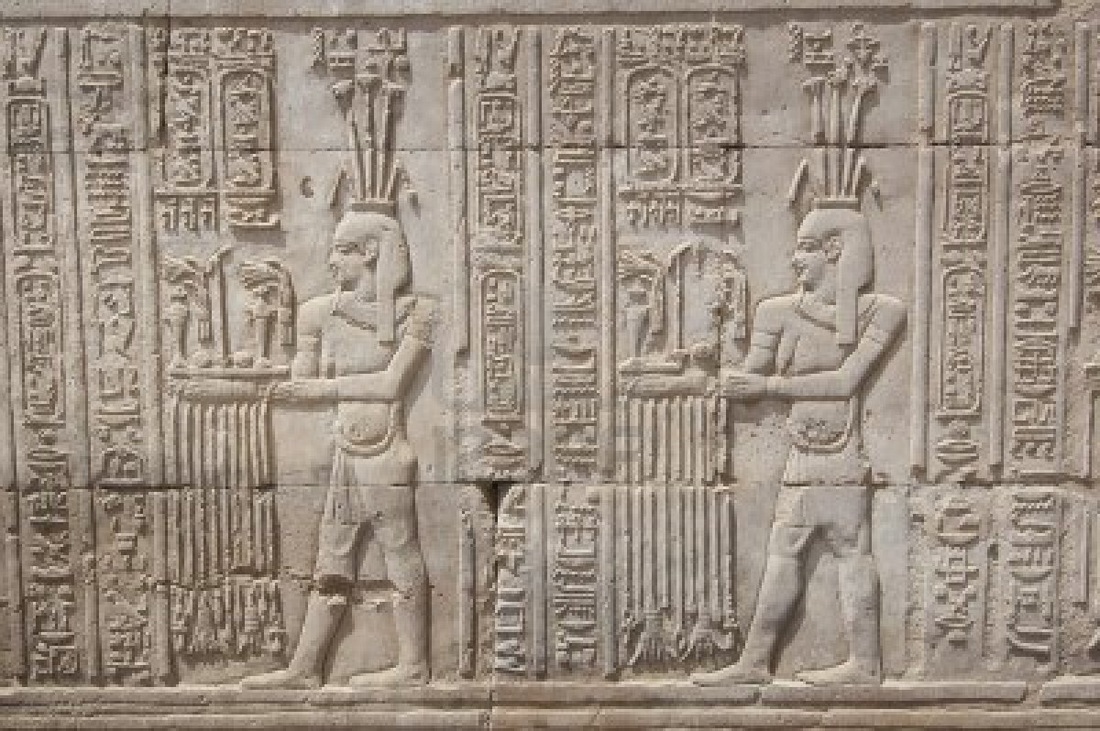
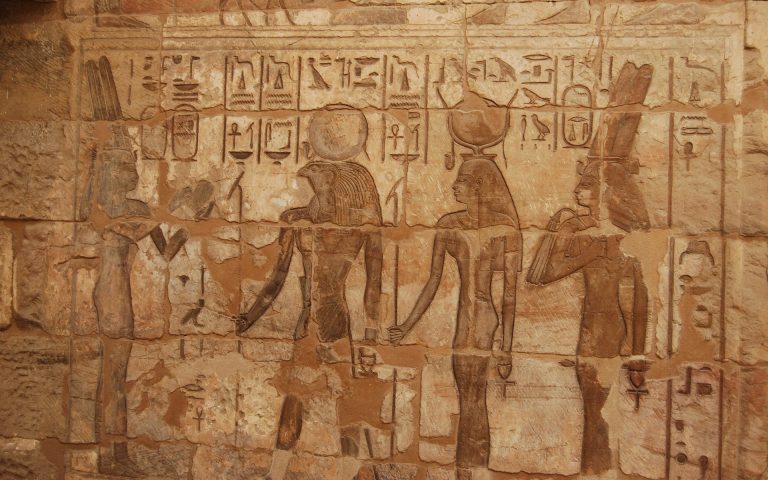
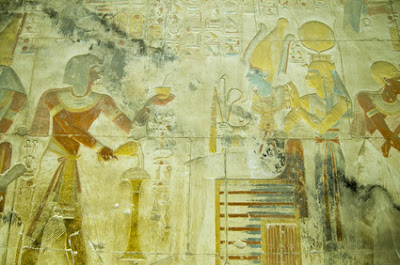
We just don’t call them “T” pillars elsewhere, because the “T”‘s have been replaced with anthromorphic figures with faces. Like Urfa Man in Turkey, they have the same blank faces, striking the same patient pose. They are the Moi in Easter Island, the pre-Incan gods of Meso-America, the Buddha of Asia, the Egyptian pantheon and the Annunaki. Similarities include a long, lantern-jawed head, ski-slope nose, no mouth, or only the suggestion of a mouth and often no feet, or legs. Heads appear wearing a boxy hat, headdress, or helmet.


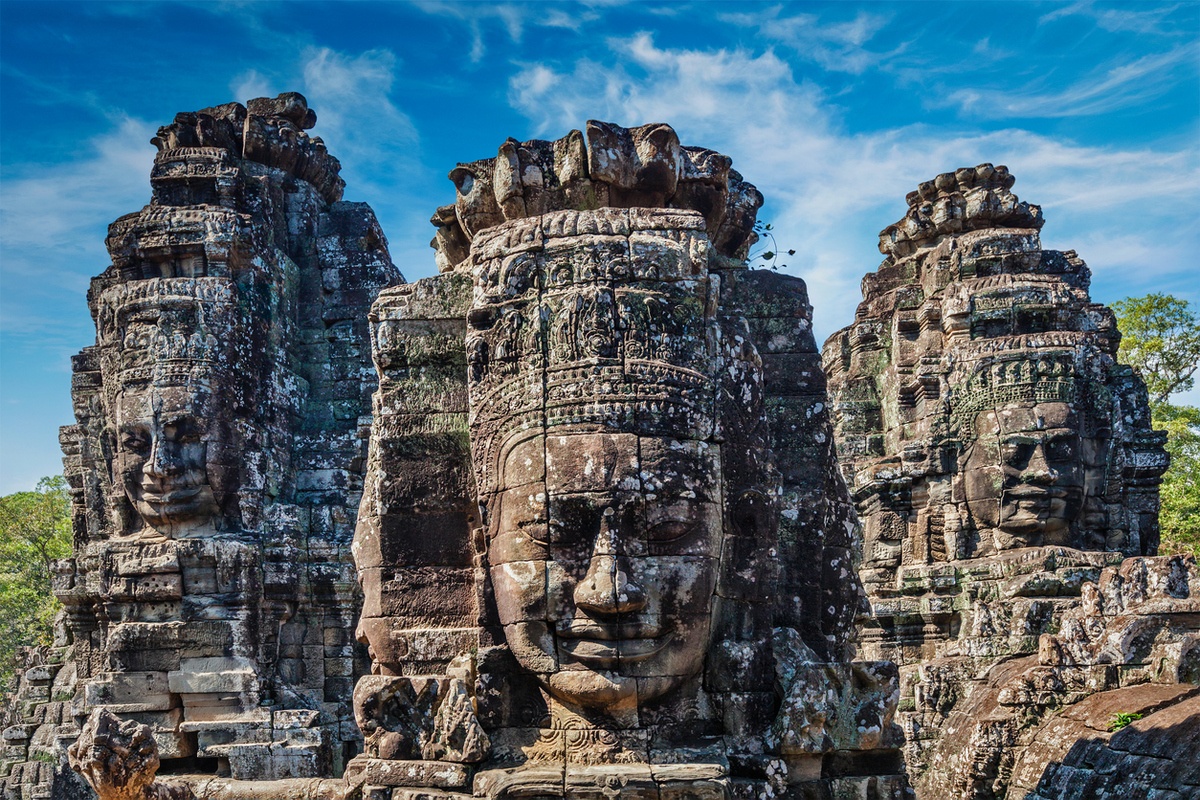
They simply evolved over time, from columnar structures with simple features, to elaborately featured anthropomorphism with faces, bodies, stories and personalities.


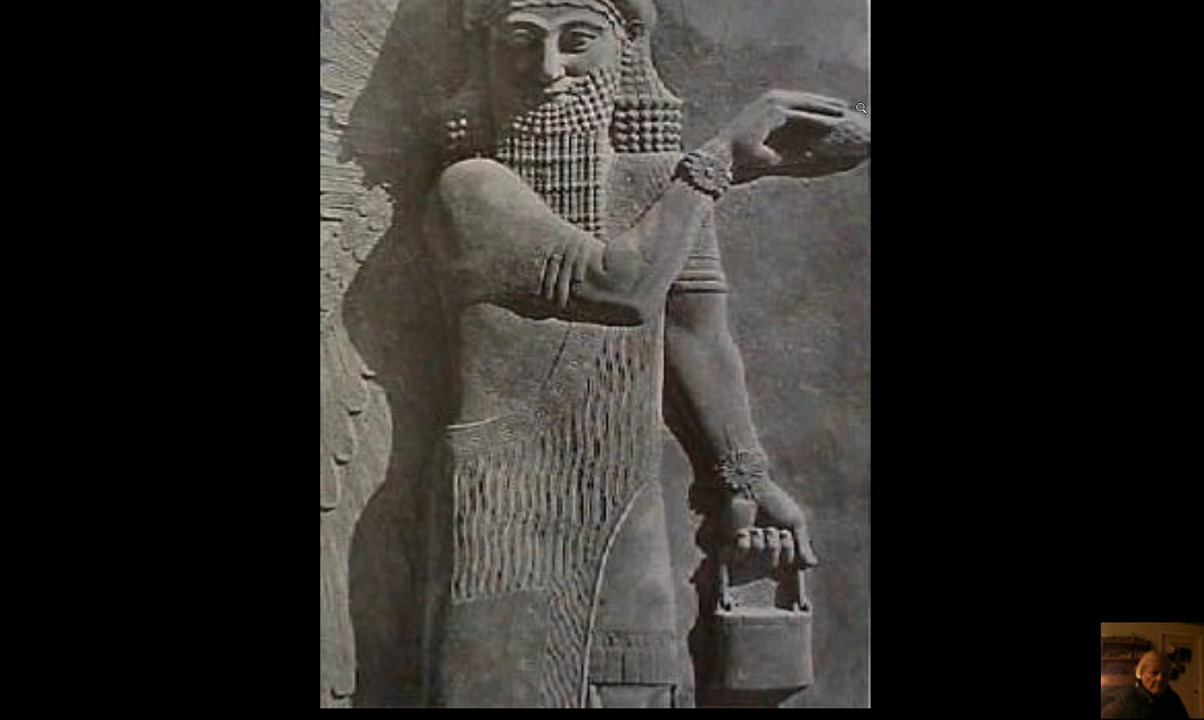
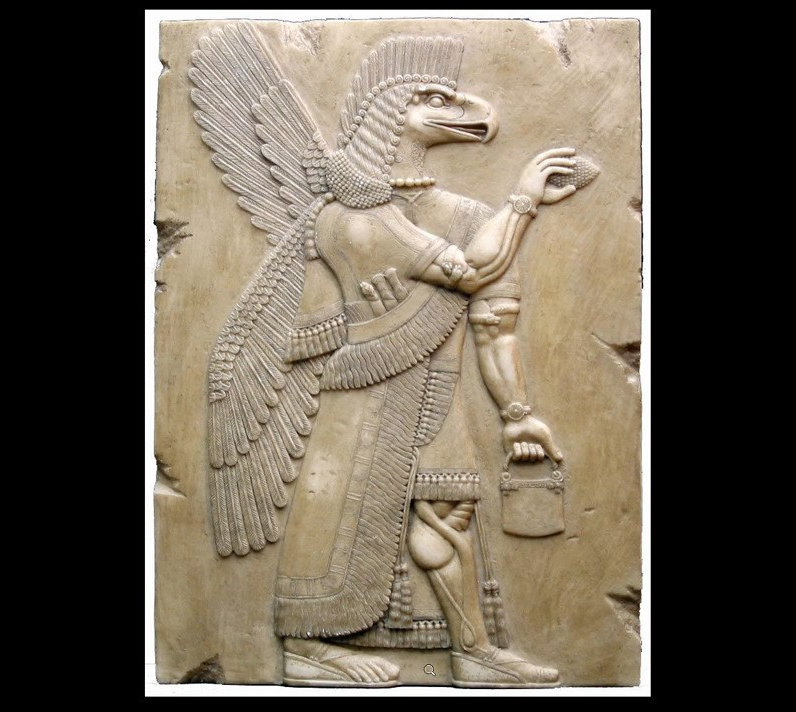
Even more compelling proof the “T” pillars are the archetype for subsequent gods are the goggle-eyed figures mixed with fish found in Australia and shown in Figure 25. You can see how the context of the fish morphs from individual fish, to goggle-eyed fish, to fish with human-like, goggle-eyed heads. Centuries later, fish gods appear among the Annunaki, holding handbags and stories of creation.

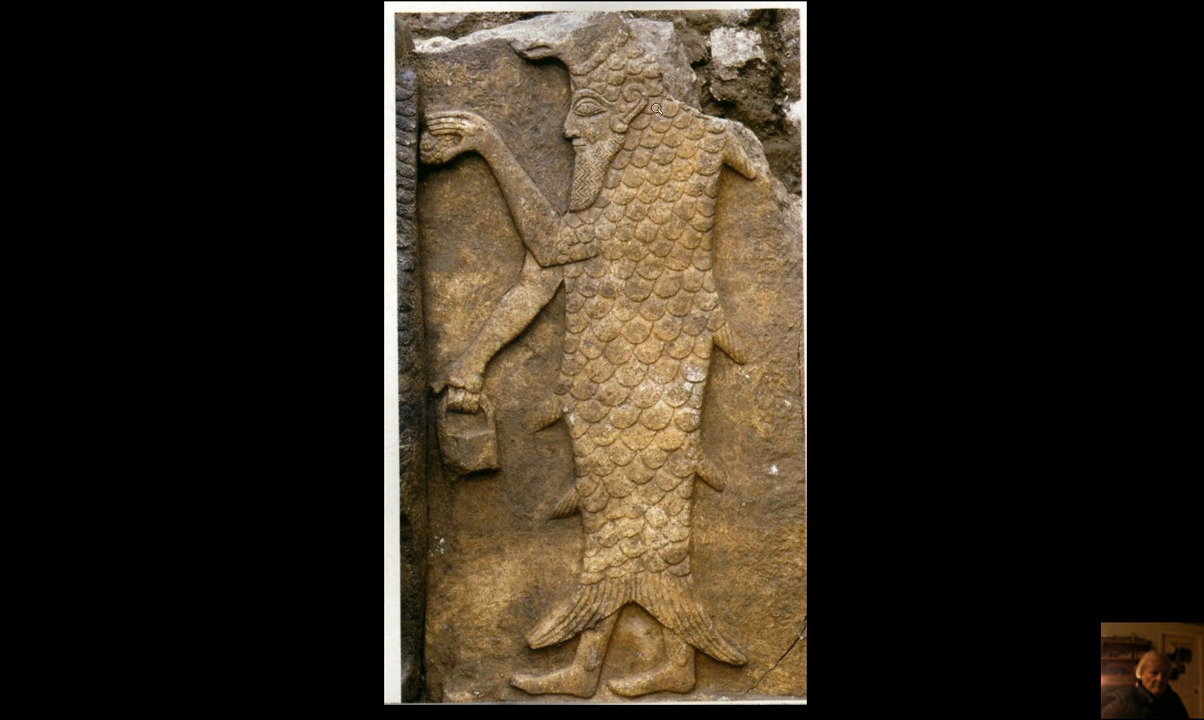


There is a simple, direct continuity of themes in the lineage of religions that links a space weather event to auroral lights, catastrophic climate change and shared emotional trauma. The Annunaki, Egyptian, Greek, Roman and every other pantheon of gods were fashioned on the “T” pillar, because ancient man saw electricity in the sky.
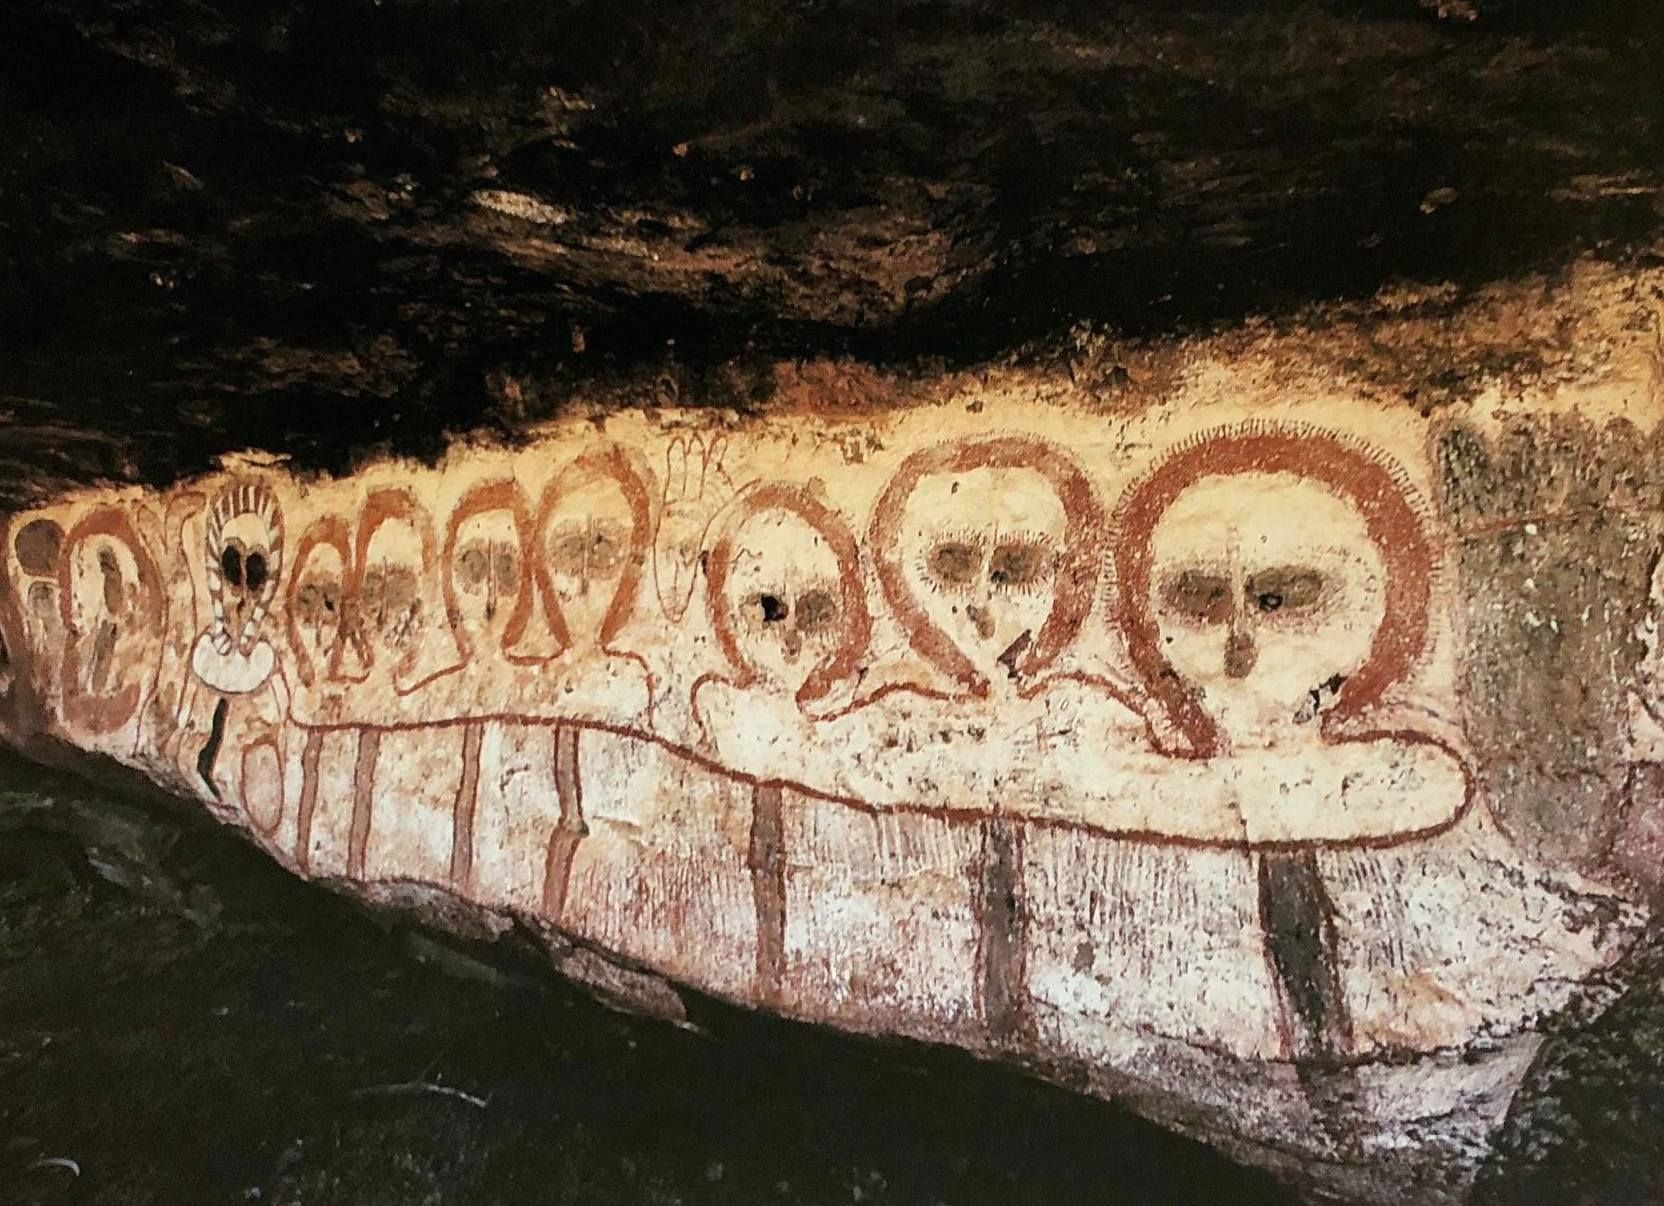
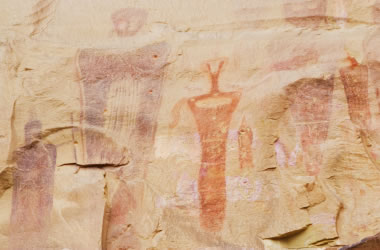
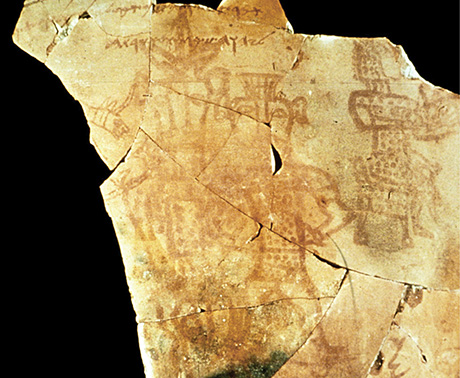
In Figure 26, the Kuntillet Ajrud inscription, discovered on pottery found buried in the Sinai desert and dated to the 9th century BC, portrays the Egyptian god Bess. Barrier style pictographs of unknown age found in Utah’s canyons depict the same goggle-eyed, jug-headed figures without the anthropomorphisms of arms, legs and other appendages.
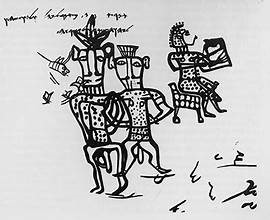
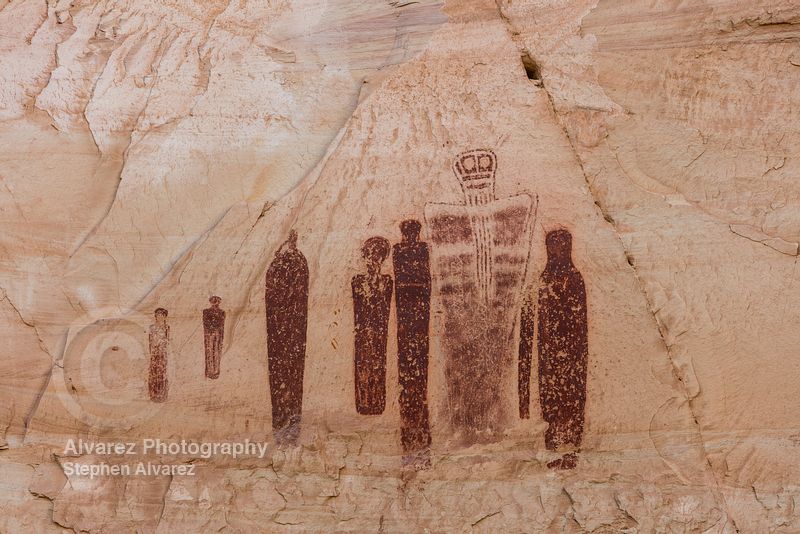
The Kuntillet Arjud artwork was originally inscribed with the names of Yaweh and a female diety named Ashera, before the images were added. There is controversy whether the images have any connection with Yaweh of the old testament. It is certain that the images represent gods of Egypt, however, linking the rock art, and therefore plasma aurora, to belief in gods.
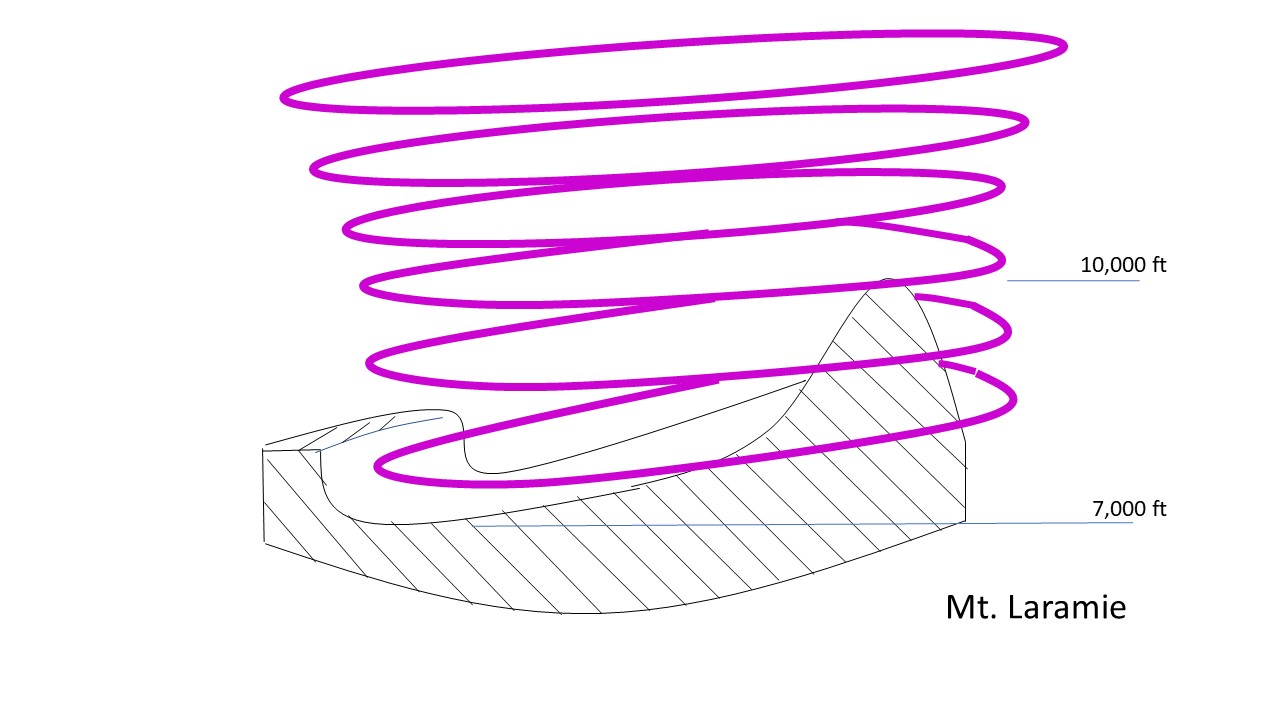
I contend the “T” pillars represent the “Elohim” of Genesis. They are what the myths are about – storm gods. They are the trauma for which we collectively suffer amnesia. Beings of light from the heavens beaming to mountaintops where lightning and thunder reigned. The notion that Man is made in God’s image is a result of ancient man seeing his image in the sky. What we call “squatterman” today, and imagery like the Barrier Style rock art of Utah, were the creator gods of yore.
I also contend it was people turning away from this pagan pantheon to acknowledge the one true God of the cosmos that began monotheism. A more sophisticated understanding that energy lit the cosmos, and the storm gods were just light fixtures, had to appeal to those who stopped to think. Perhaps that is why so many statues of these storm gods are found headless and why sites like Gobekli Tepe were intentionally buried. They were deemed to be false gods, and rightfully so. They were just lights in the sky and bad weather.
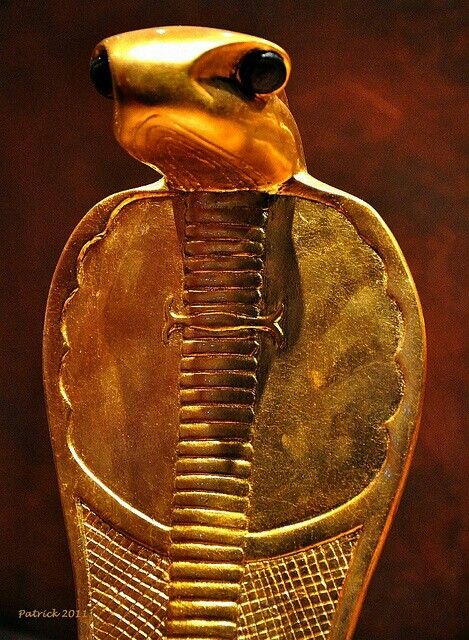
What makes this relevant today is the new/old narrative that Annunaki and other mythological characters were reptilian visitors from another star system who seeded human life on Earth. People are being led into a revival of this ancient pantheon to fill the knowledge void left by the failures of academic science. It’s similar to the “flat earth” phenomena, where a malicious psi-op attempts to gain traction with vulnerable people who just want answers. There was an ancient alien energy that caused plenty of aerial phenomena, but no little green men were involved – at least not with respect to the Annunaki. The Annunaki, like the “T” pillars, represent a ‘Category 5’ space storm and the resultant chaos on Earth.
Also, a course correction is needed for the new-age “catastrophists” who believe an impact is the only possible way Earth’s climate could have been disrupted so severely, so quickly. Not that a meteor, or comet isn’t a possibility. In fact, that is exactly what Emmanuel Velikovsky originally presented in “Worlds in Collision” and the concepts that gave rise to the Electric Universe. A cometary visitor of sufficient size could have caused all of the magnetic field effects recorded in the petroglyphs. However, not by impact, or even airburst.
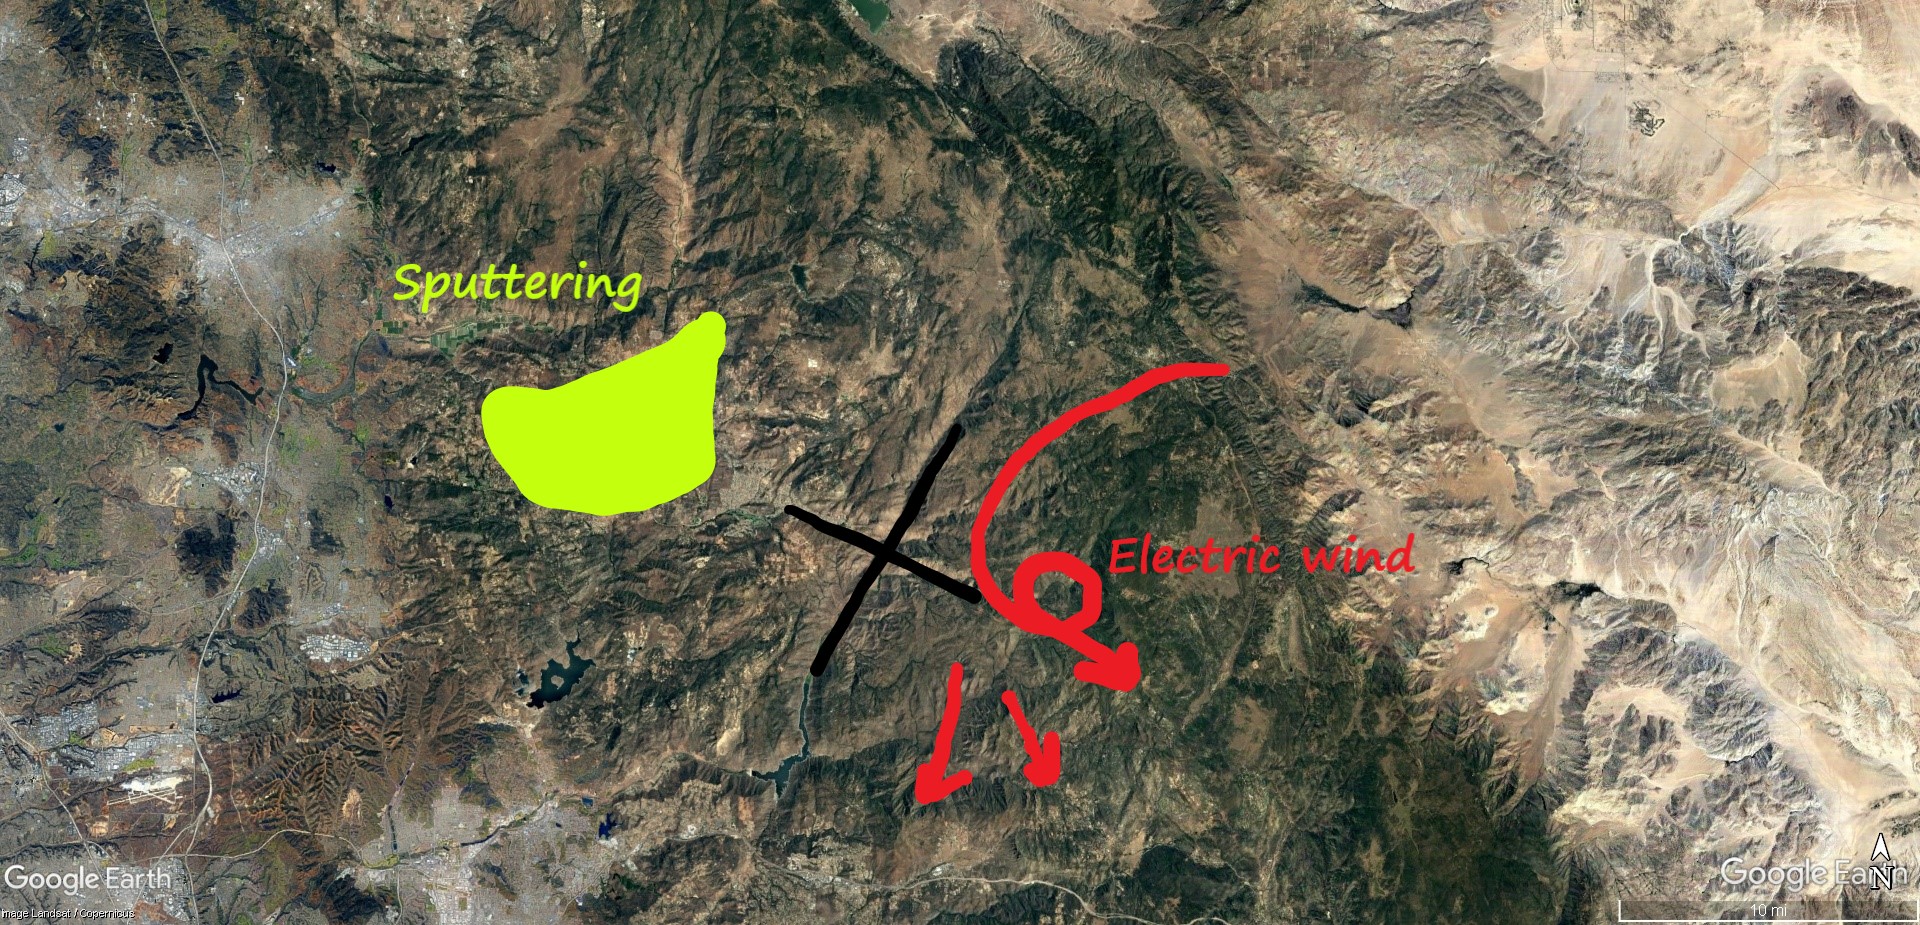
Simply coming close was enough. Differential potential between Earth and a large invading body would generate an electrical wind to amp the magnetic field. So, it could have been a comet, or the Sun, or another planet. It could even have been the Moon, or the Earth itself adjusting it’s orbit.
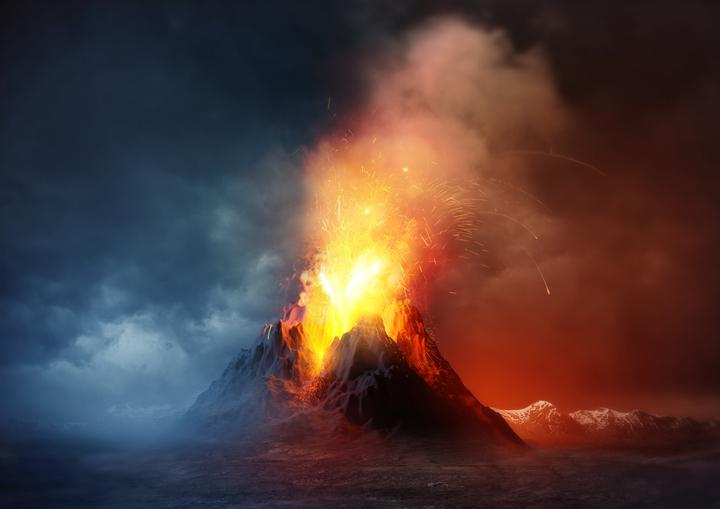
Whatever the cause, it generated plasma storms. They were long lasting and probably recurring. They shook the Earth and erupted the guts out of it, while cyclones formed at the feet of giant columns of auroral light. We know this because the storms are also recorded.
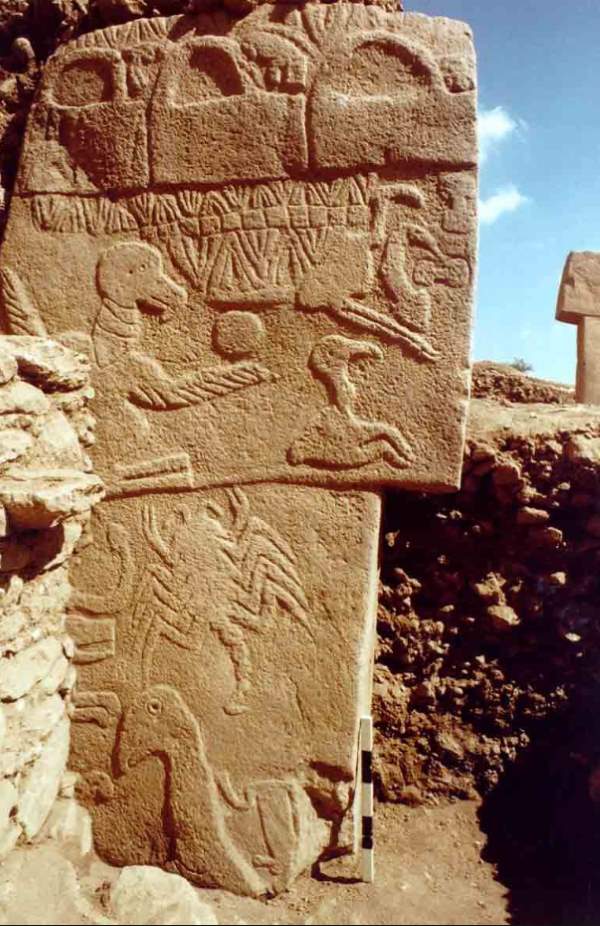
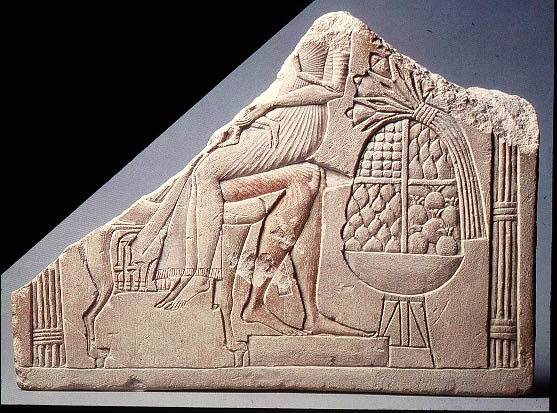
The famous “Vulture Stone” at Gobekli Tepe tells this part of the story. The handbags represent the storm clouds. I’ll refer to “Handbag of the Gods” where I decode the Vulture Stone.
Nature is circuitry. Our bodies work on circuitry. So does every plant and animal on Earth. Inside Earth is circuitry generating a magnetic field that reaches to the Moon and makes a bubble of circuitry so powerful it lights the polar skies. The Earth’s electric bubble lives inside the Sun’s electric bubble, called the heliosphere, making circuitry between Earth and Sun.
Nested spheres of circuitry repeat at the galactic and cosmic scales. Repeating forms in Nature is the rule, not the exception, because it’s all made of circuitry. Everything is electric.

So, what do you think, Dan. Are you beginning to see, with electric eyes and your electrician background, how things are wired?
Cheers,


_LI")
_LI")