Holographic Universe is a term often used in connection with Electric Universe. Why is that and what does it actually mean?
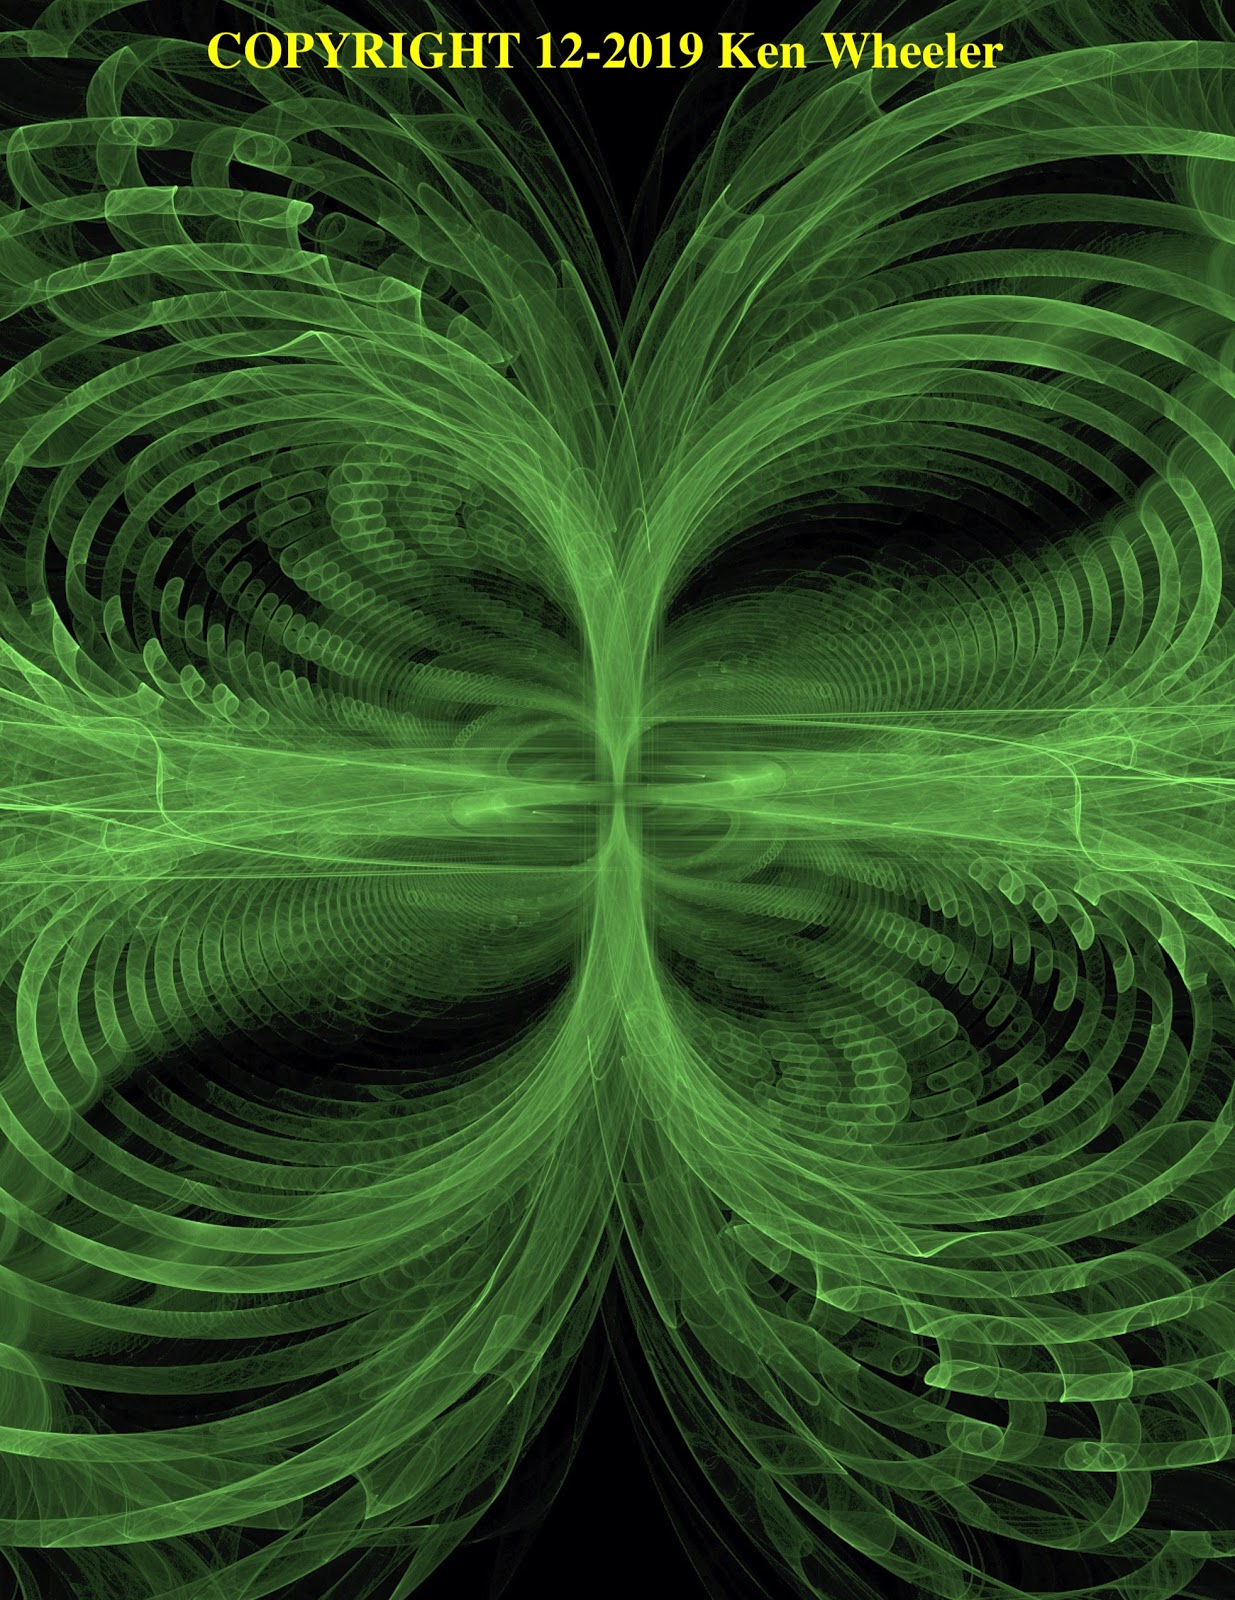
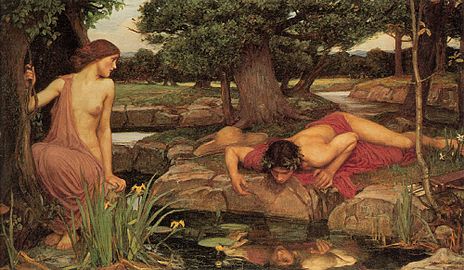
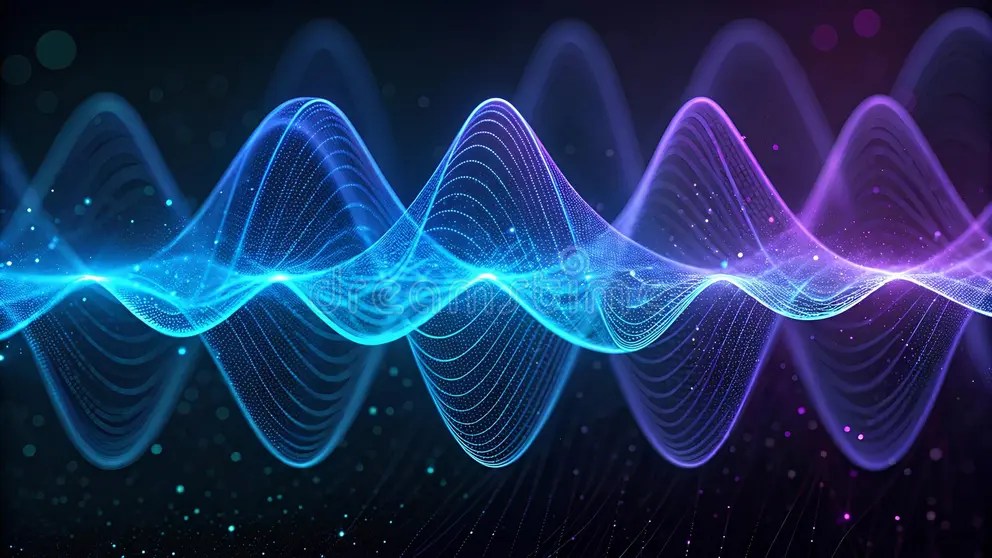
Echo the words of Nikola Tesla: “Energy, Frequency and Vibration“. They are the fundamental aspects of a Holographic Universe, because a hologram is an interference pattern of energy, frequency and vibration. Vibration is its motion, frequency is its measure and energy is its cause. It is a trinity of oneness, because these are all aspects of one thing: Energy. A Holographic Universe is one made of Energy.
Energy is a trinity of oneness in that it is information, cause and intent. Coherent information is the substance of awareness and it’s found in its irreducible form in the geometry of the waveform. Energy is the irreducible cause from which everything else is an effect. Causation and probability is from potential energy held in the waveform. And intent is the vector and frequency of the waveform and it’s resultant effect, which is either constructive, or destructive to the waveforms around it.
Energy is a trinity of oneness because it is the substance of space, time and matter. In a one word description, the Universe can’t be a bubble of space, or time, or matter, or even space-time, for that matter. It is a bubble of energy. That is the only description that makes physical, or logical sense.
Matter is potential energy isolated by it’s frequency. Time is the tempo of change in the collective bandwidth of frequencies. Space measures the amplitude of vibration that holds everything apart, because waveforms fill every corner of the Universe.
Energy can not be created, or destroyed. Energy is eternal. It is self-organizing and self-contained by circuitry of its own design.
Matter is a consequence of energy. Space is a consequence of energy. Information is a consequence of energy. Time is a consequence of energy. Gravity is a consequence of energy. Electromagnetism is a consequence of energy. Biology is a consequence of energy. Consciousness is a consequence of energy.
Particles are bubbles of energy. The Universe is a bubble of energy. One cannot conceive of anything without energy. Without energy, the lights go out and there is nothing to talk about and no way to talk with no one to talk to. You cannot have an anthropic principle, a deterministic principle, a Big Bang theory, gods, or any other philosophical navel-gazing without energy. The entire cosmos is a consequence of this one, multi-faceted thing. Energy is the common denominator of all things known and unknown; natural, and supernatural.
Like Dr. Bronner says on the soap bottle: “Eternally one! ALL-ONE! ALL-ONE!” – that “ONE” thing is energy.
So, how do we experience this holographic cosmos? Can it be felt? Can it be measured? Can it be seen?
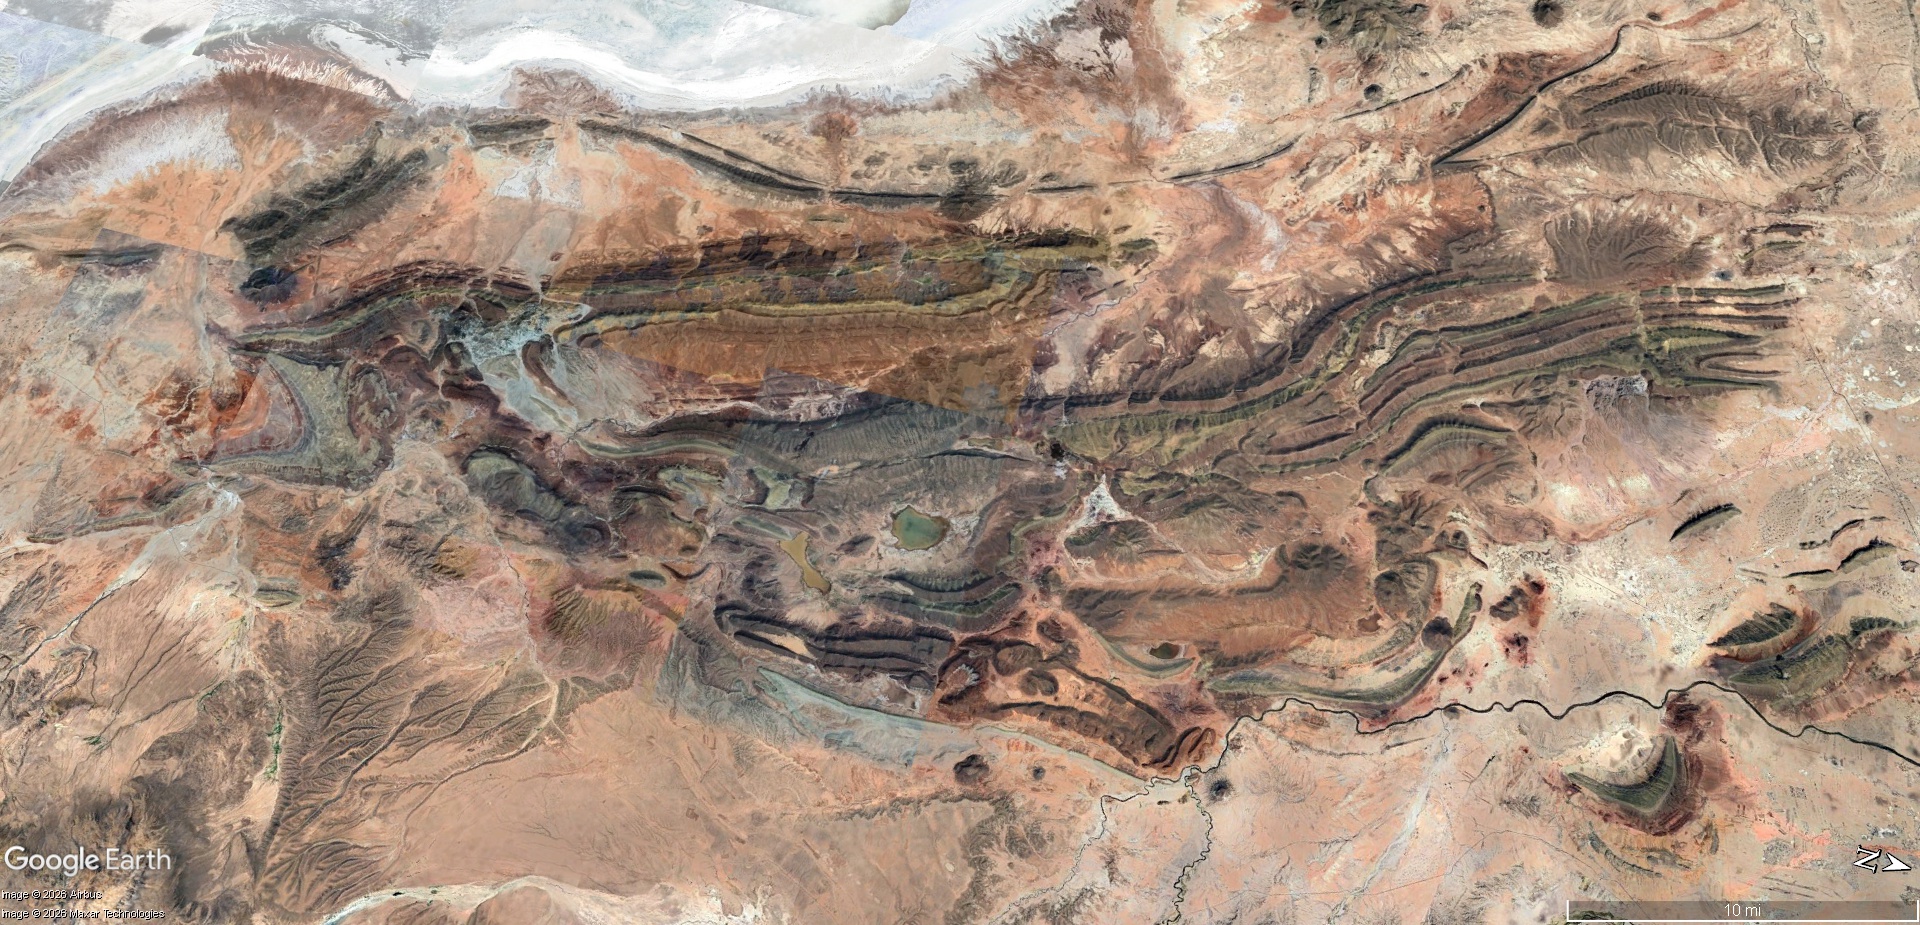
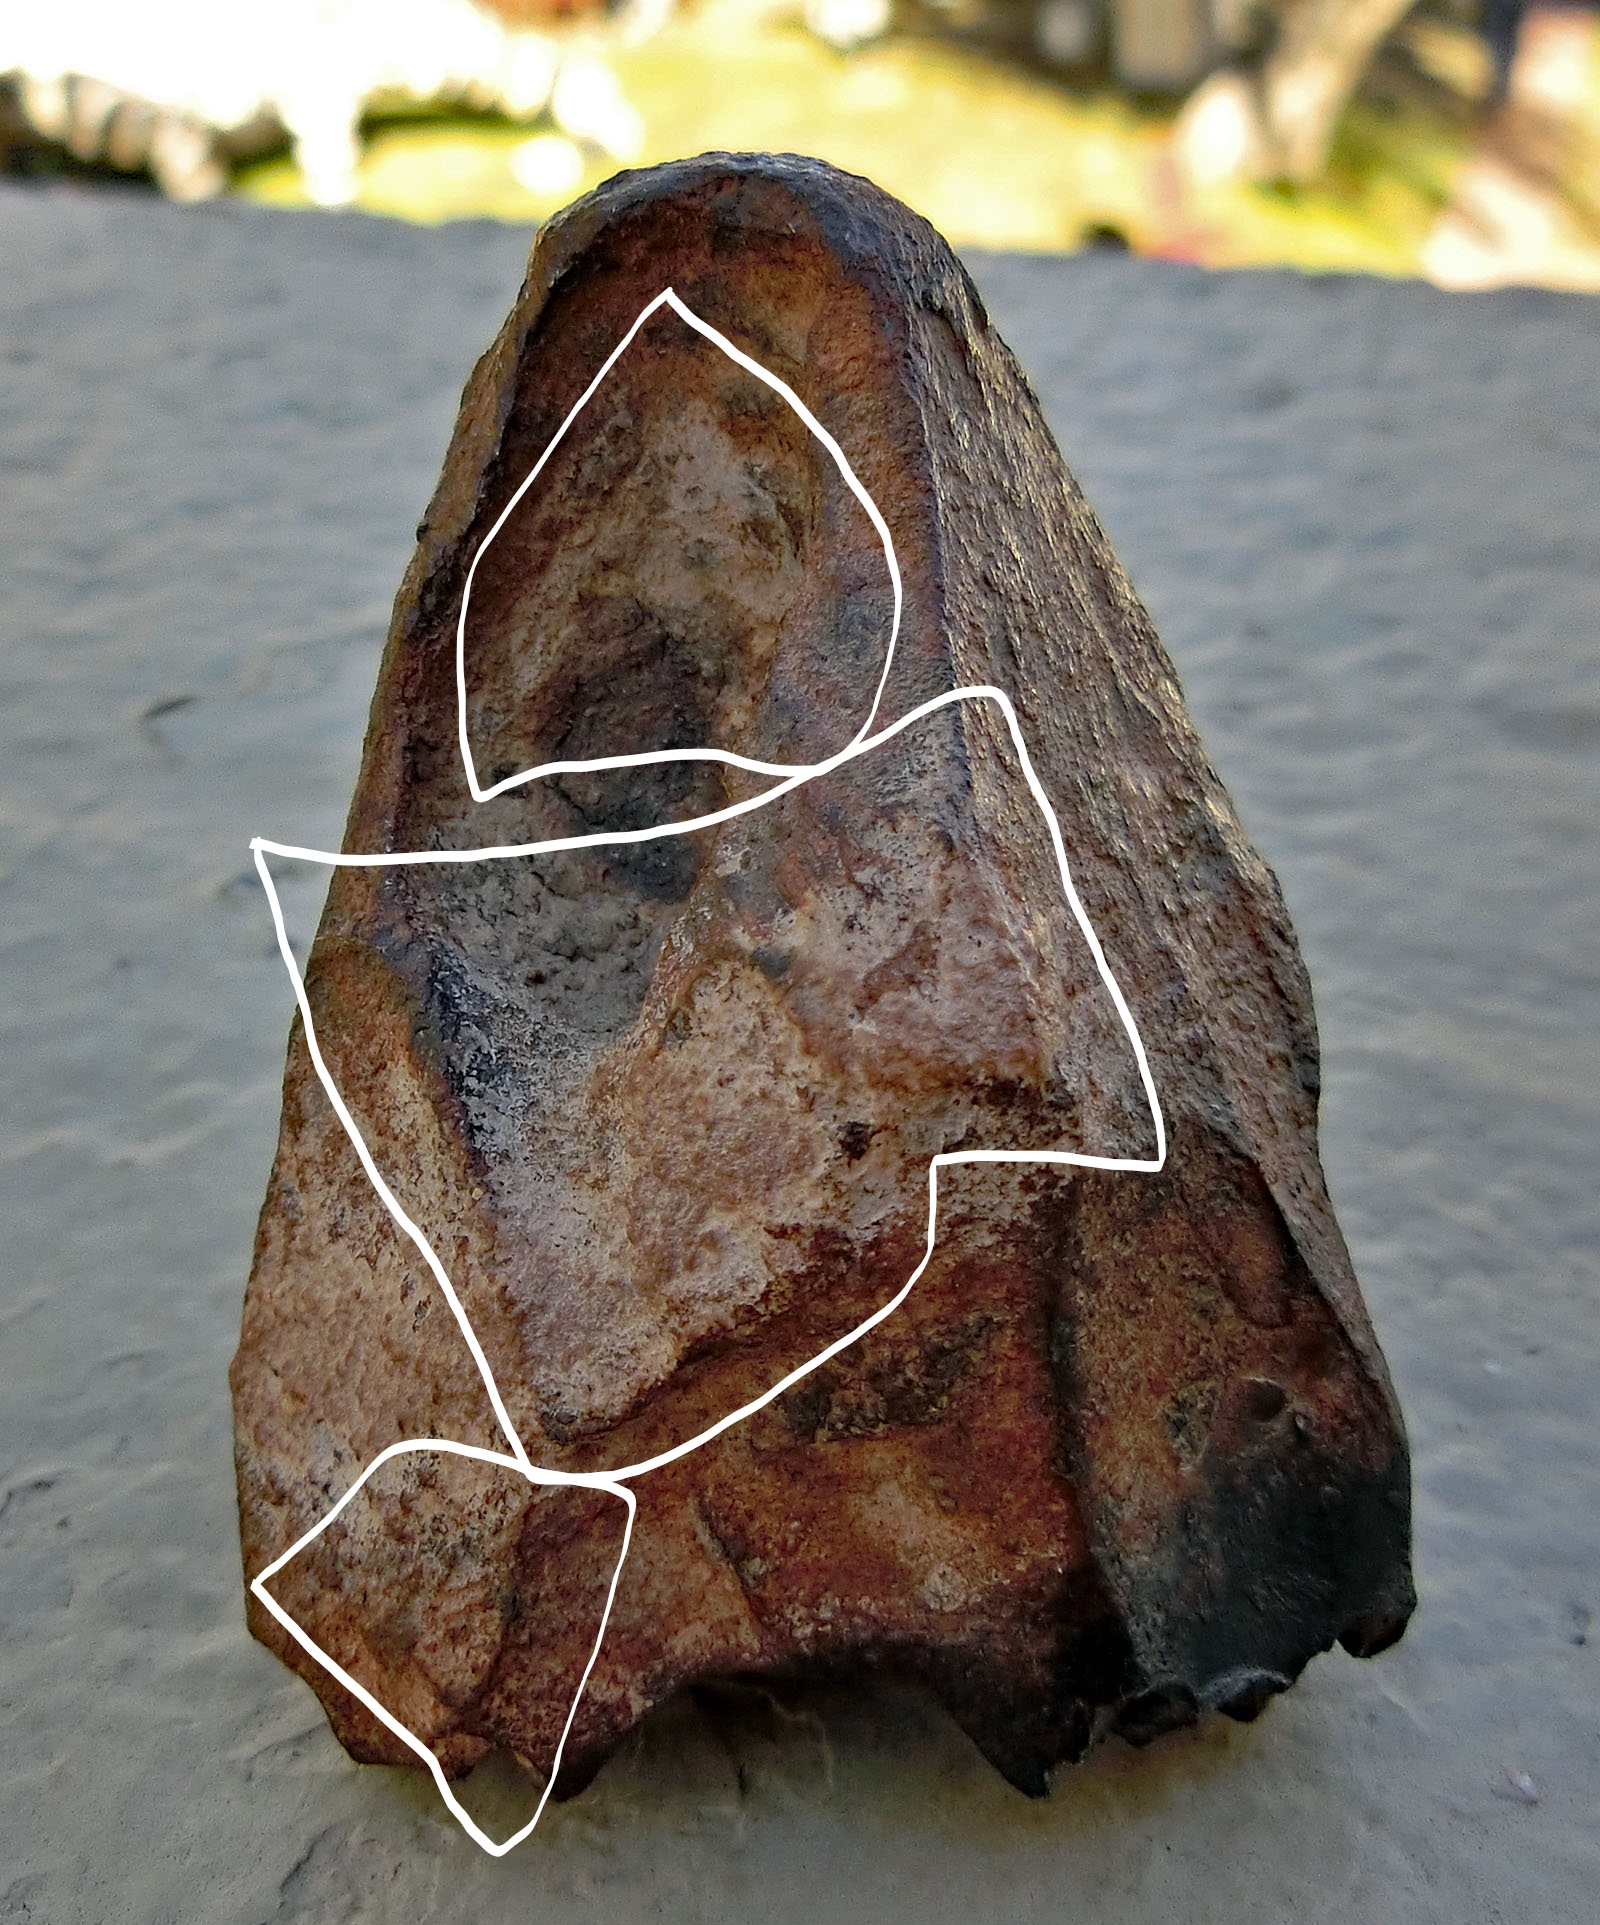
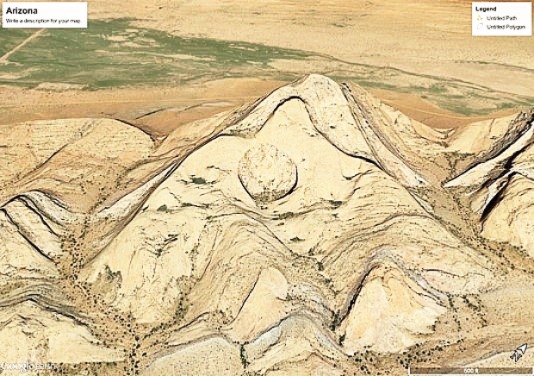
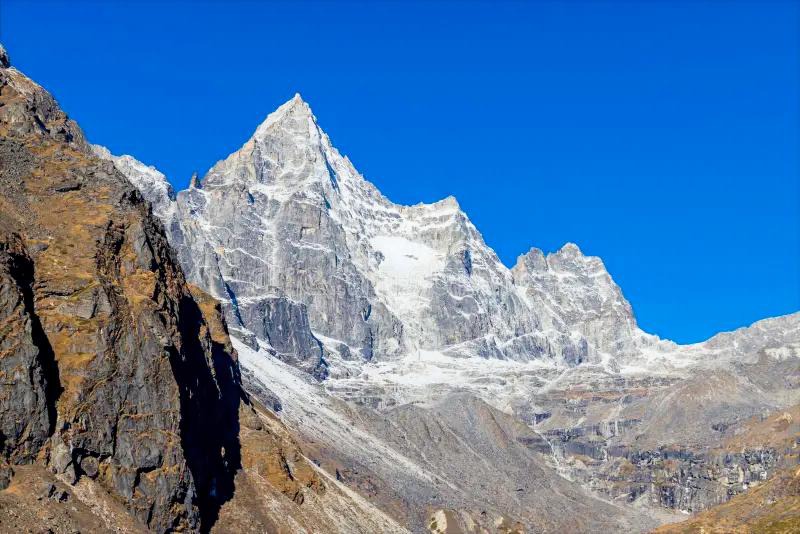
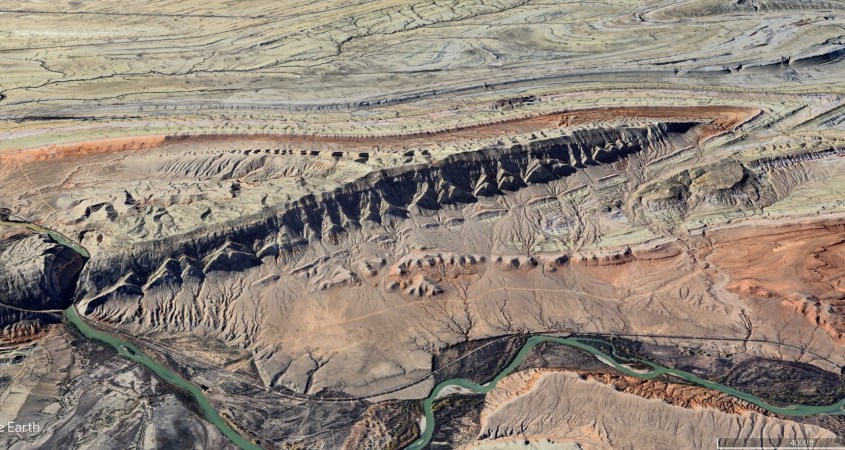
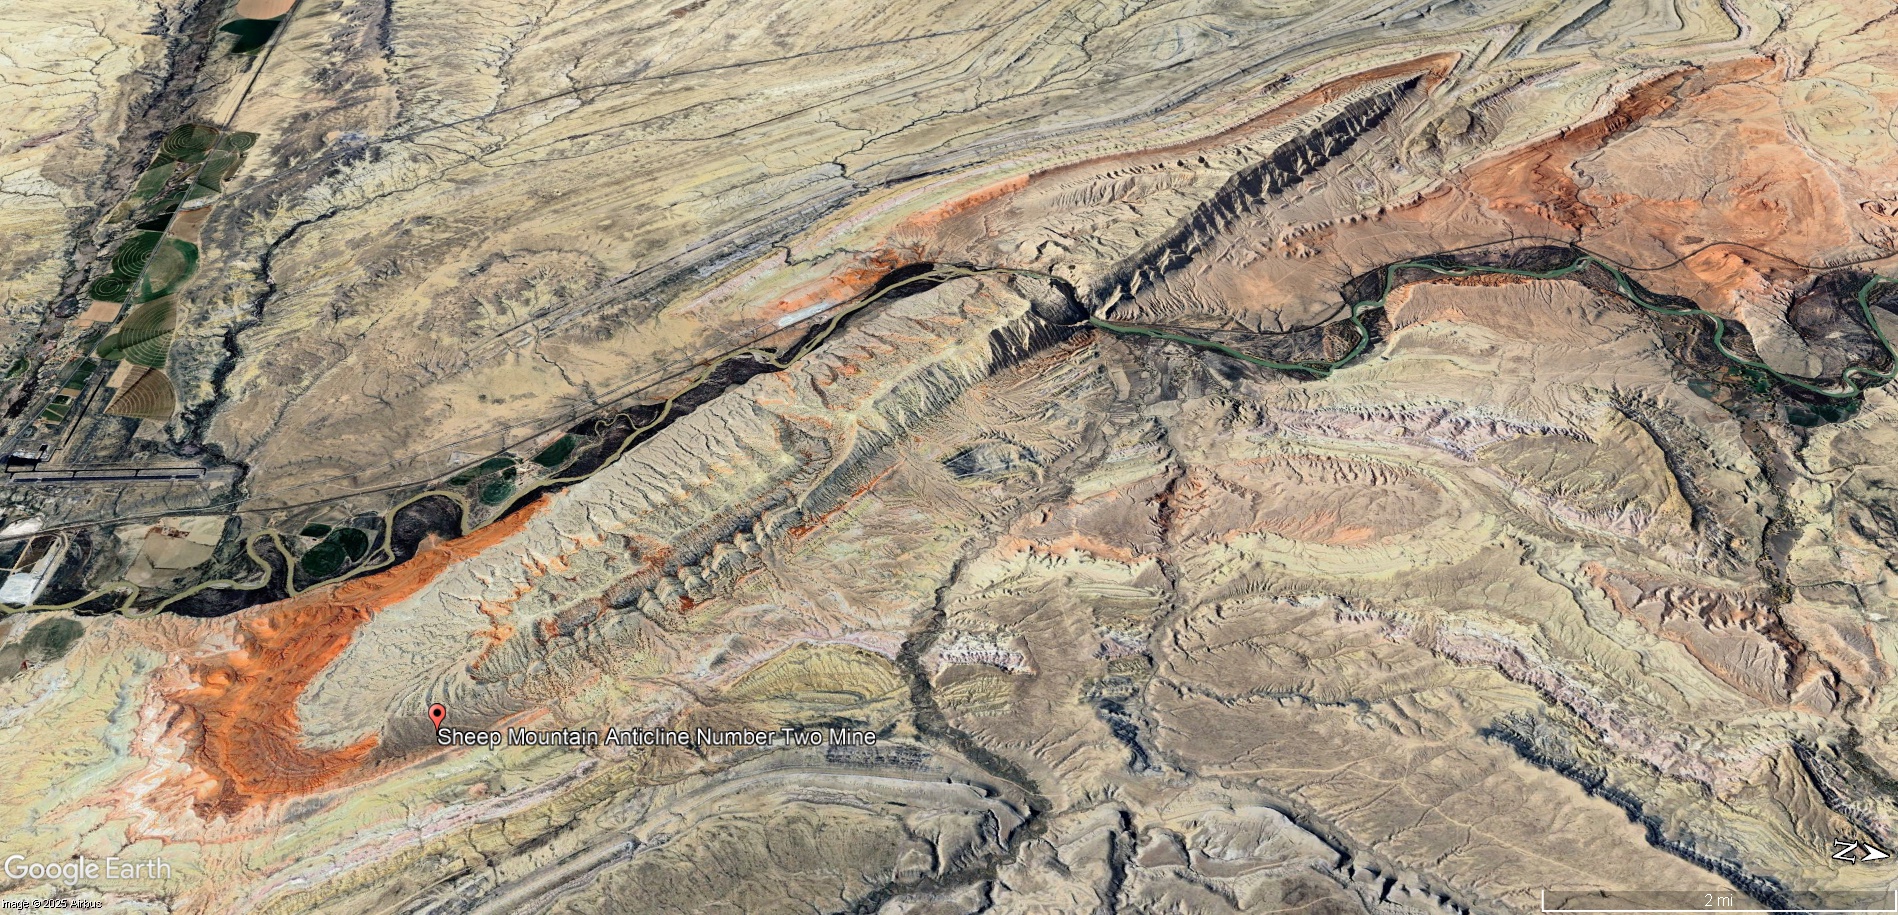
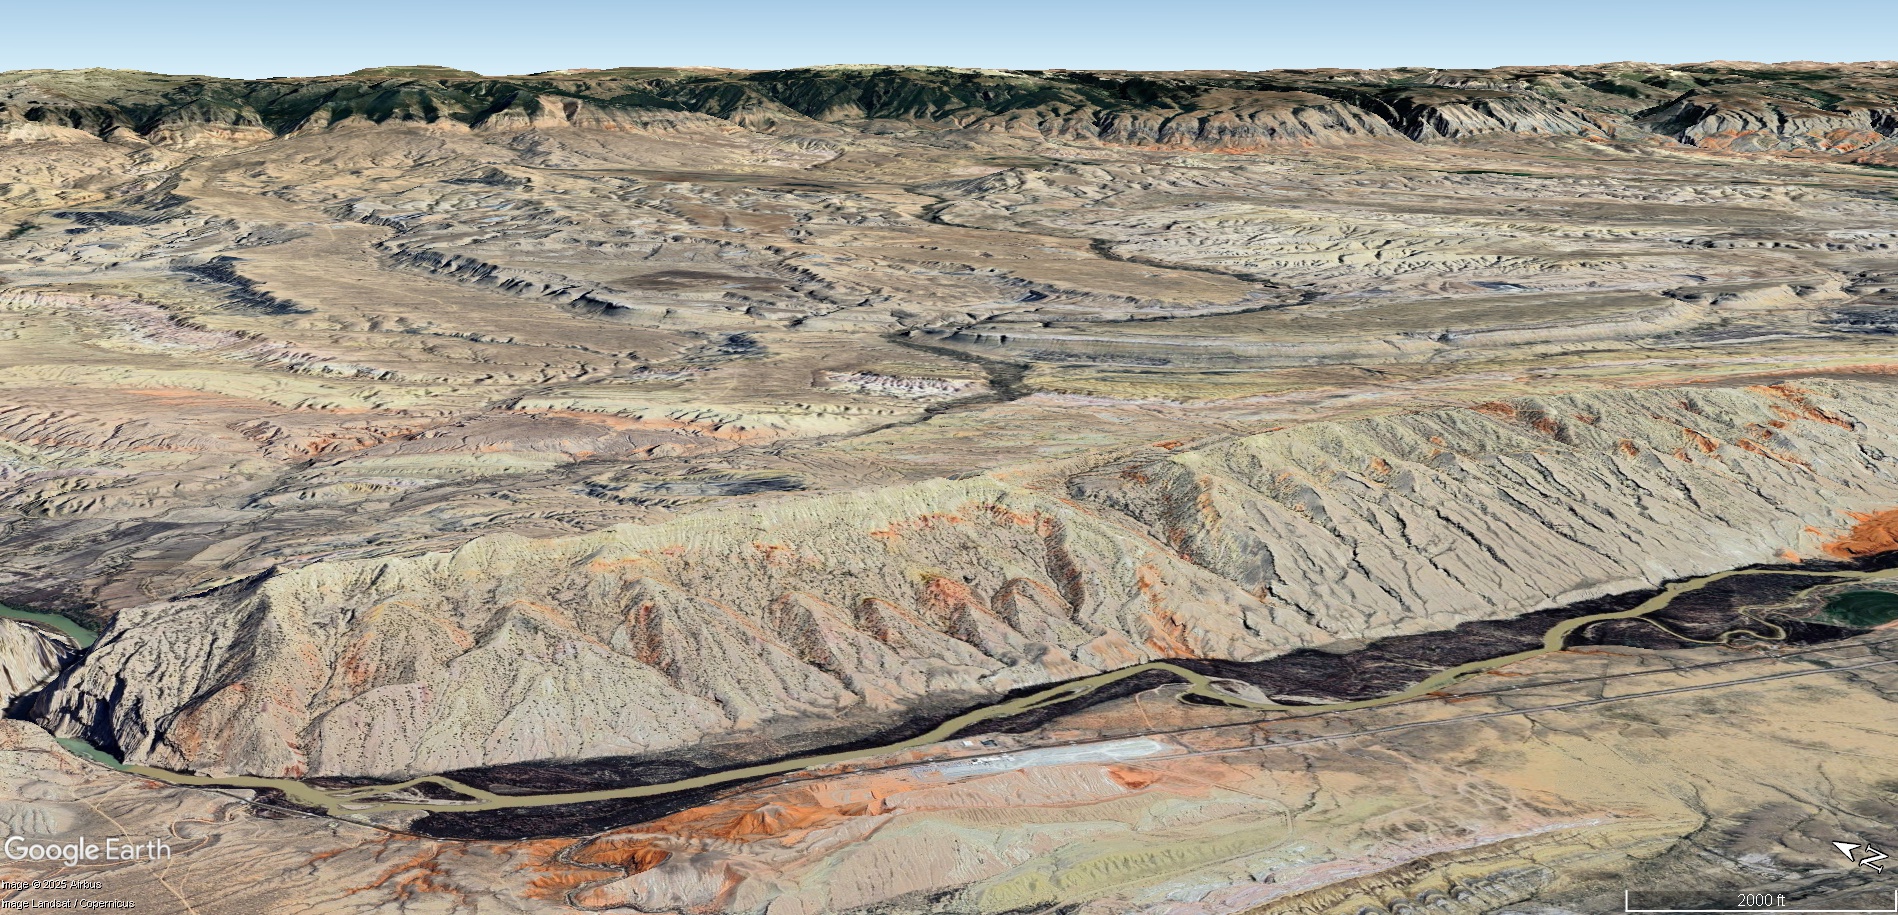
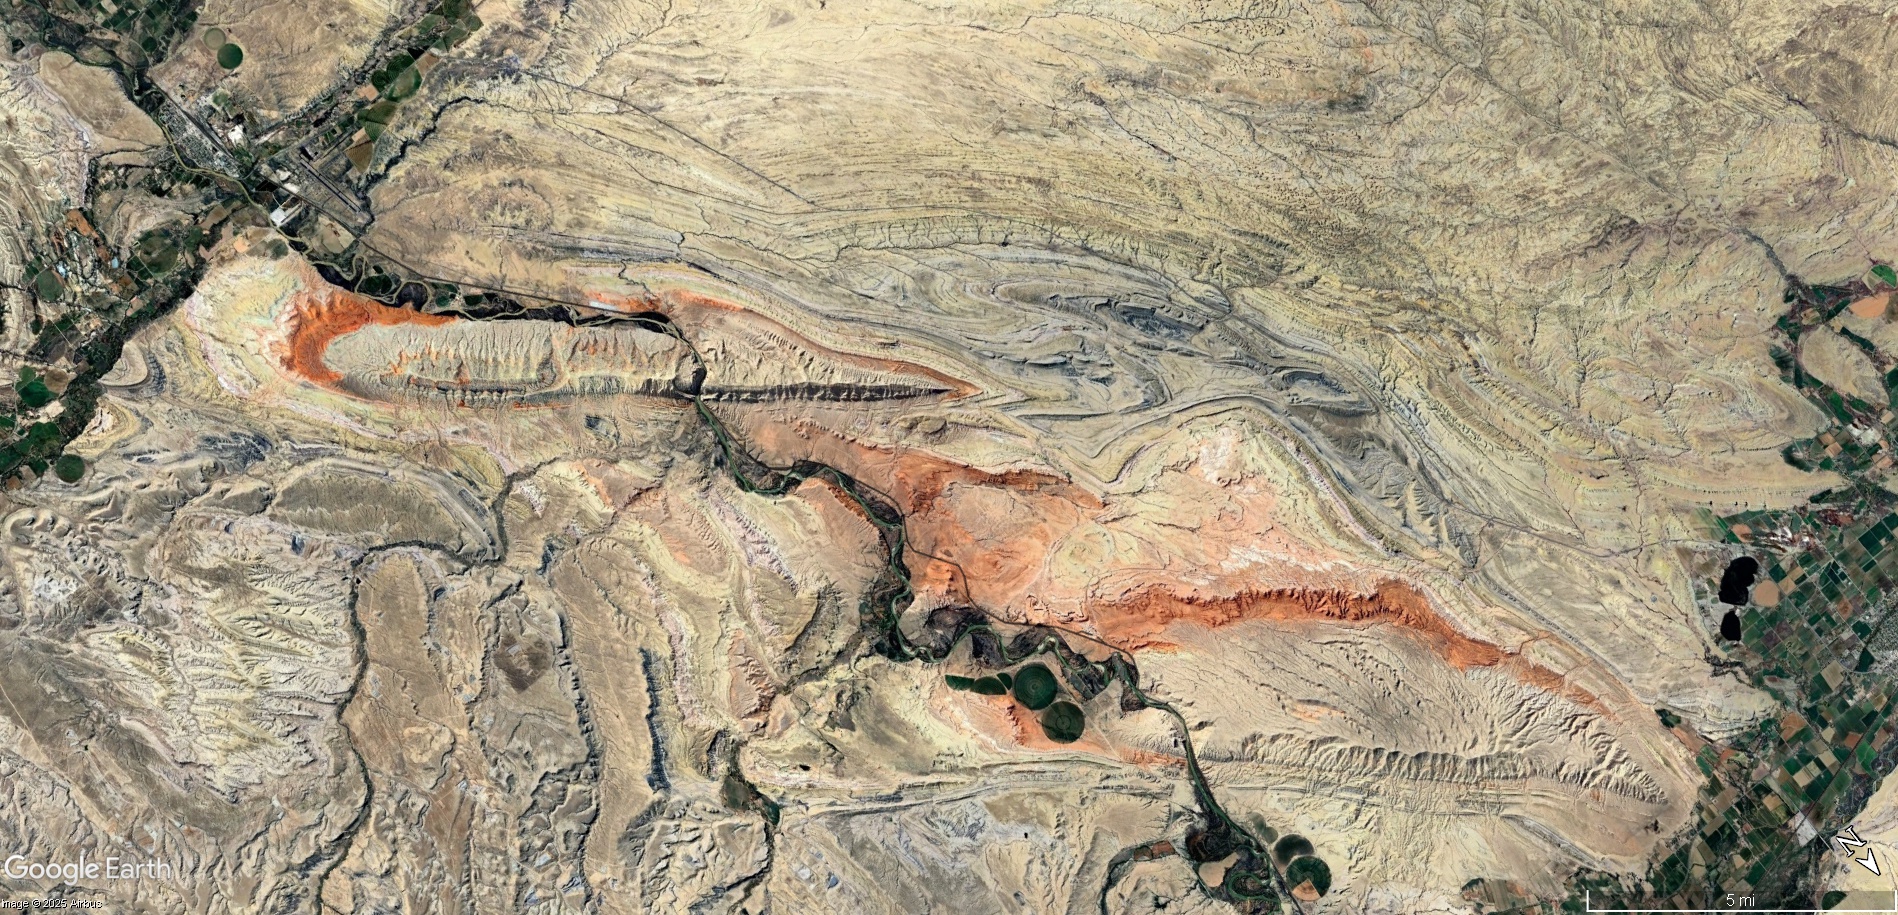
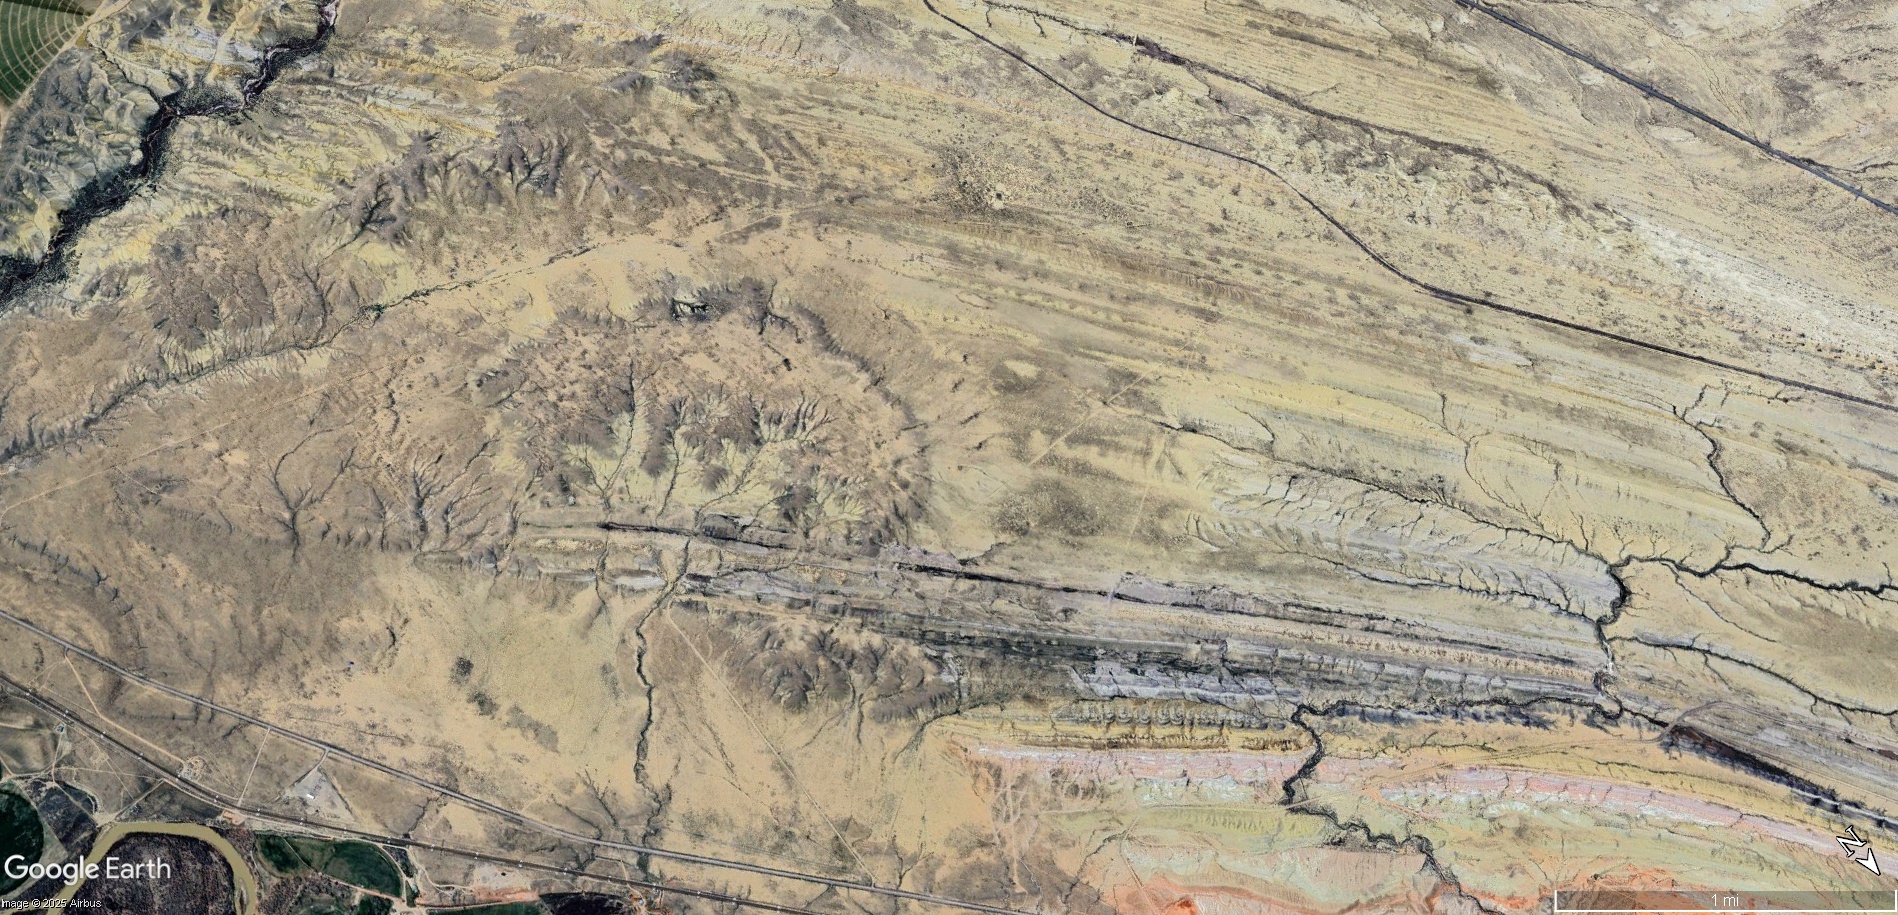
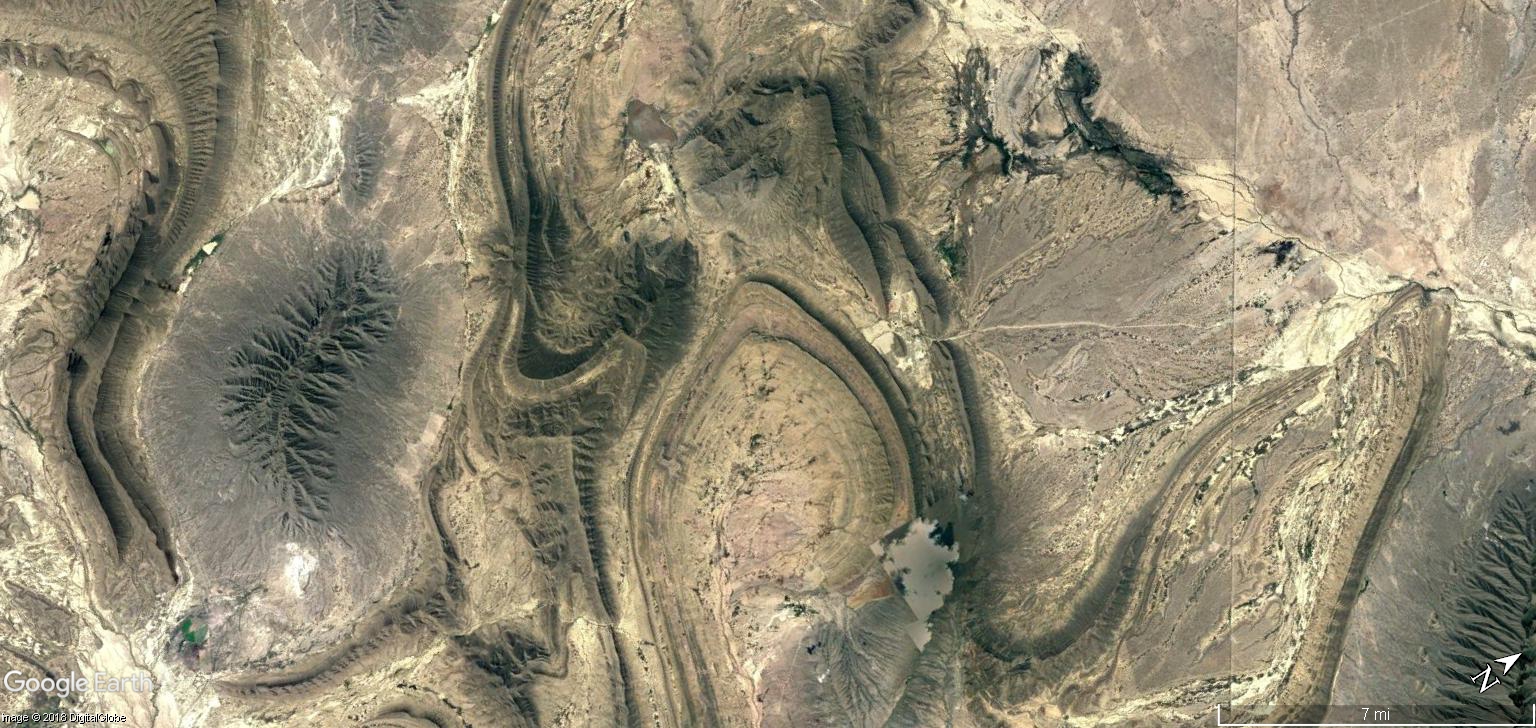
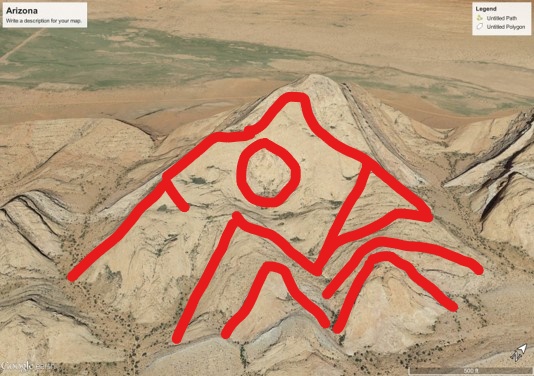
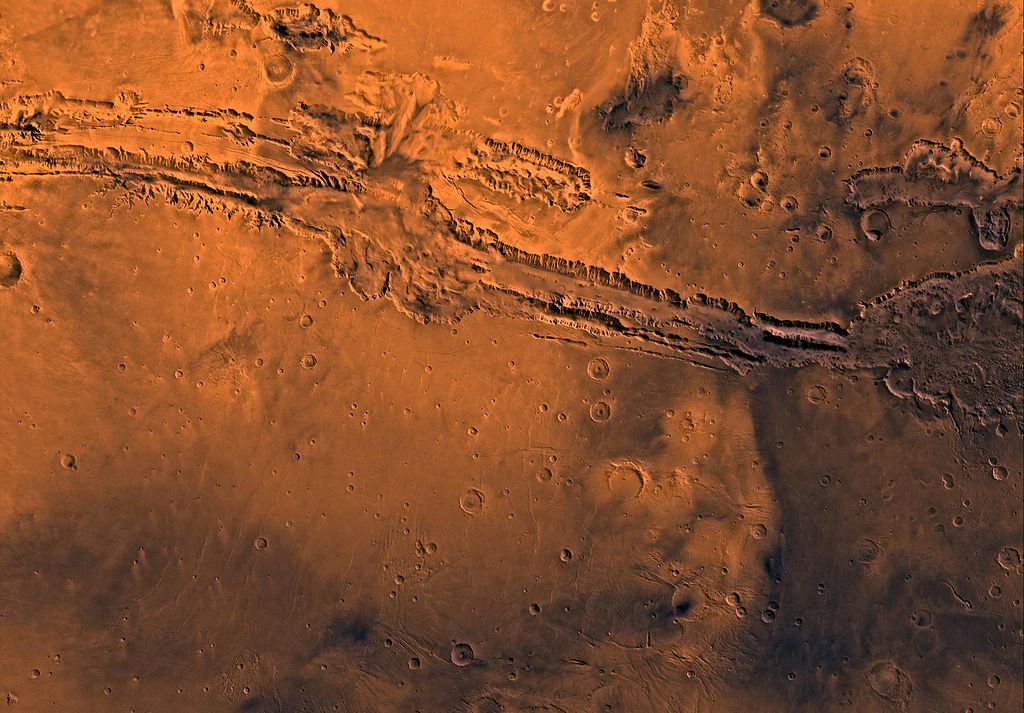
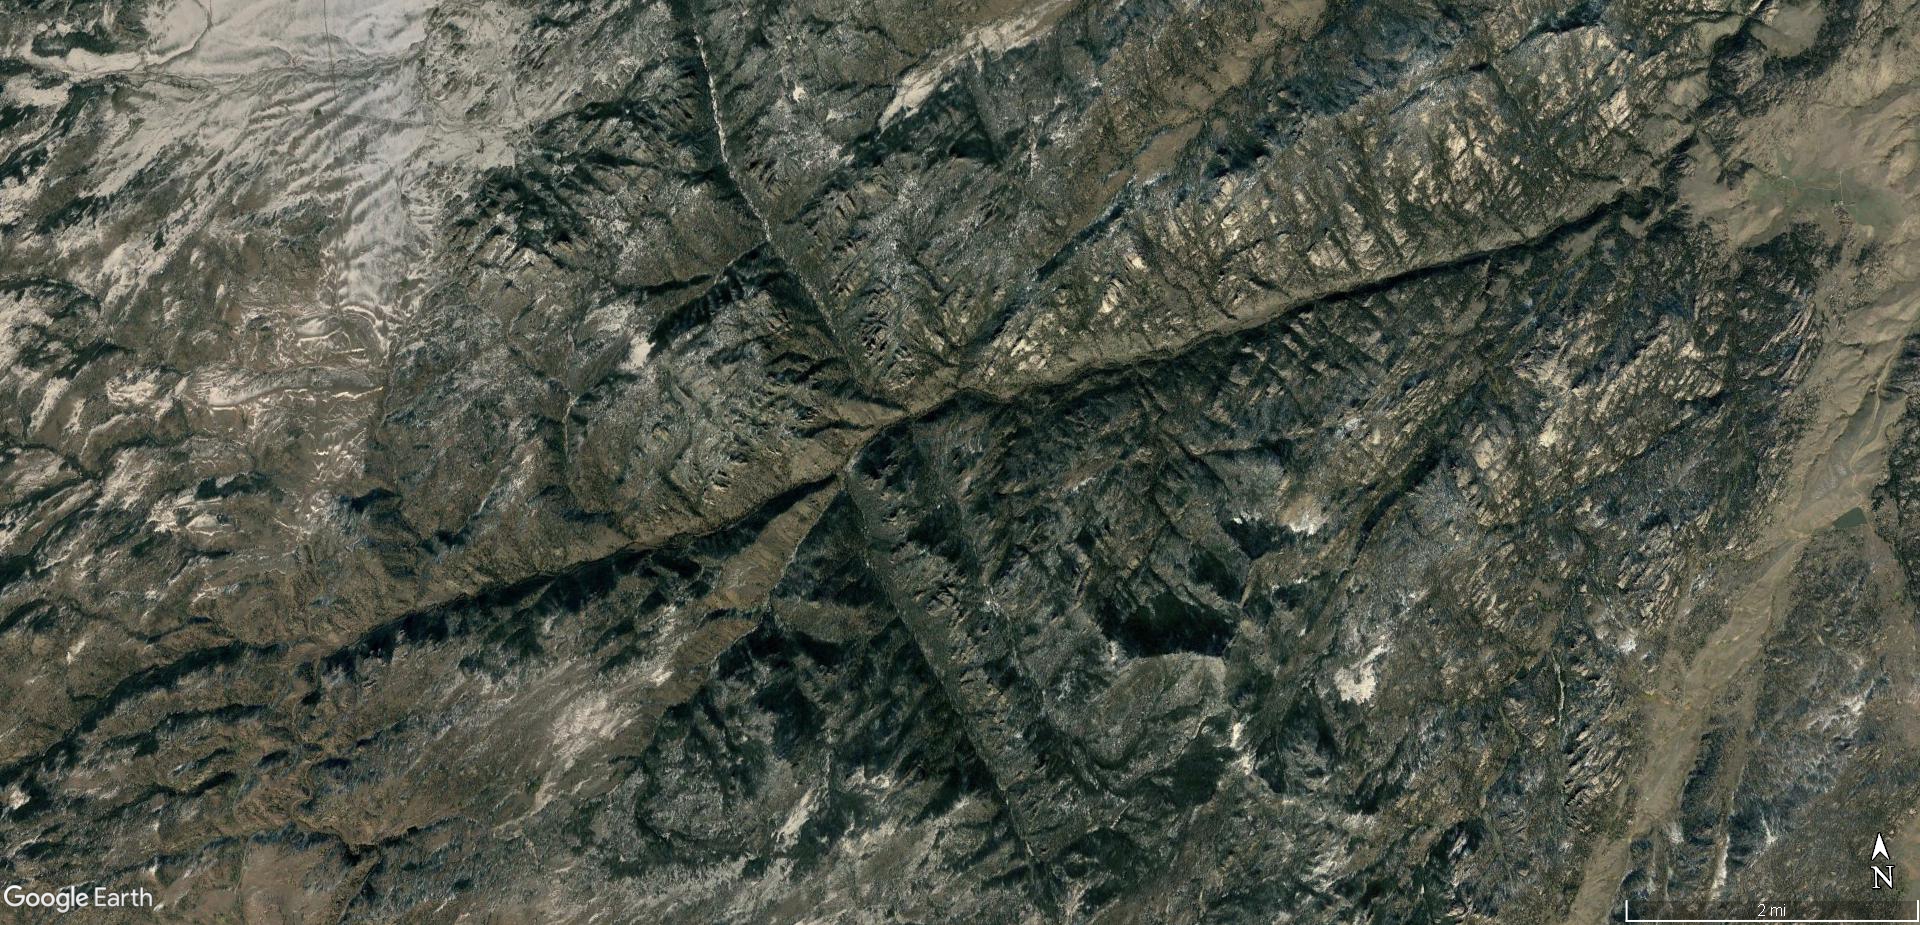
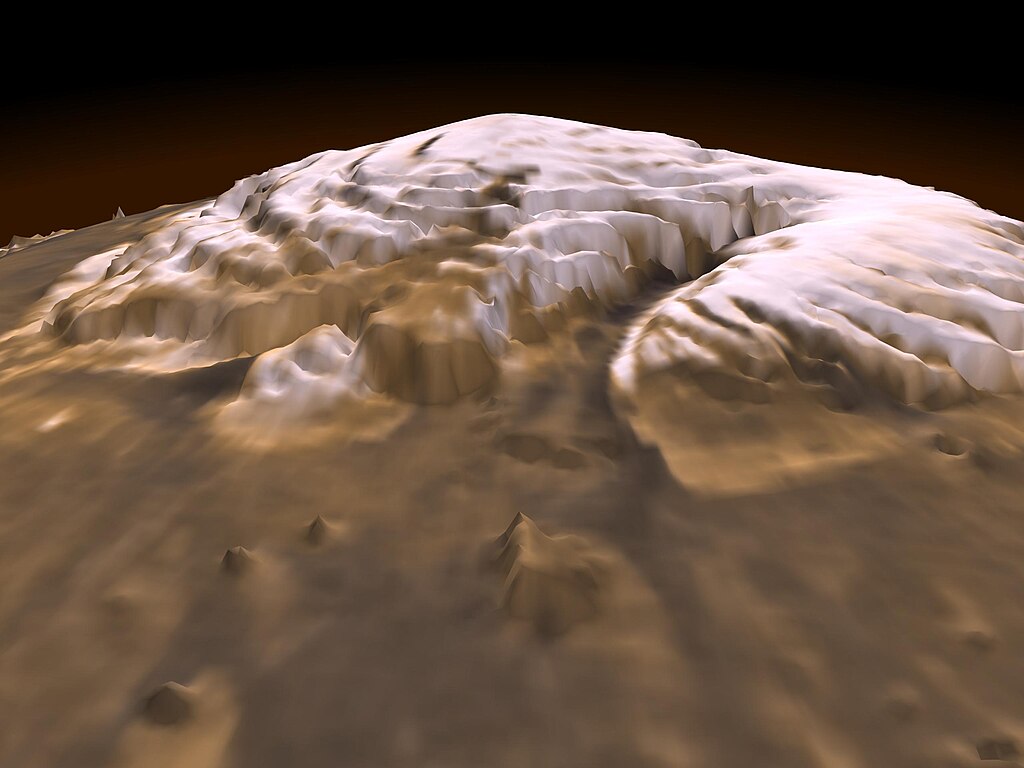
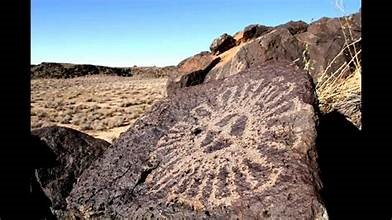
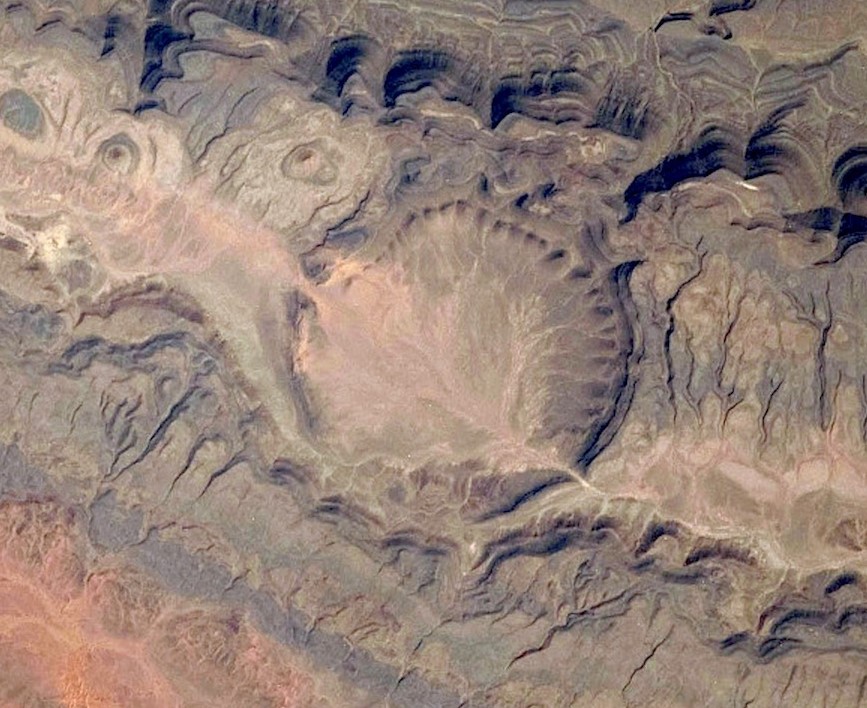
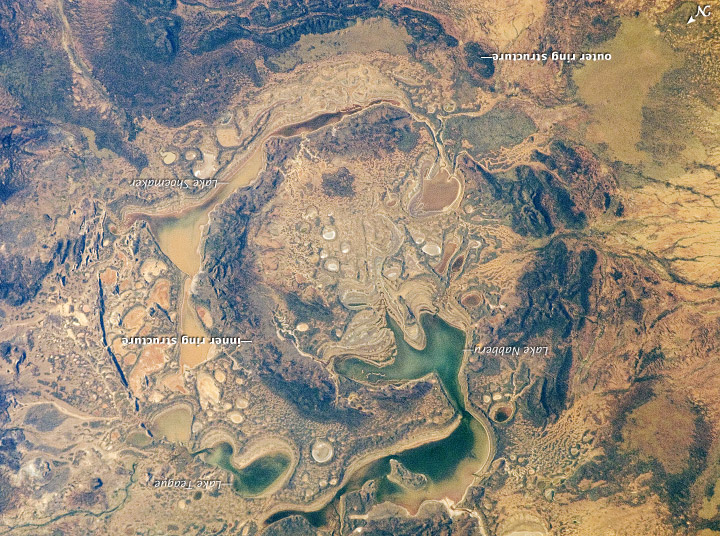
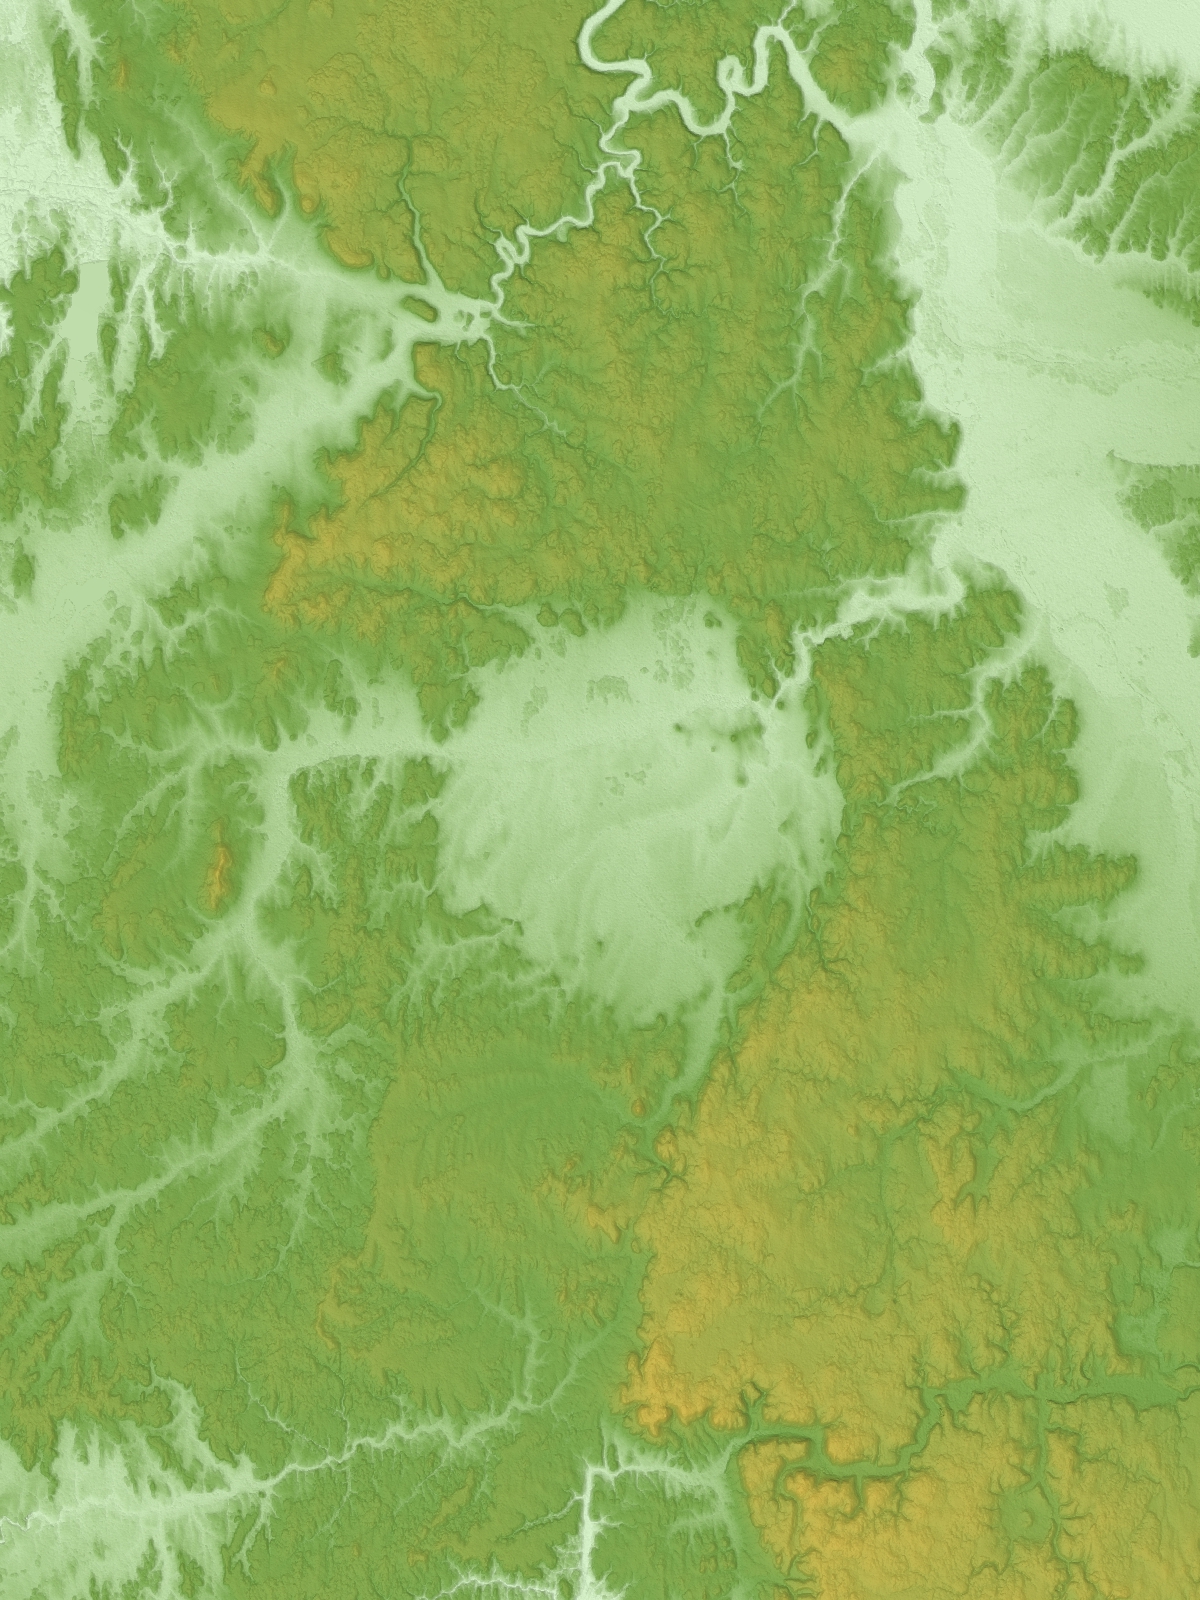
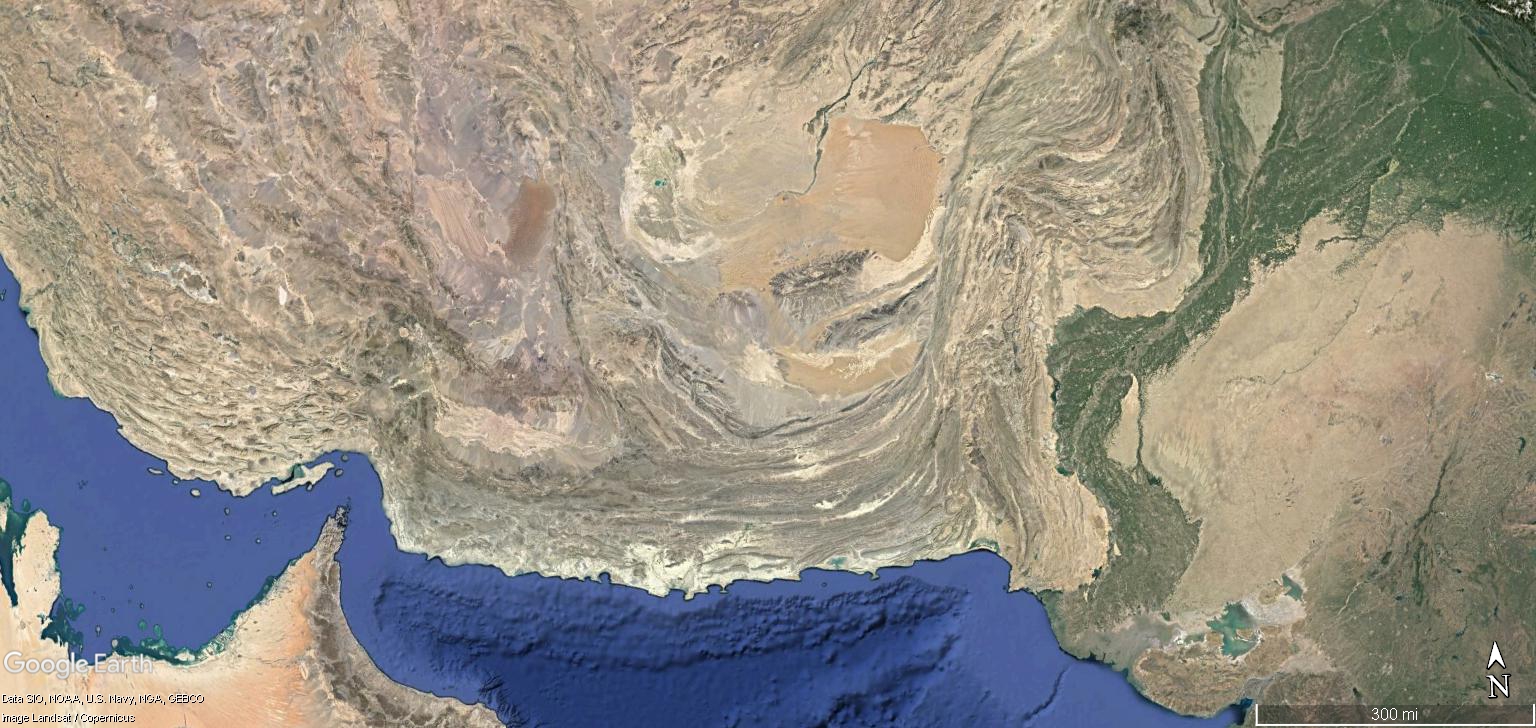
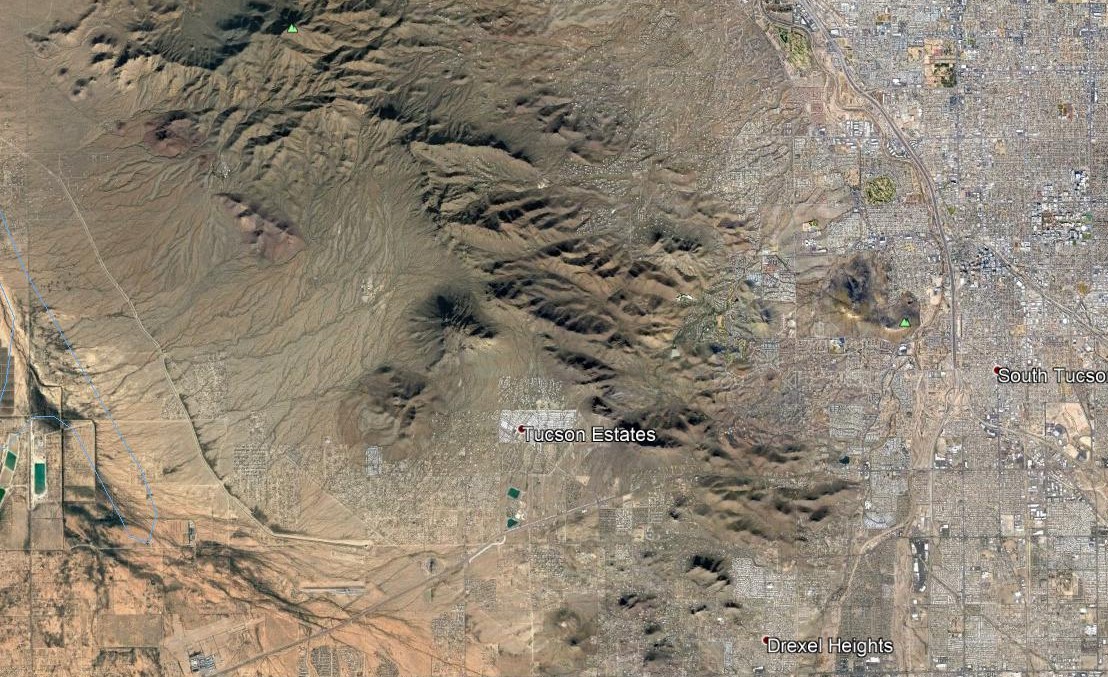
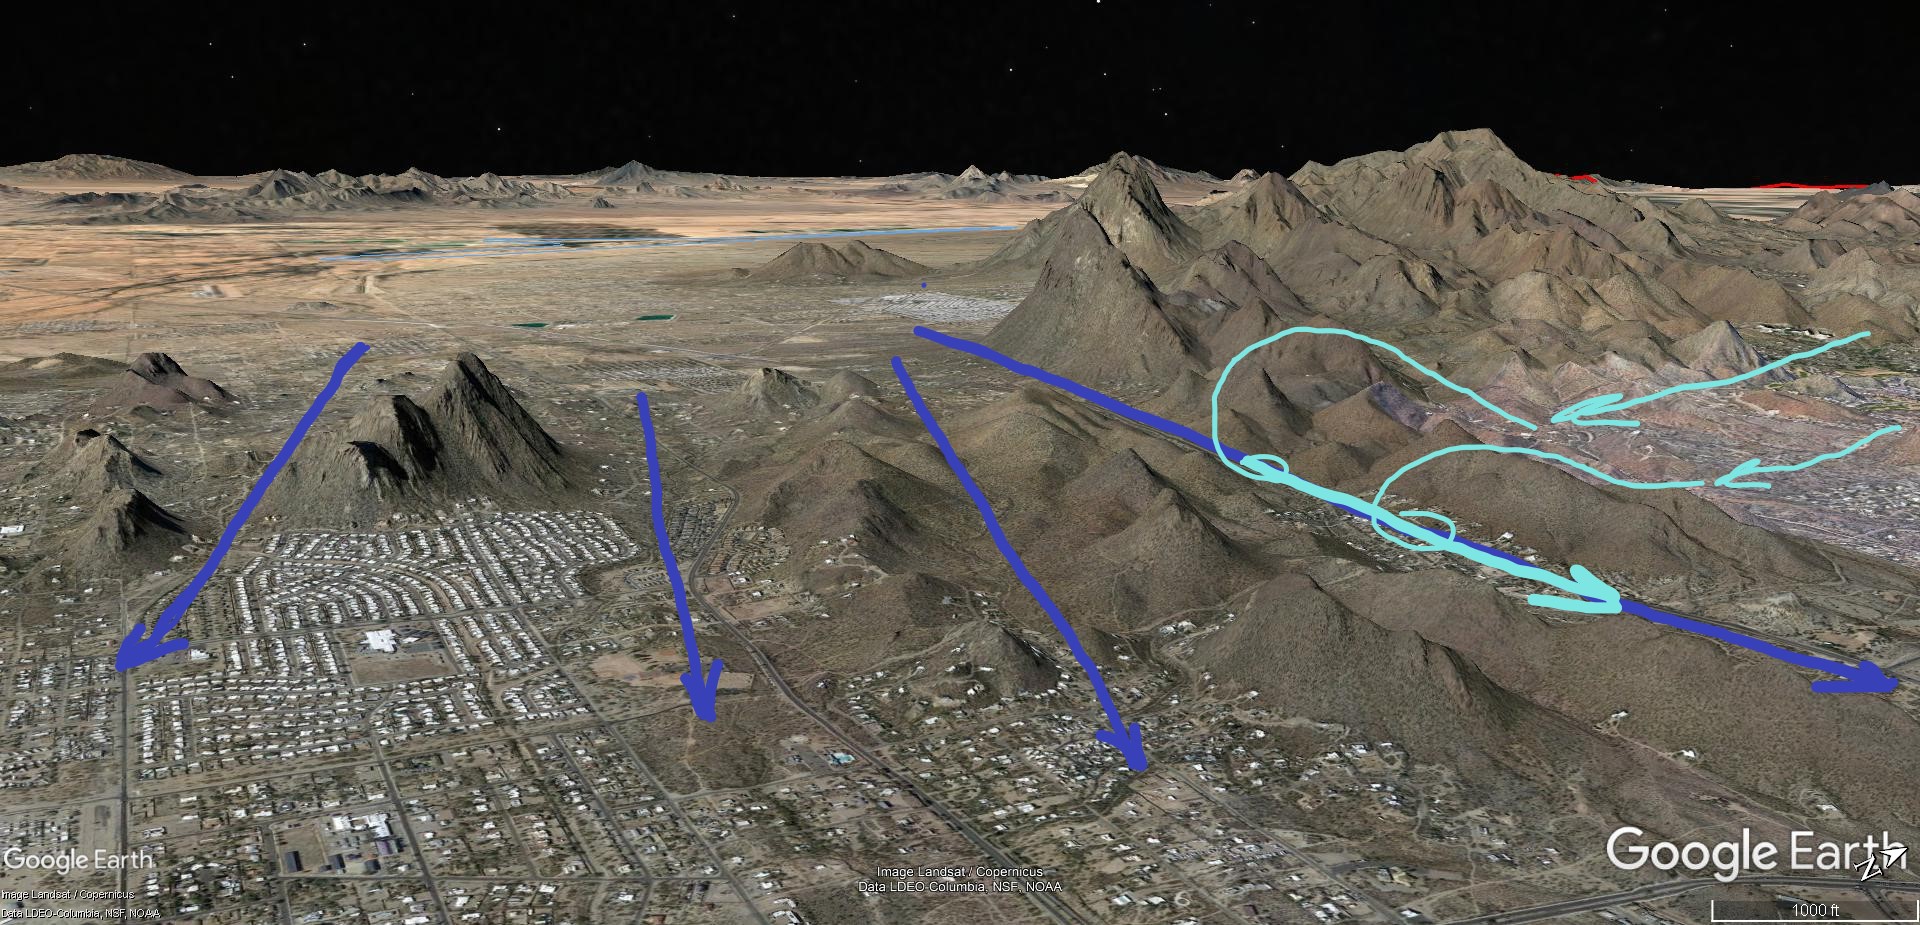
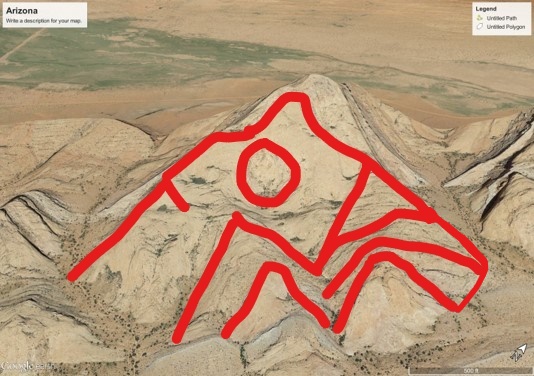
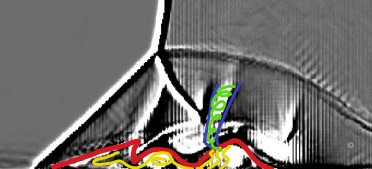
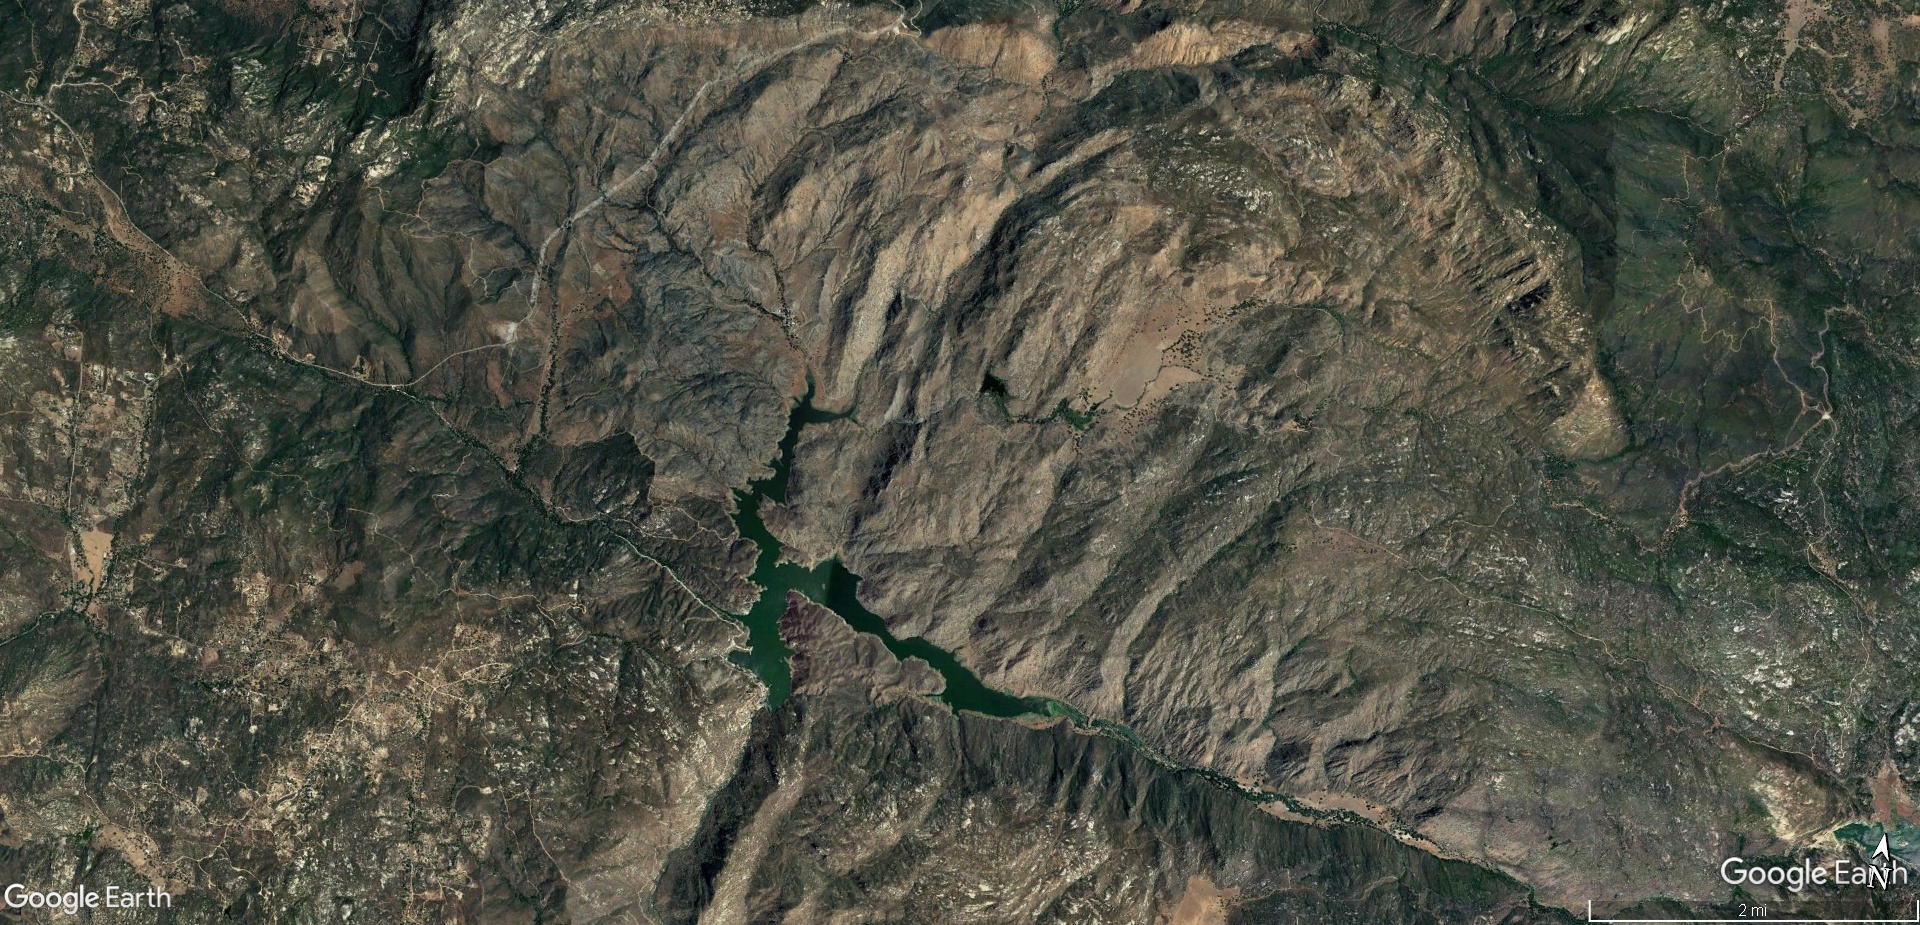
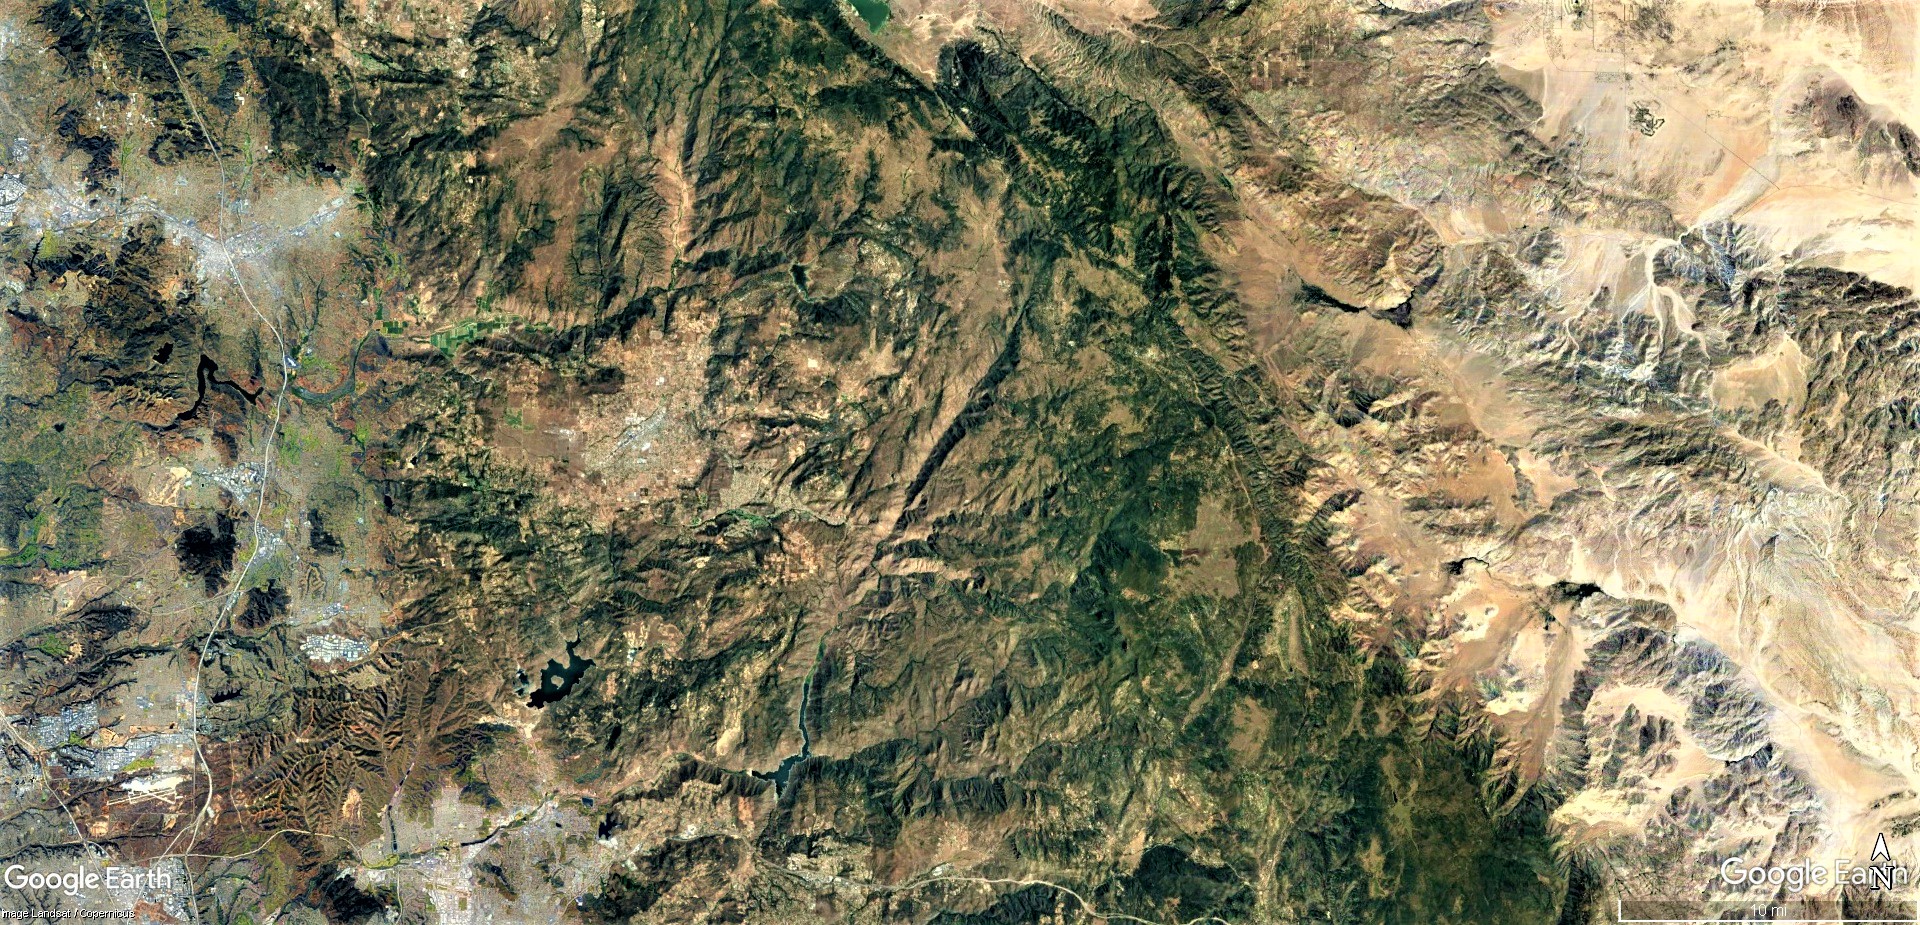
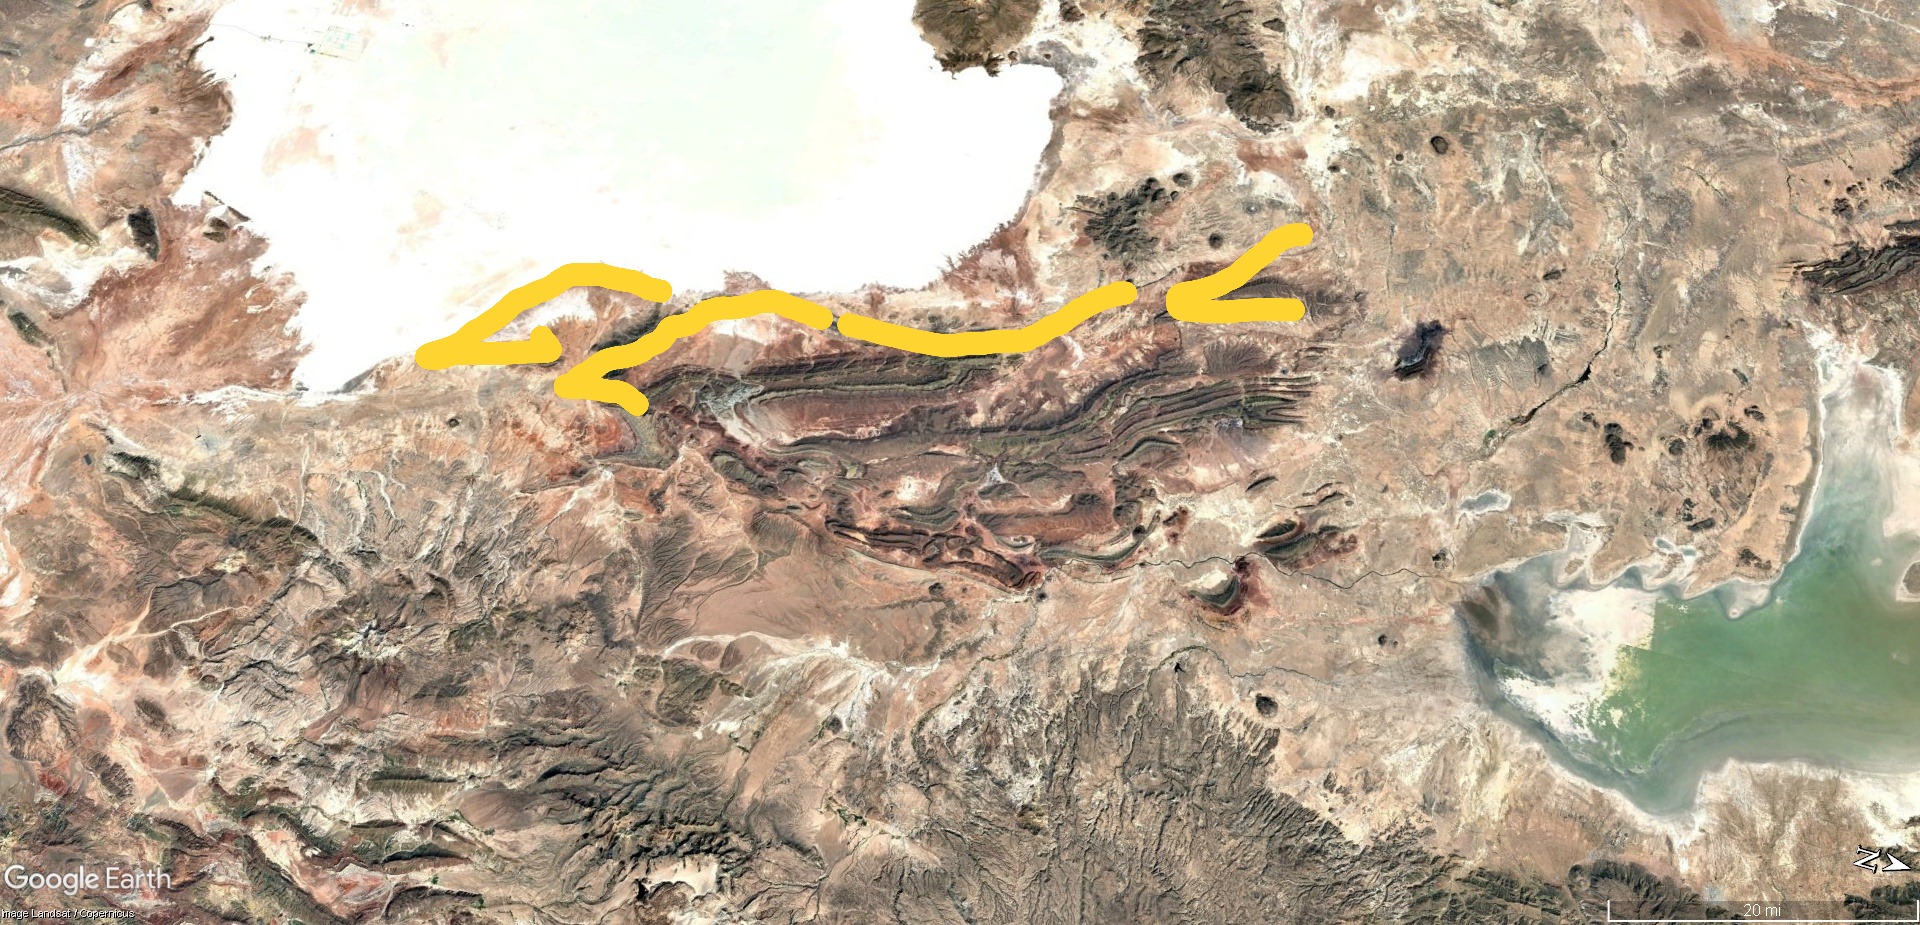
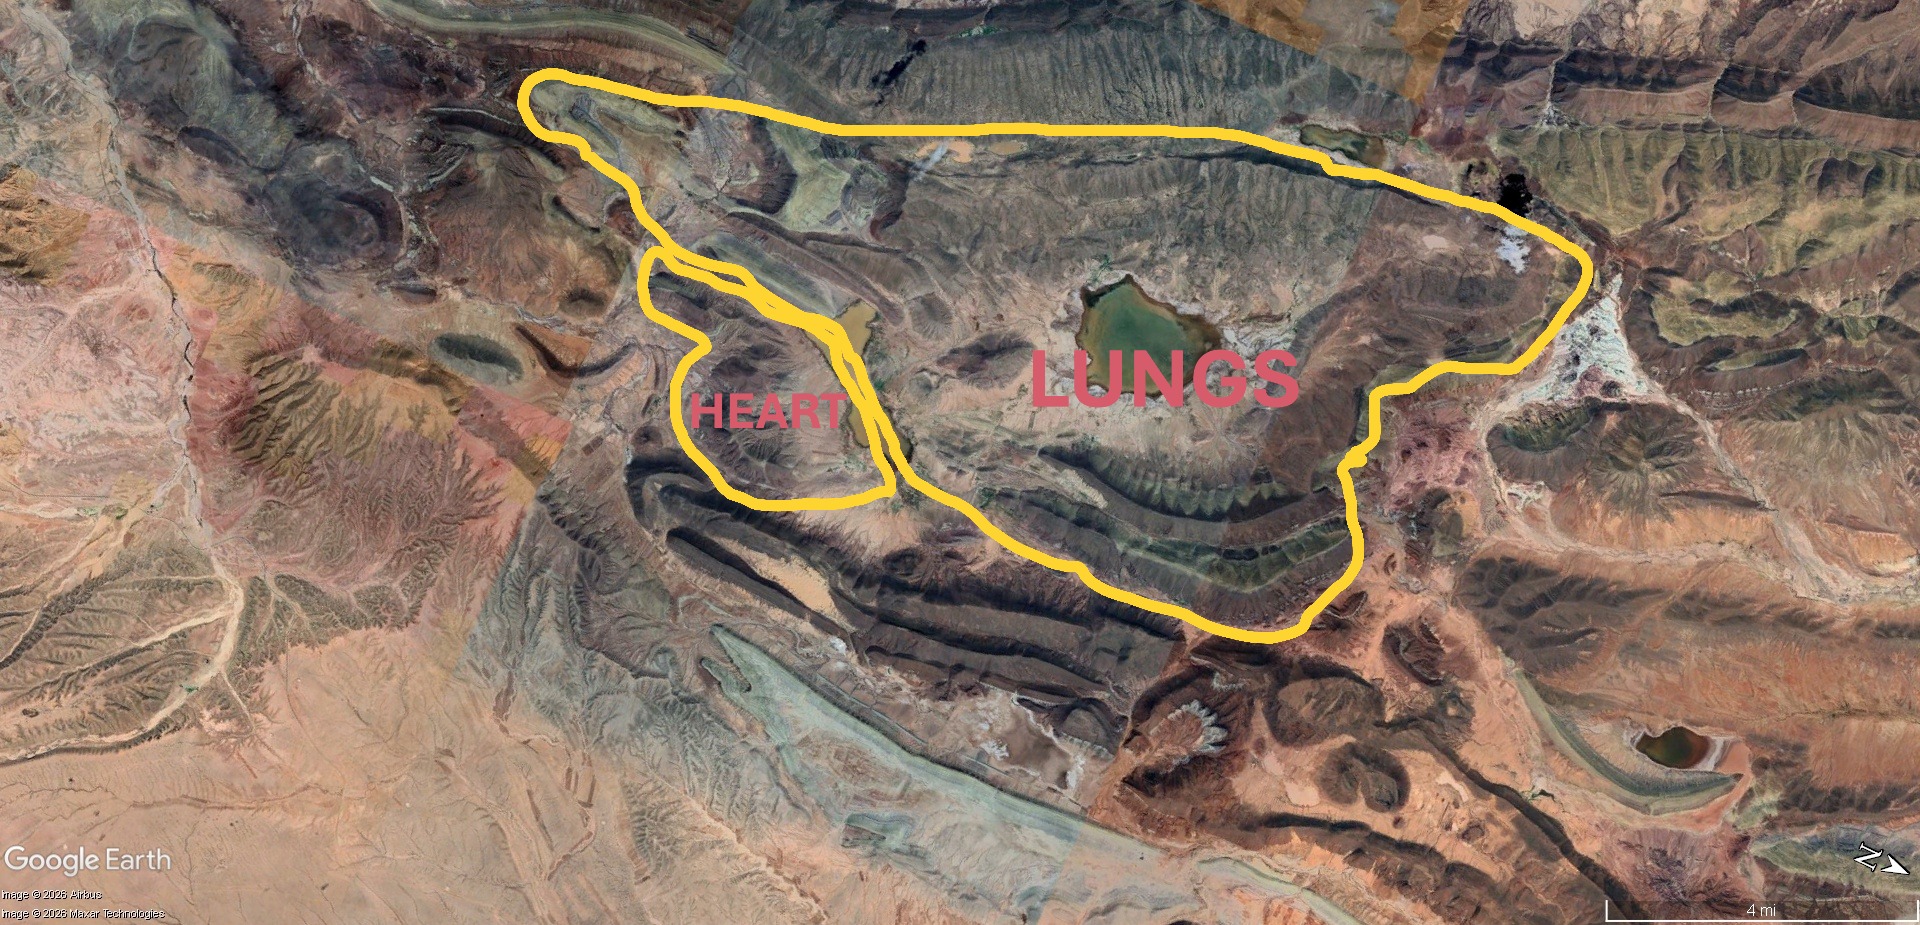
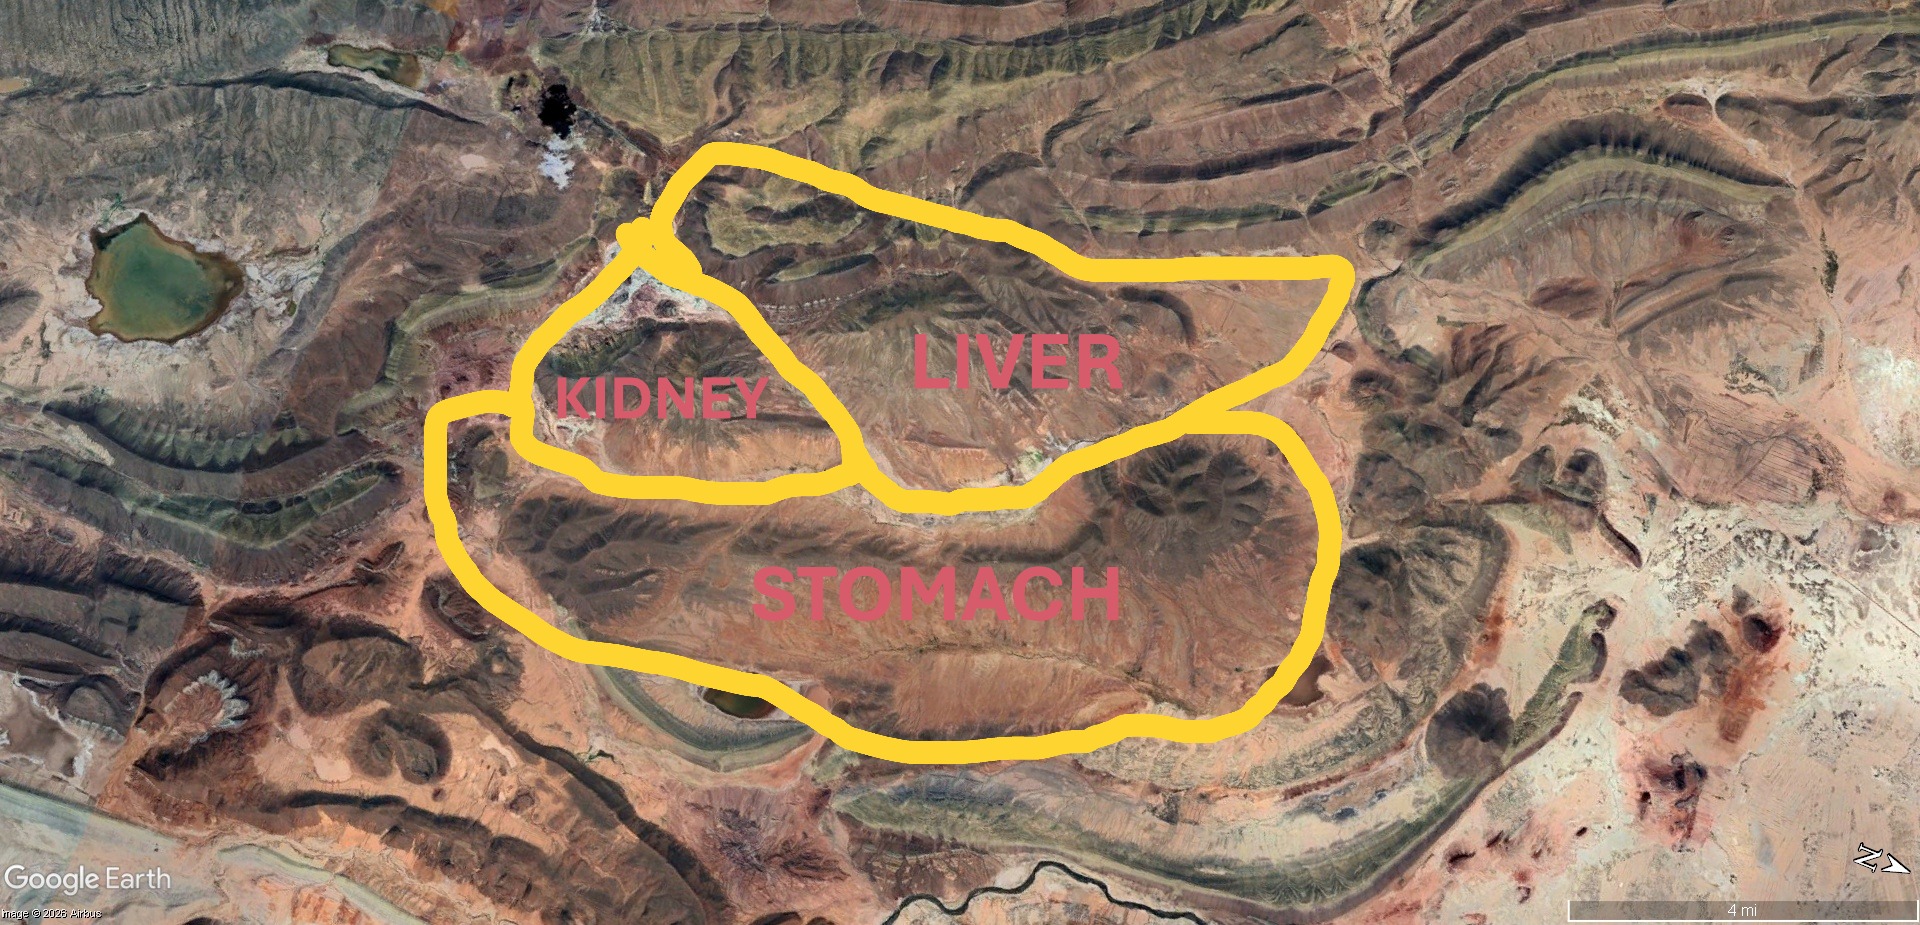
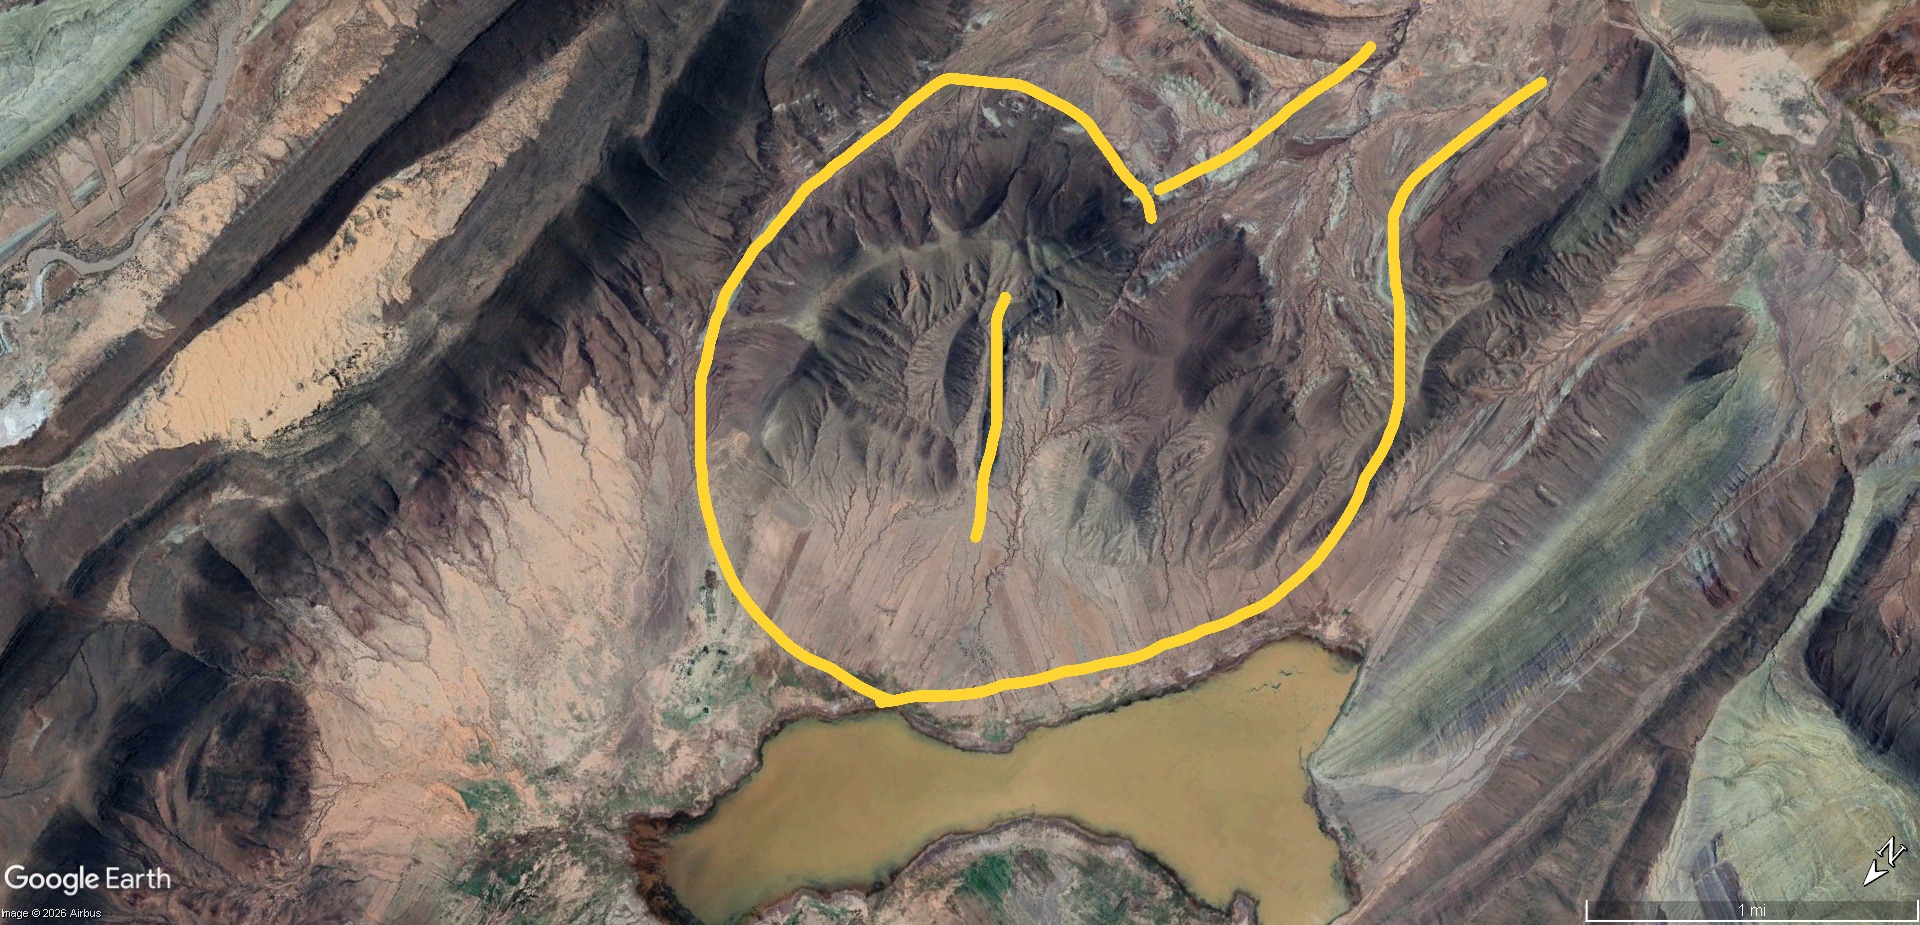
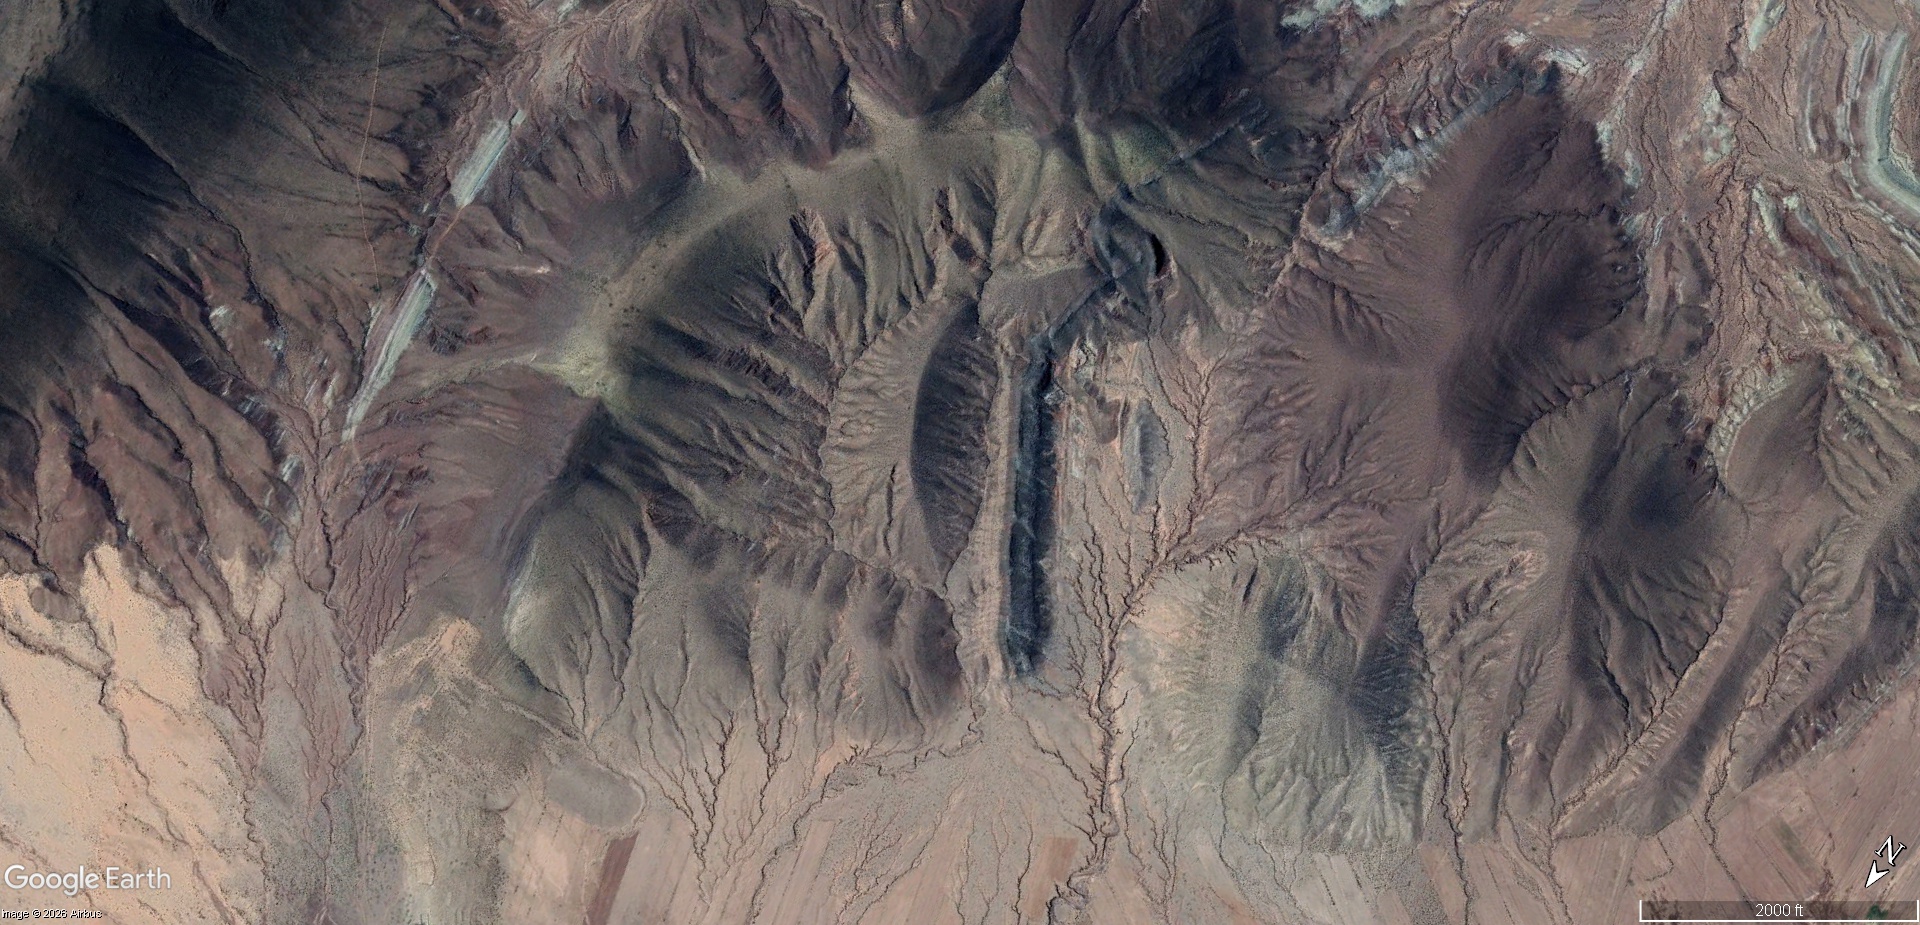
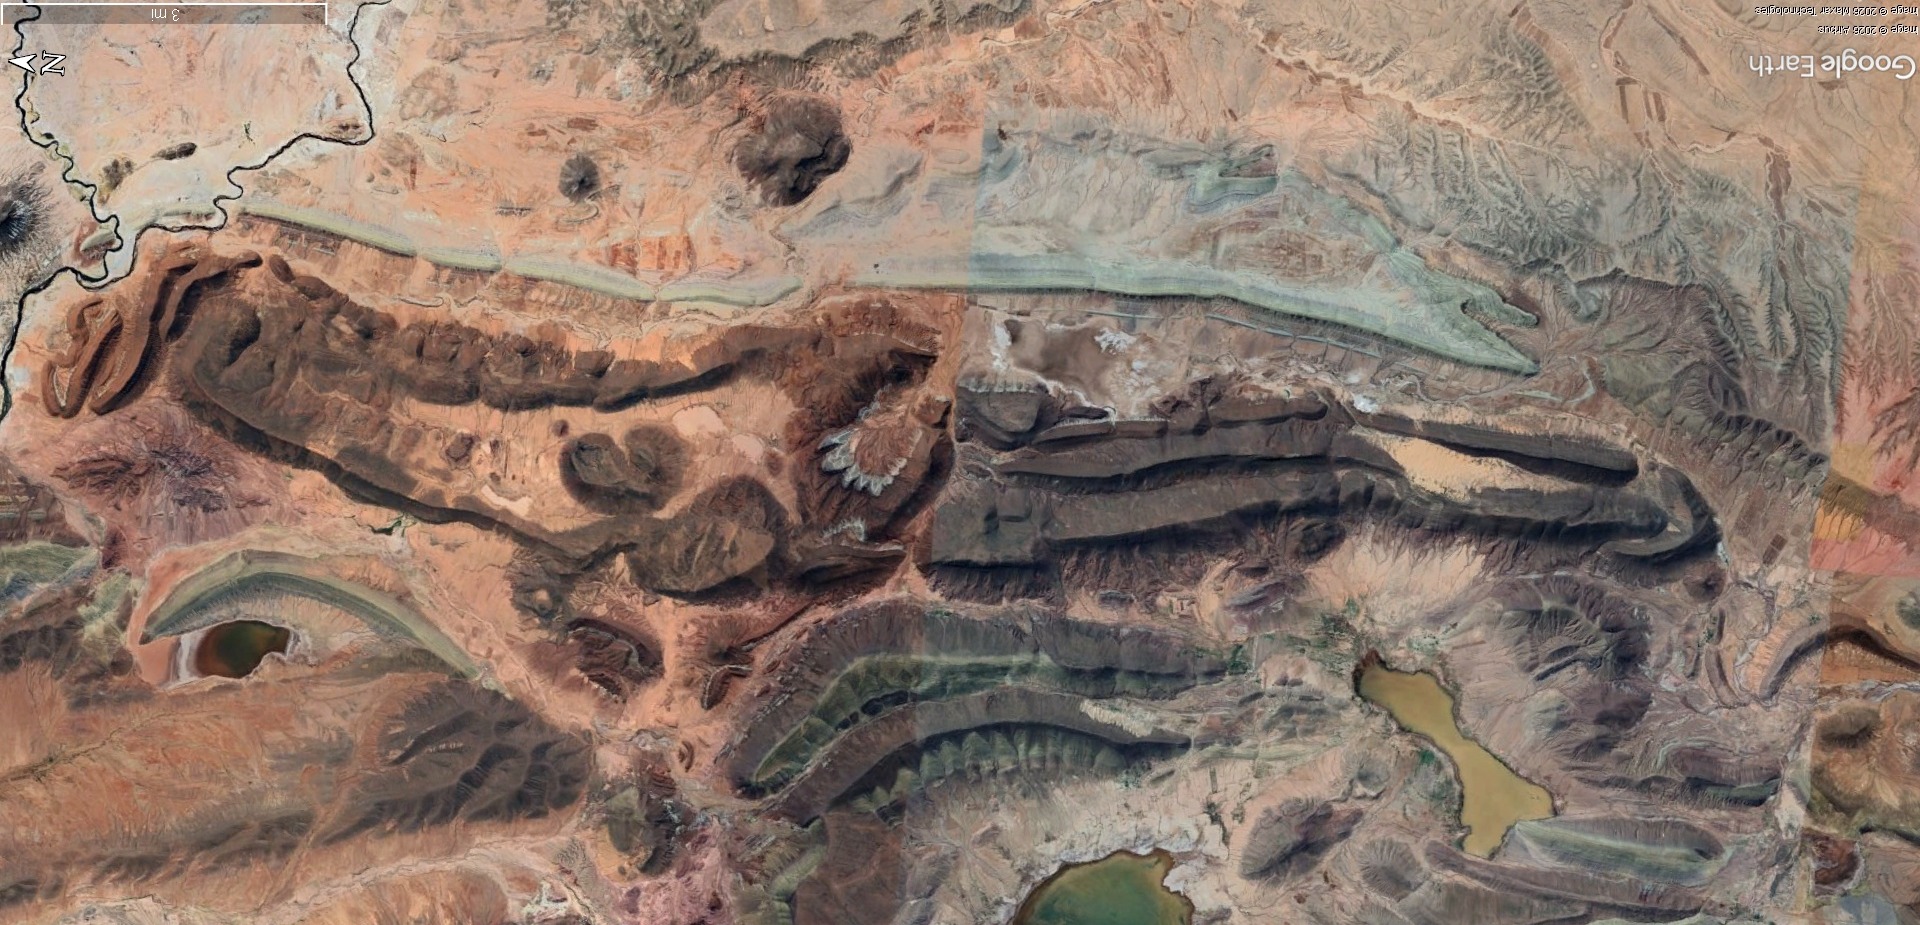
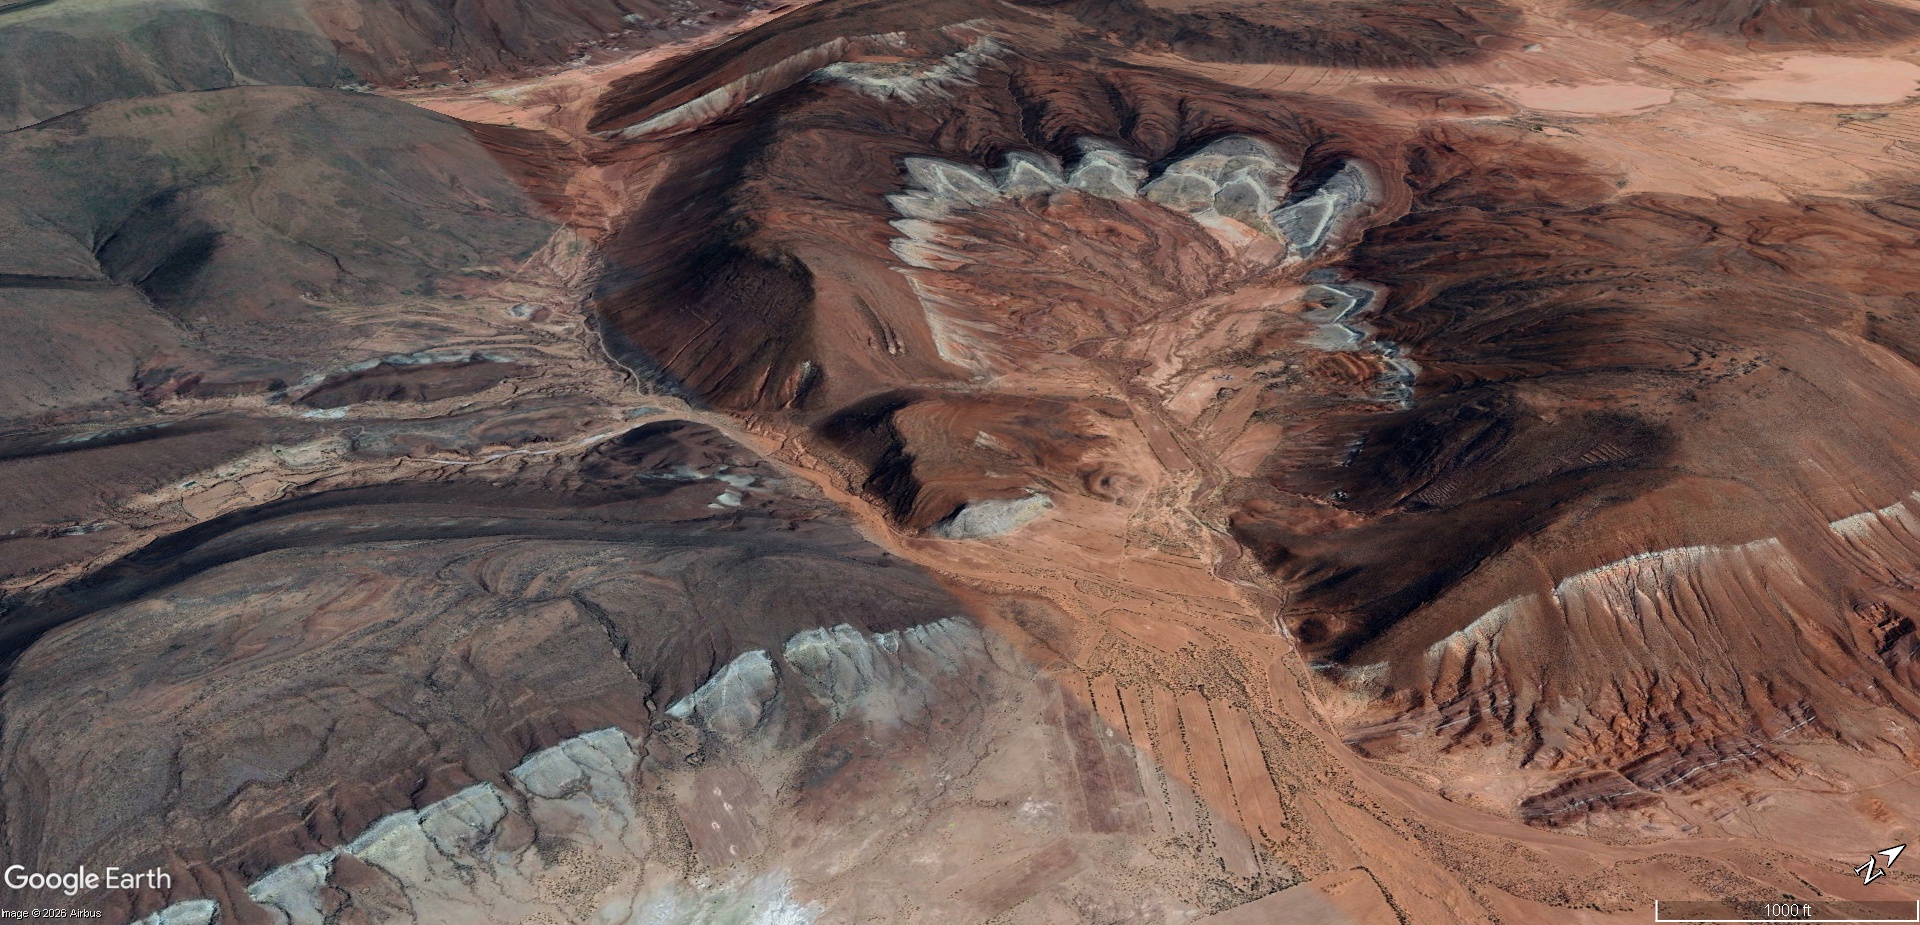
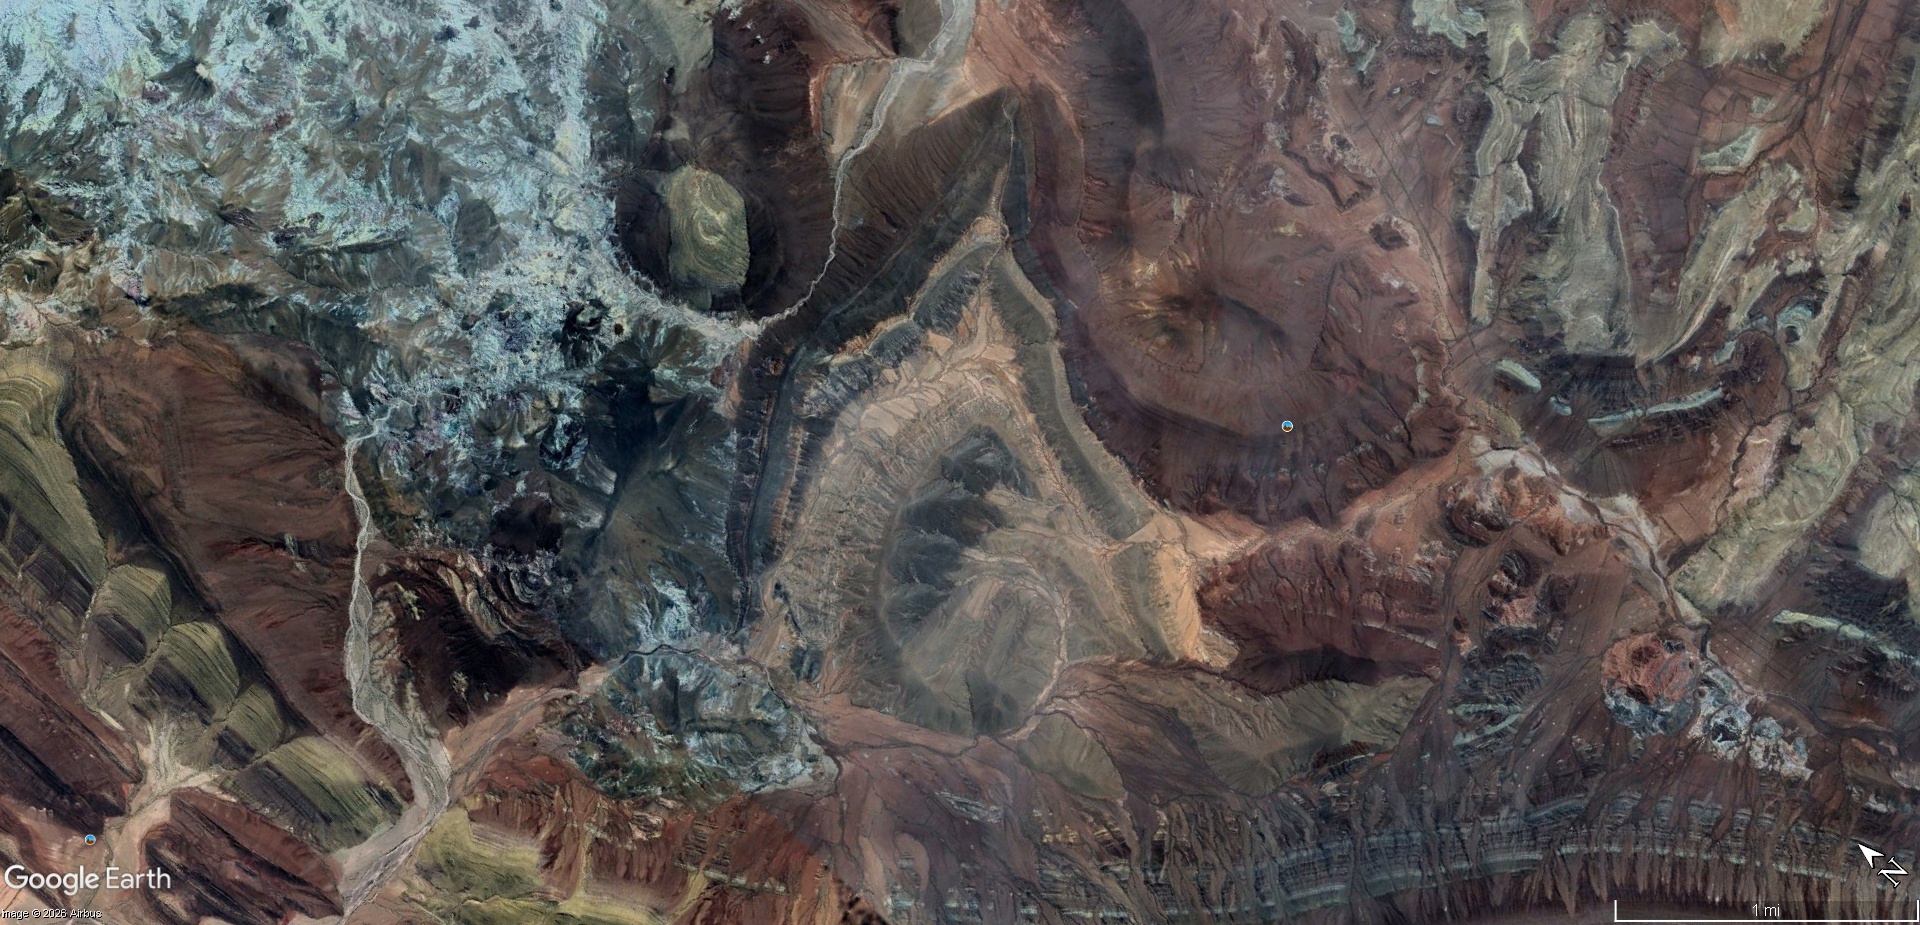
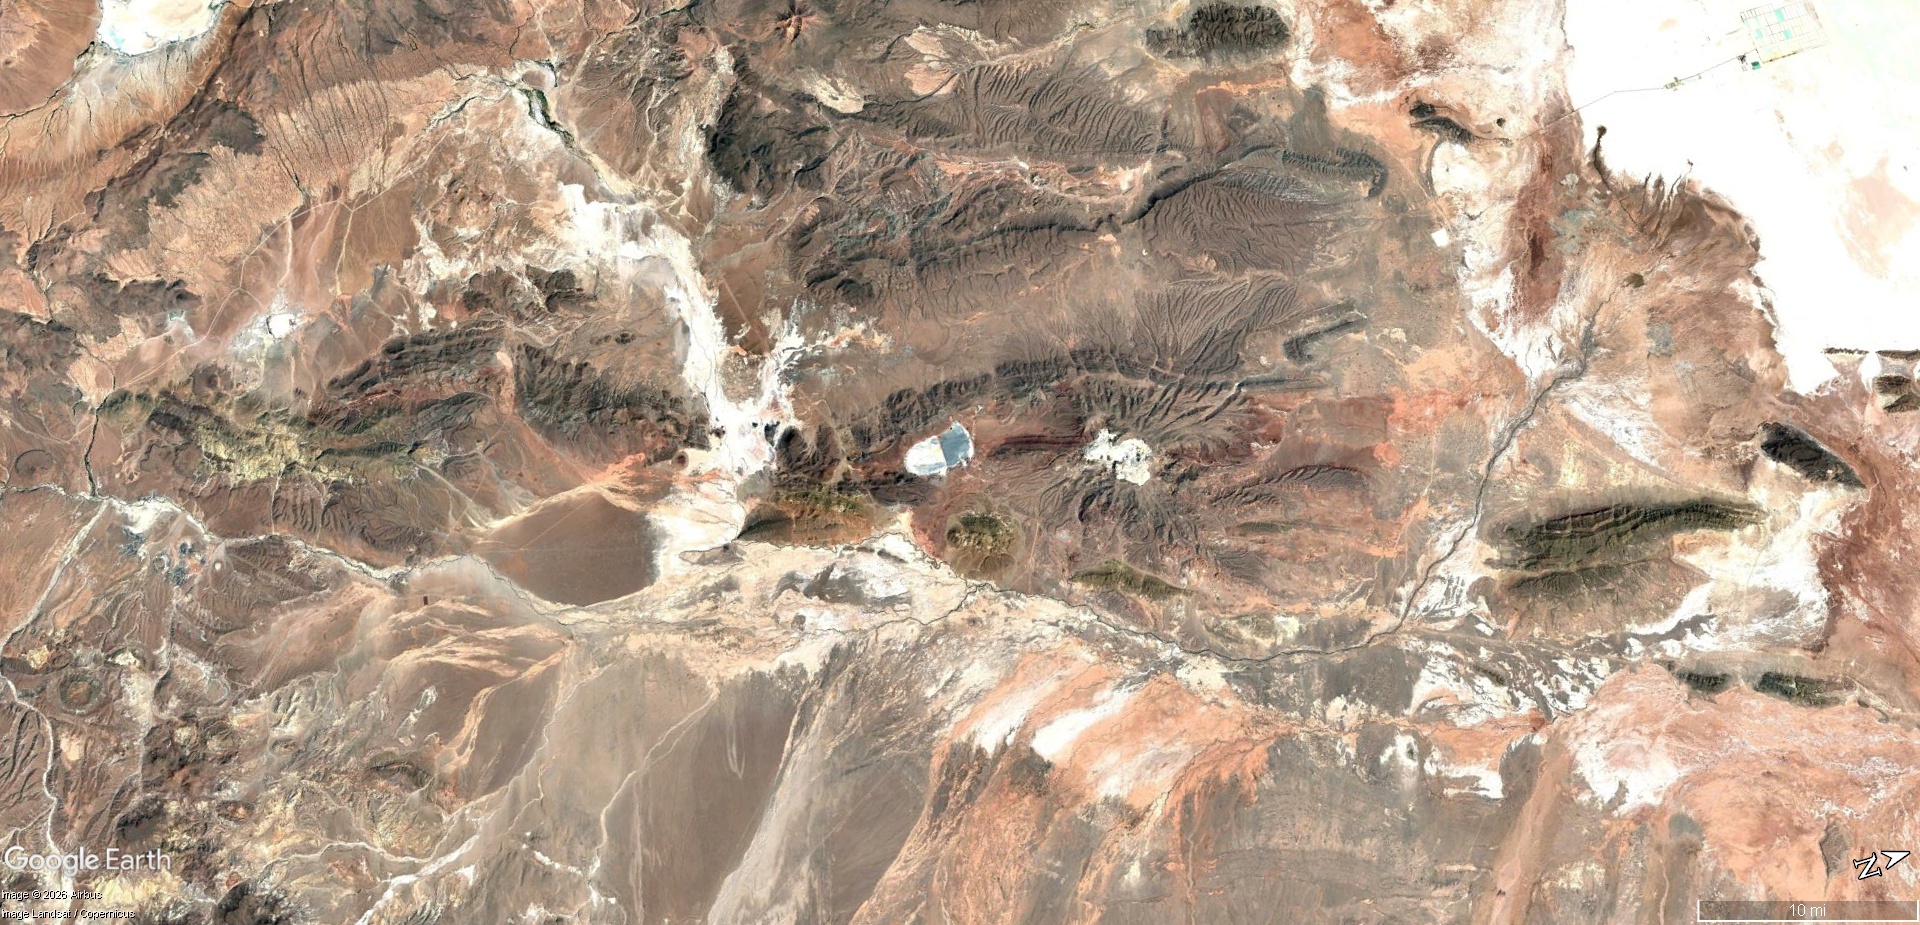
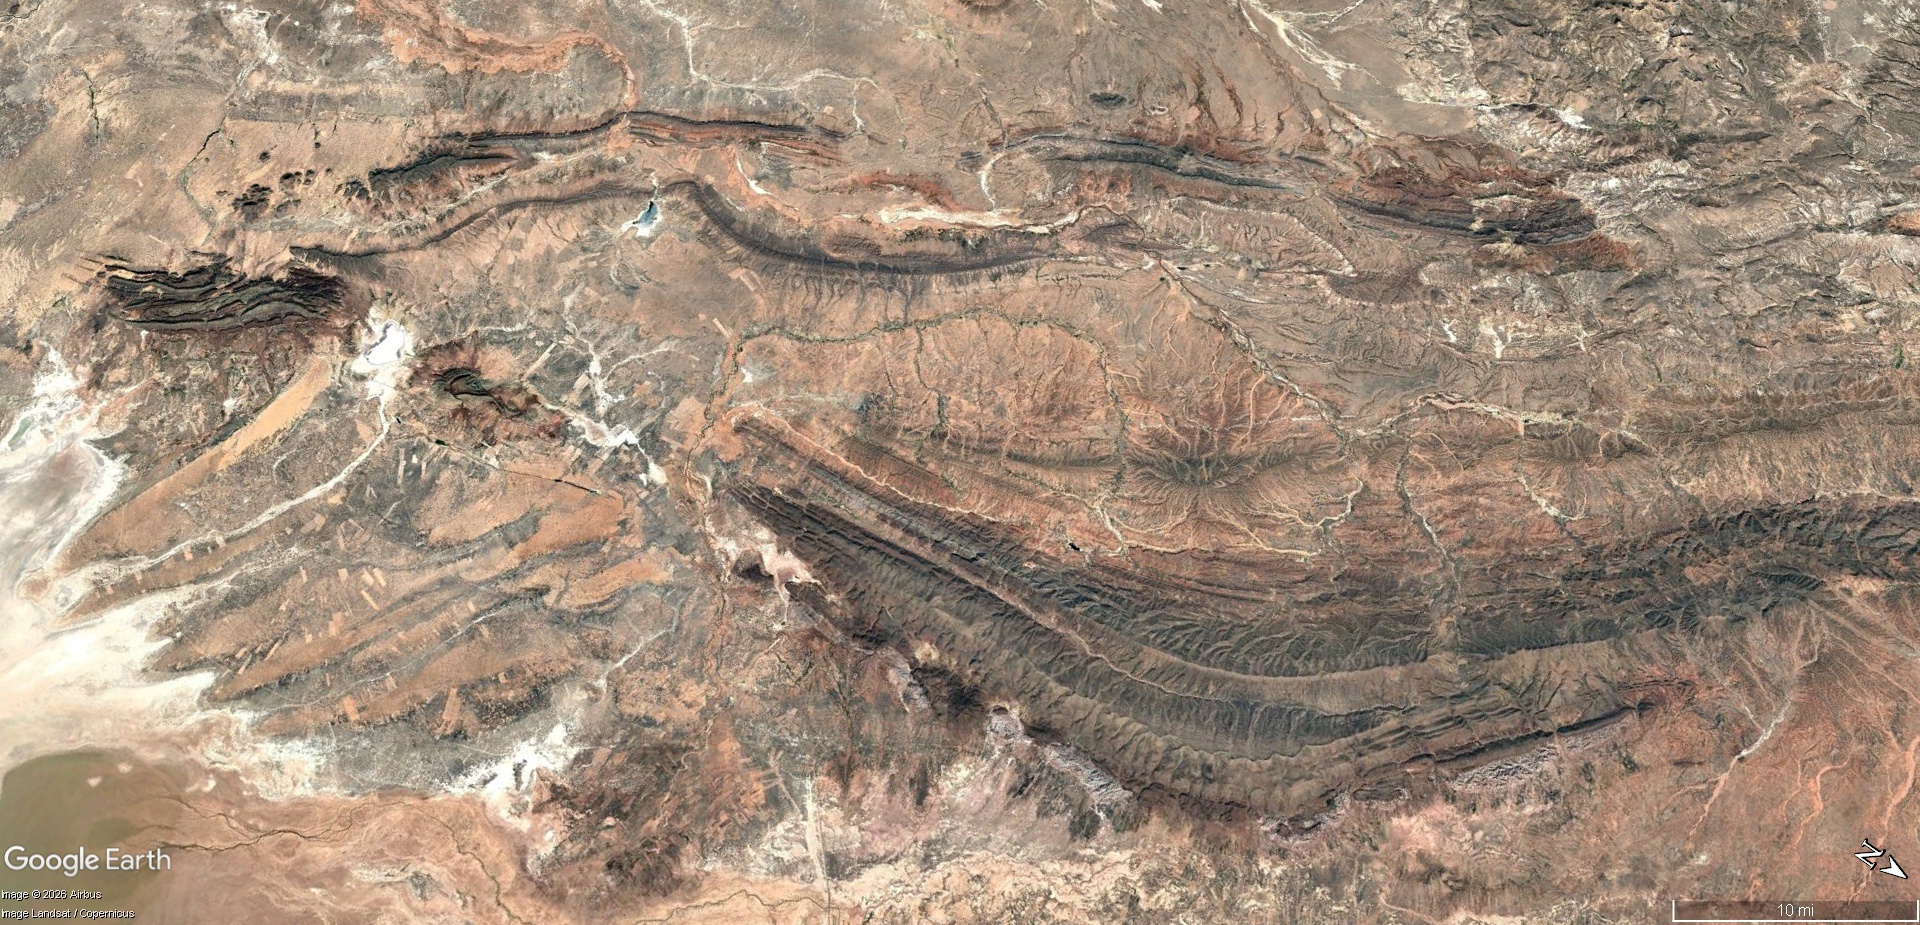
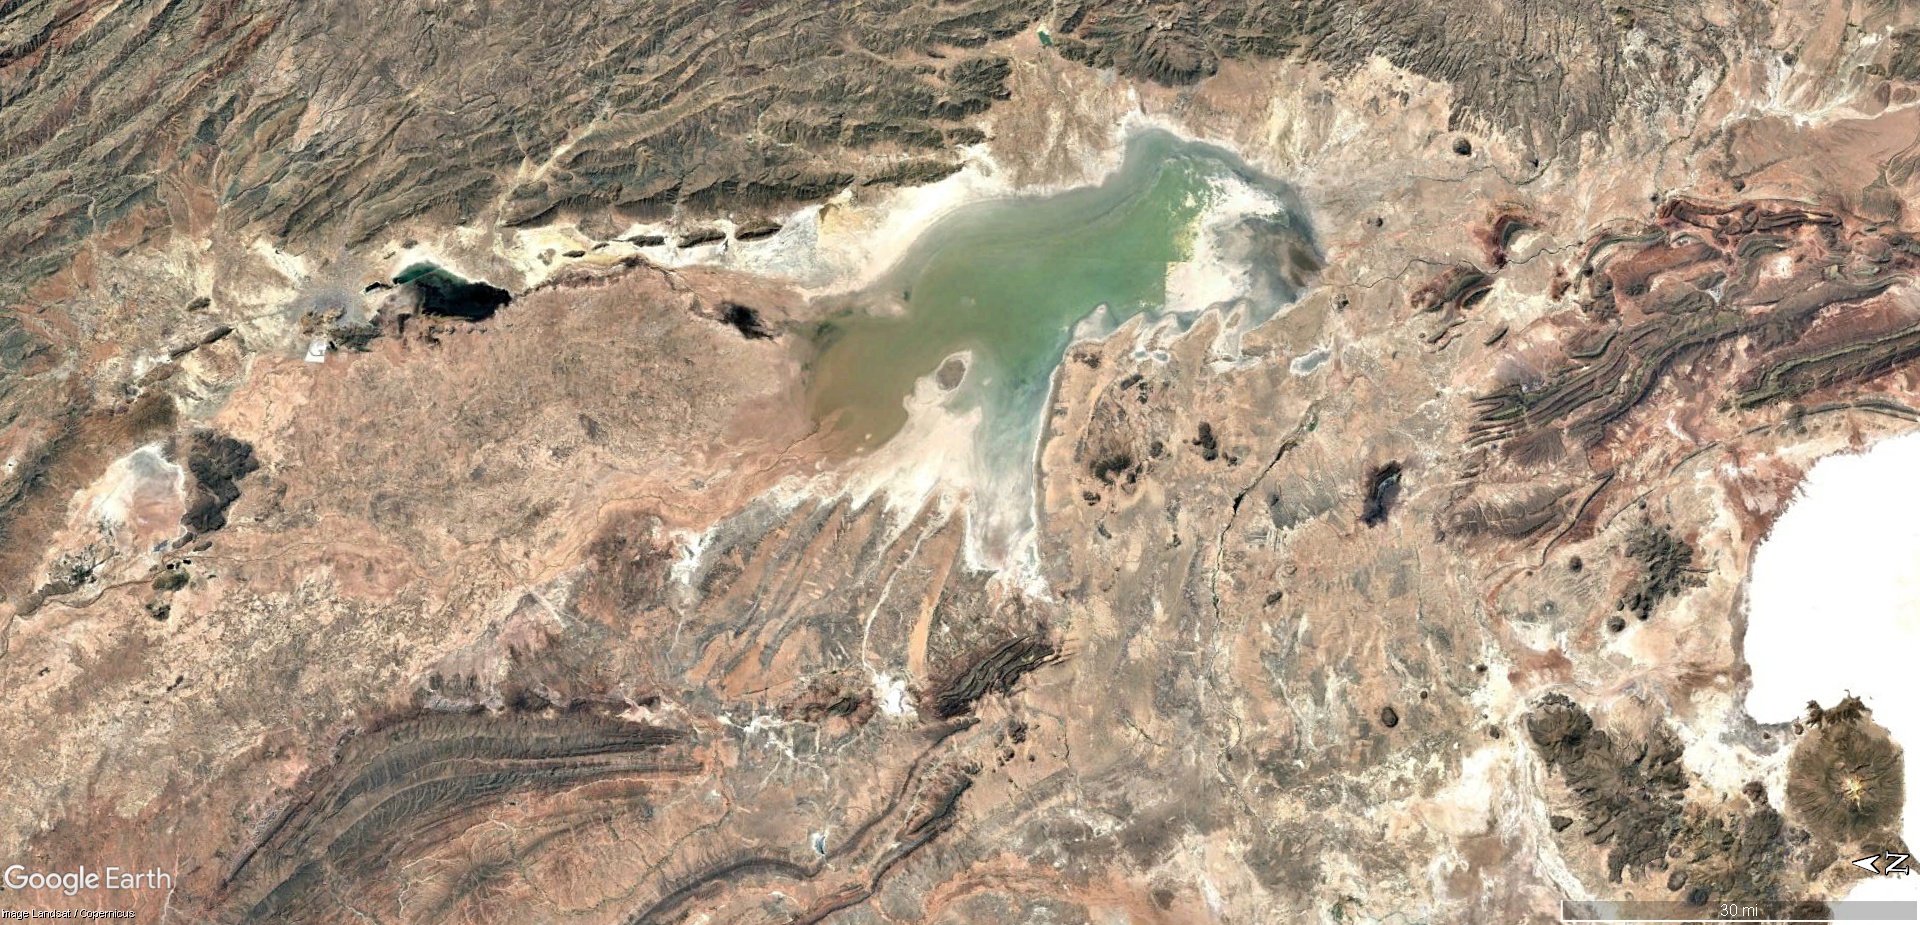
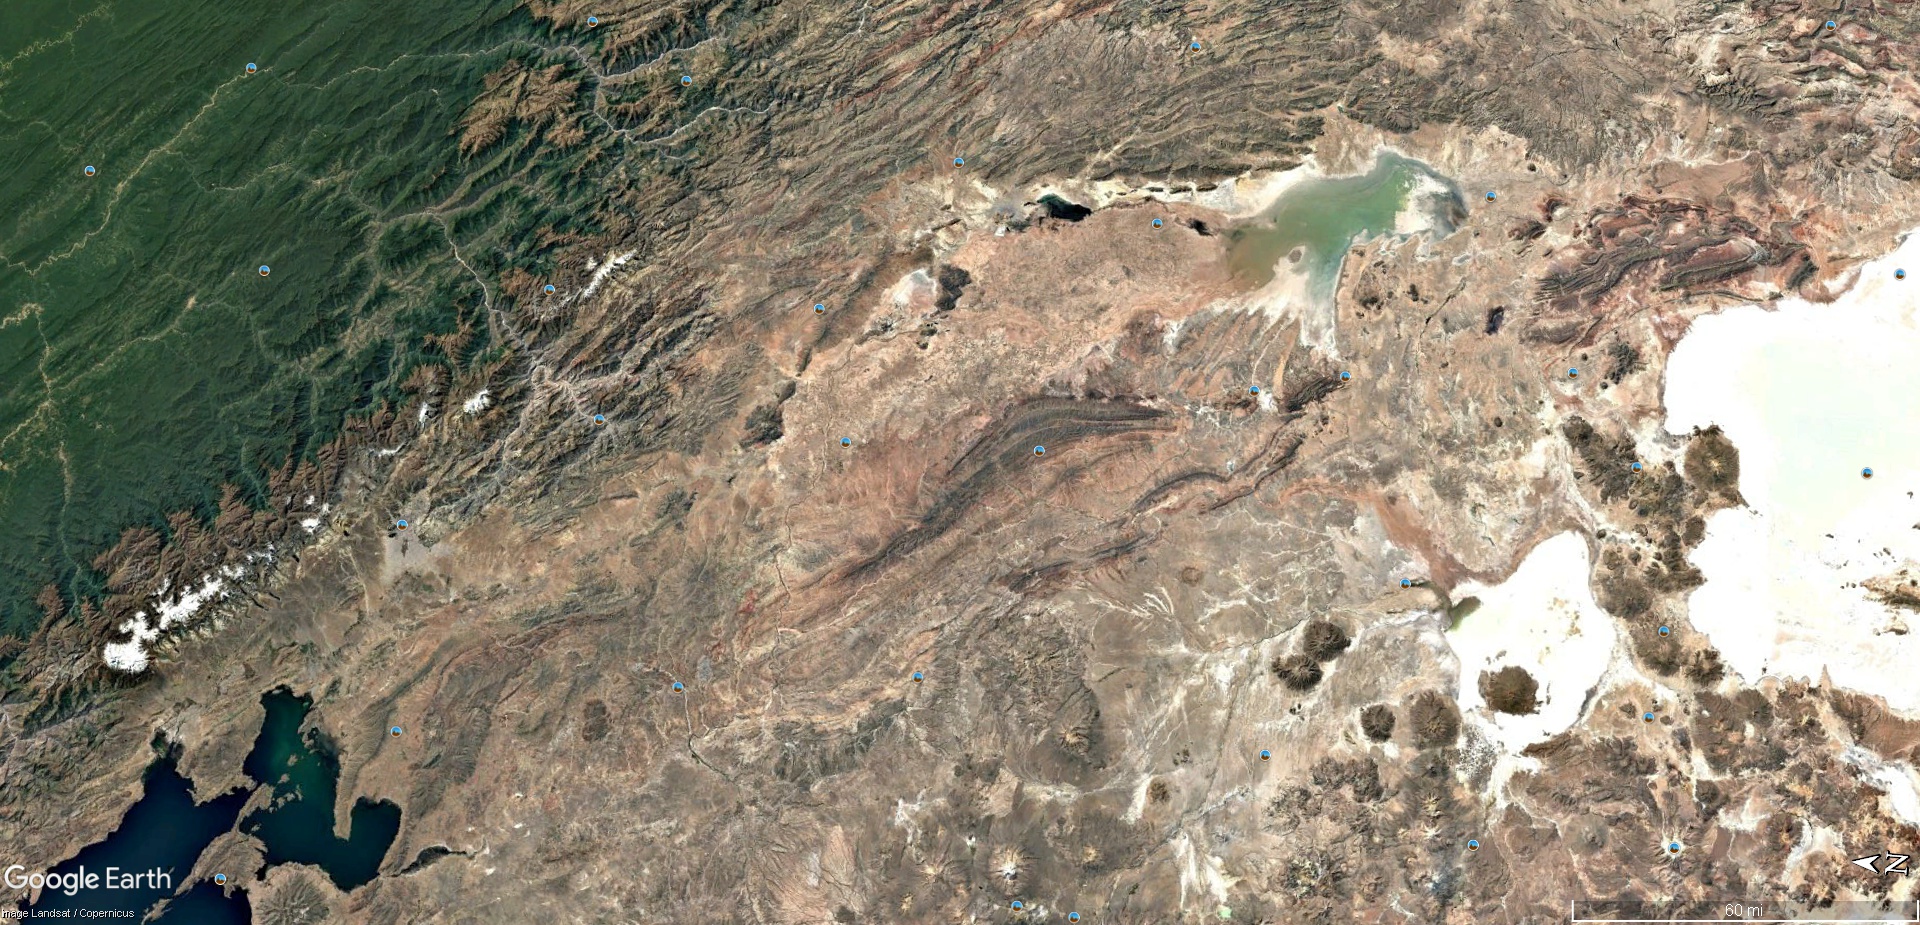
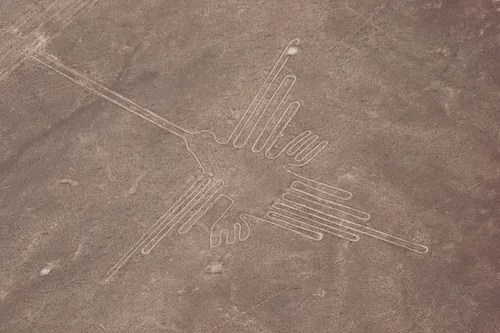
It can be seen everywhere one looks. It can be felt, heart and soul, by those who pay attention. But some examples are more astonishing than others. Take note of the ‘Songbird of the Andes’. This holographic evidence in the form of a group of mountains makes a three-dimensional bird in flight, stretching 51 miles from beak to tail-feathers. It has an eye where an eye should be, wings where wings should be; heart, lungs, liver, kidney and a few other things, all where they belong anatomically.

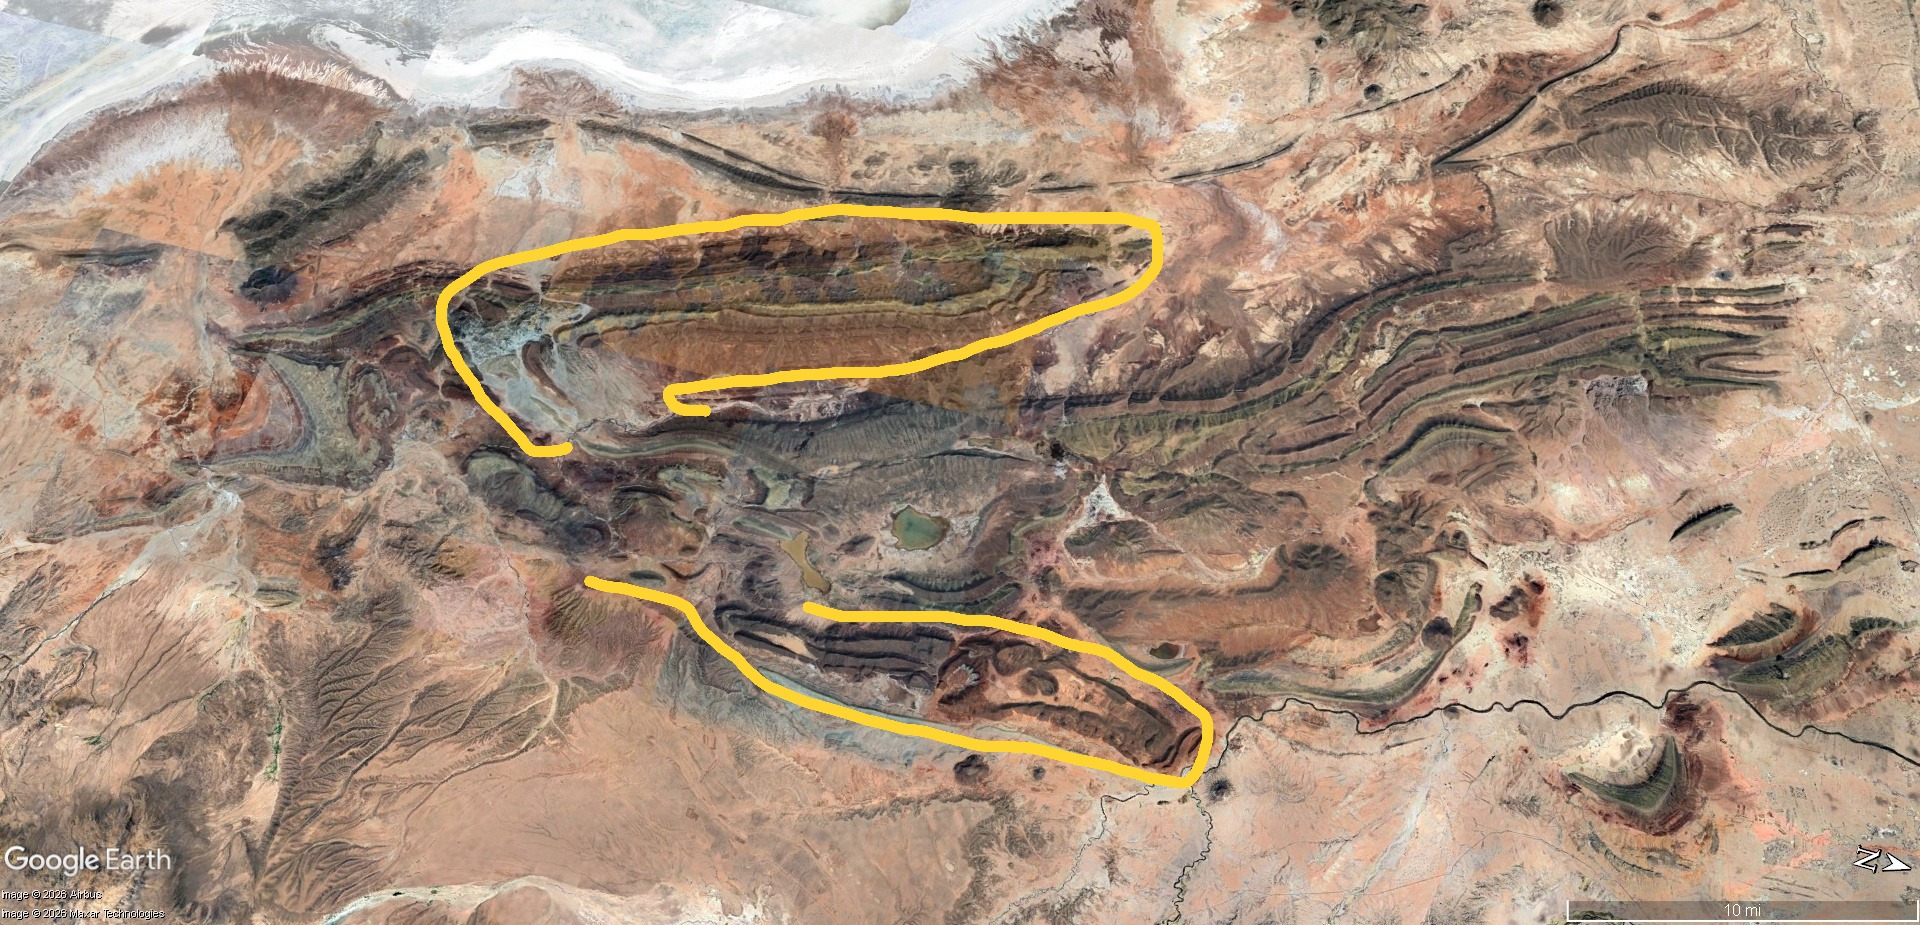
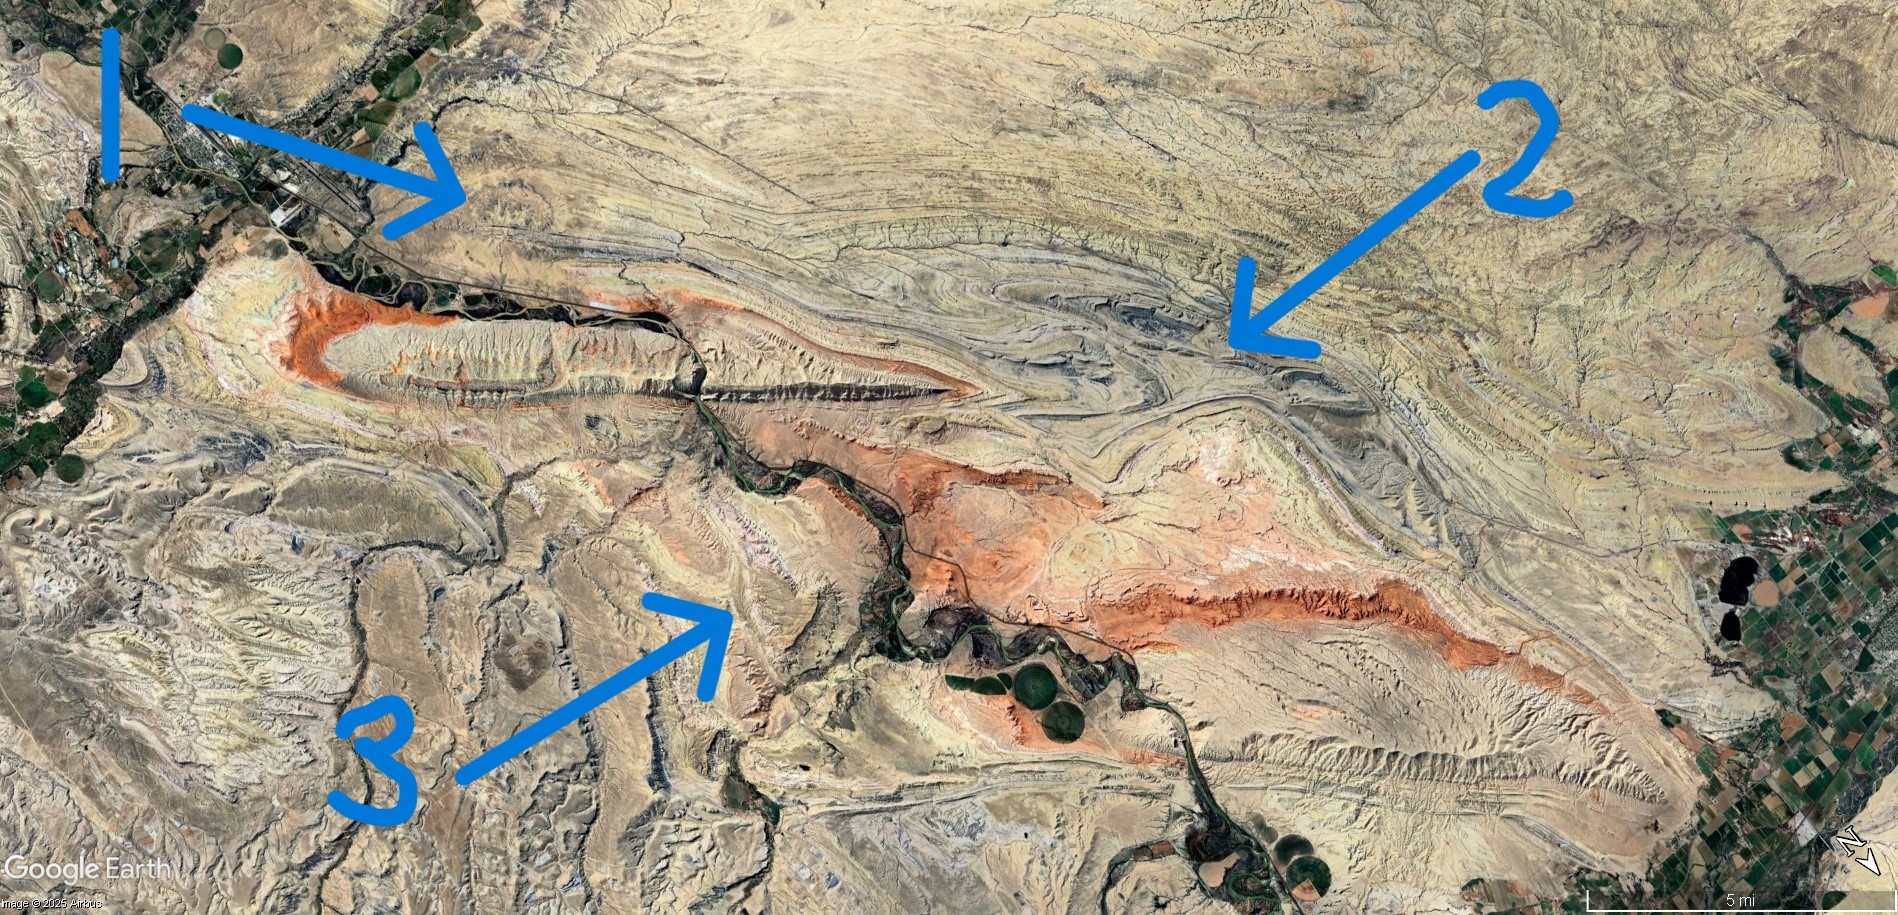
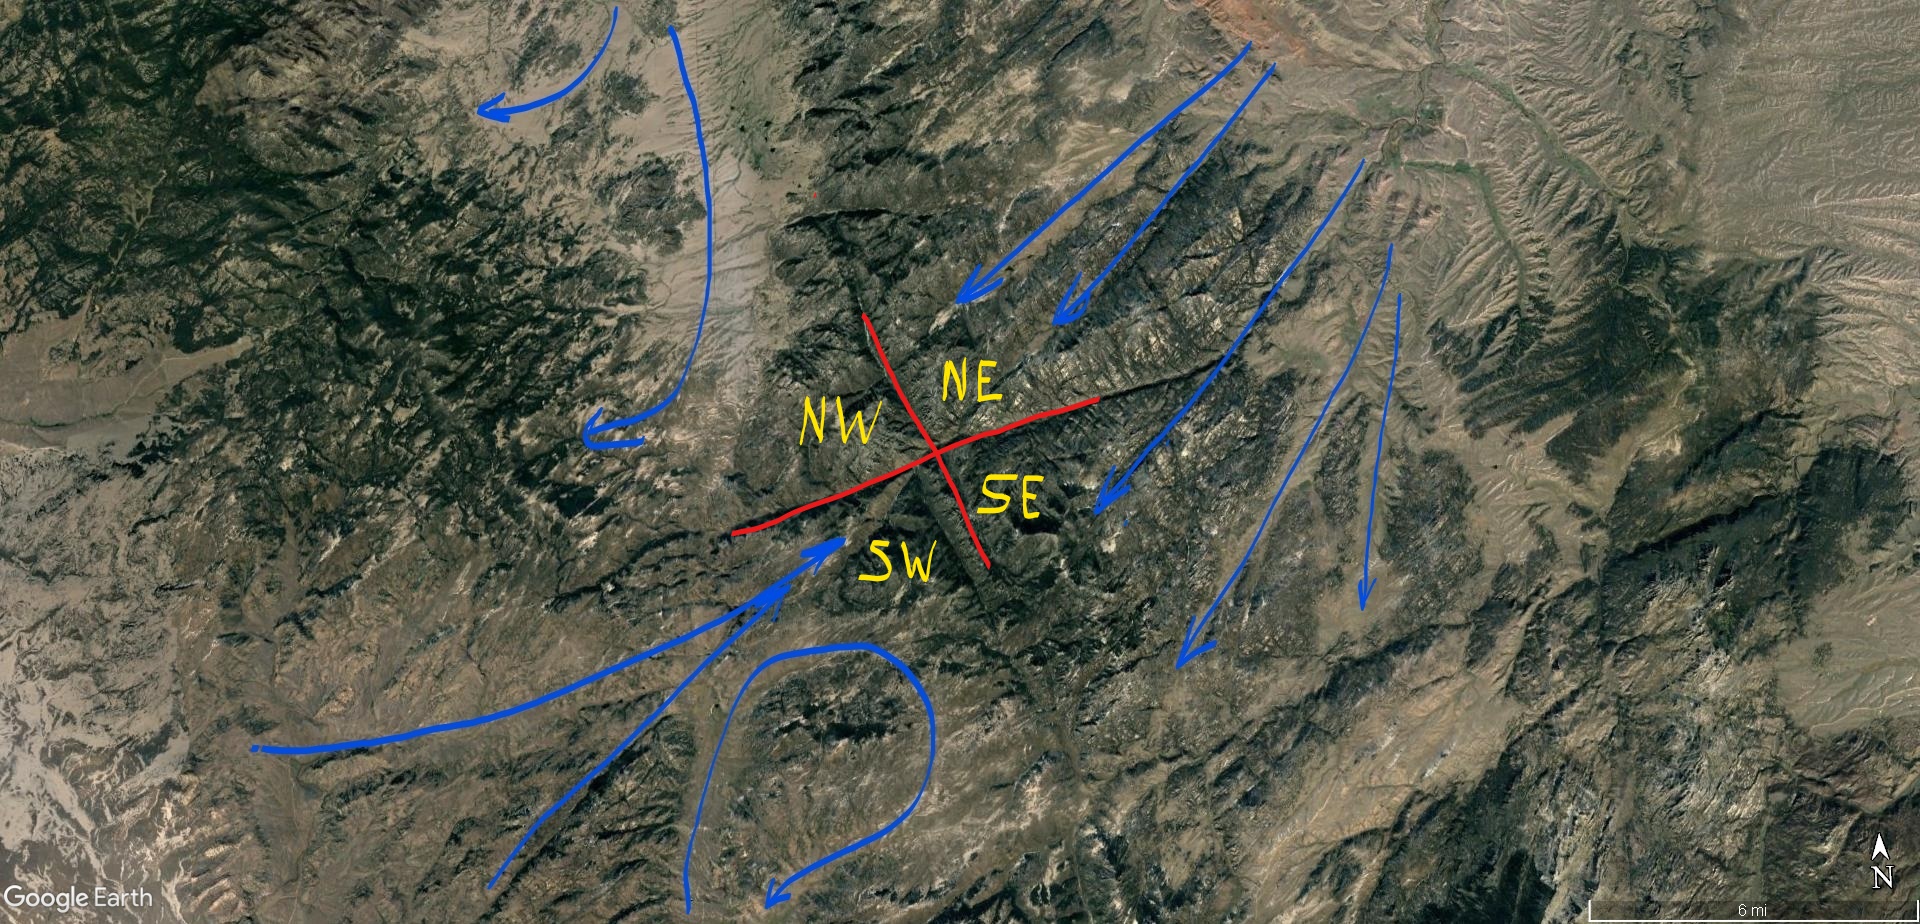
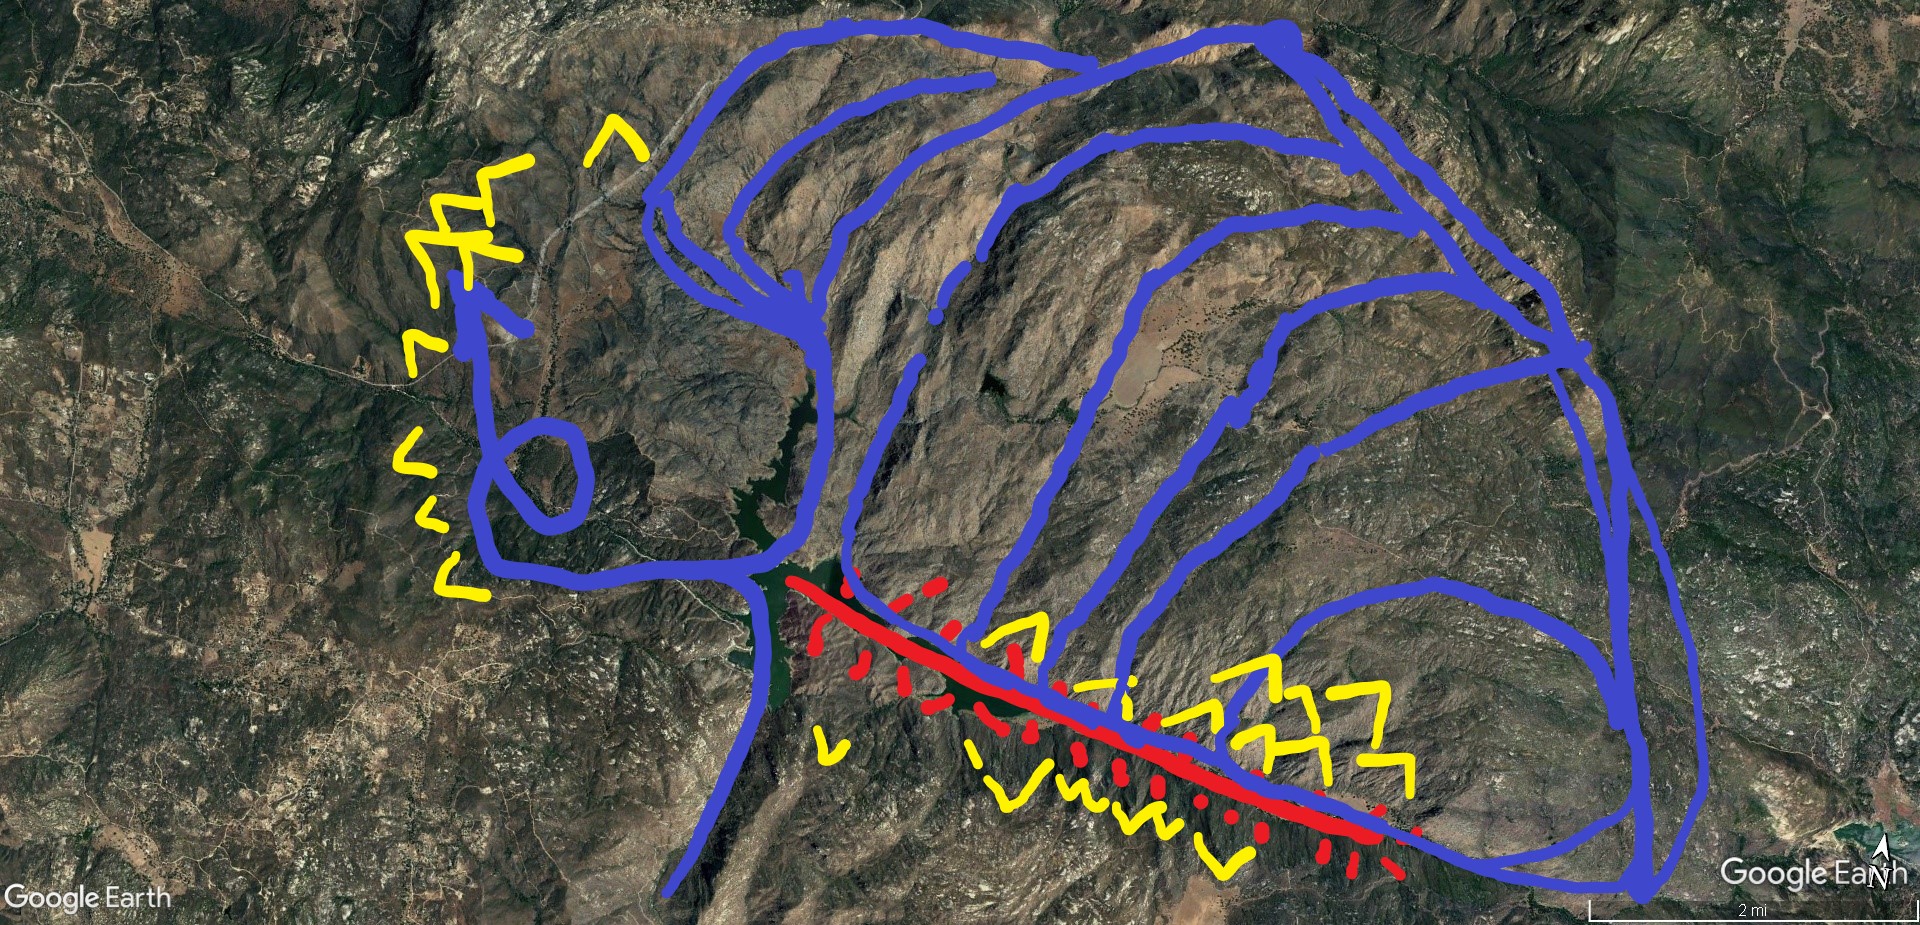
Please look at Figure 2 carefully and you will see more than just the shape of a bird in flight. There are details that can’t be ignored. Yet somehow they have been, even though it’s right there on Google Earth. It is ignored because it is evidence of intelligent design.
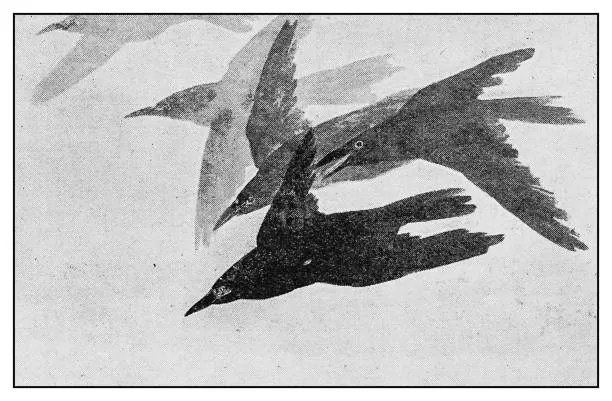
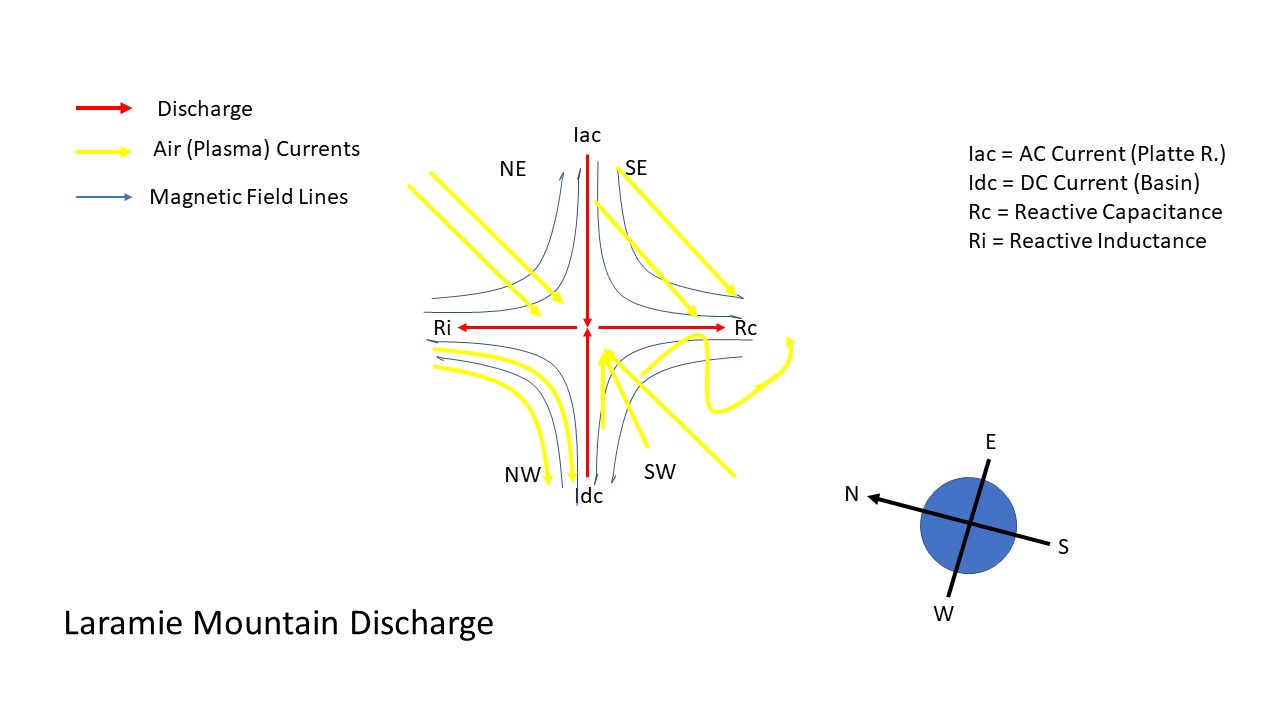
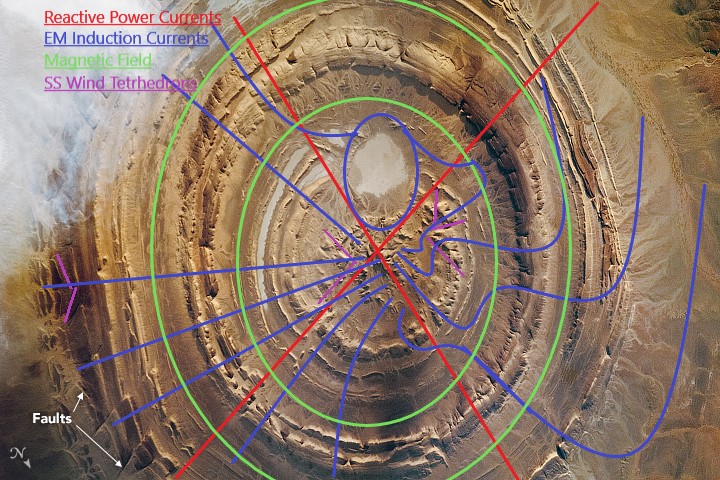
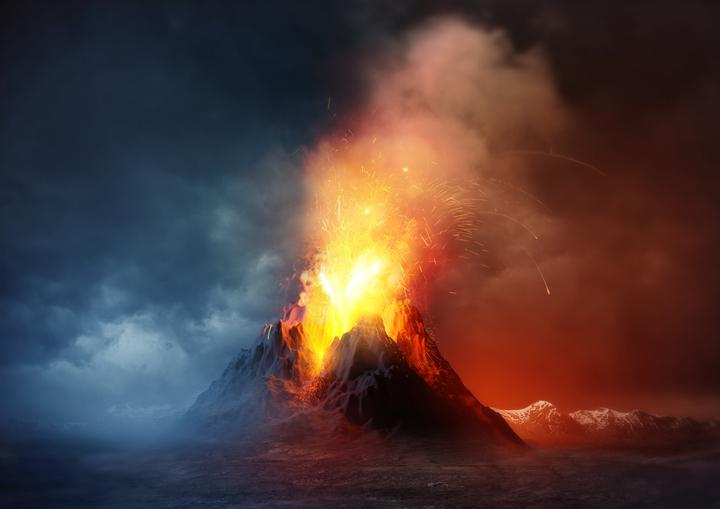
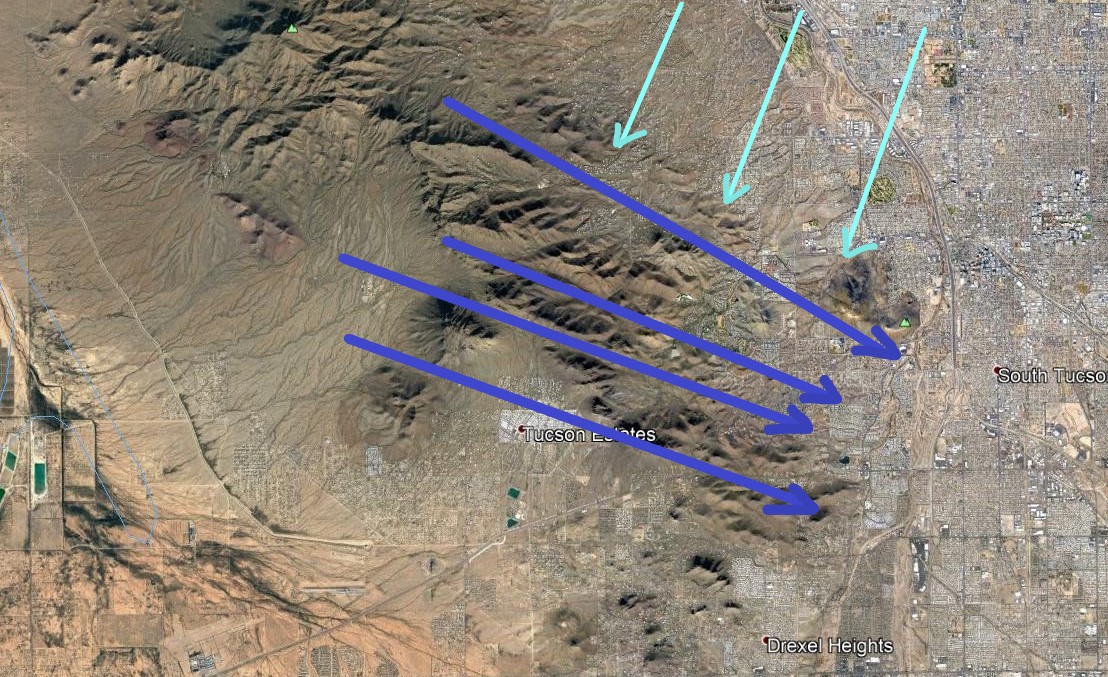
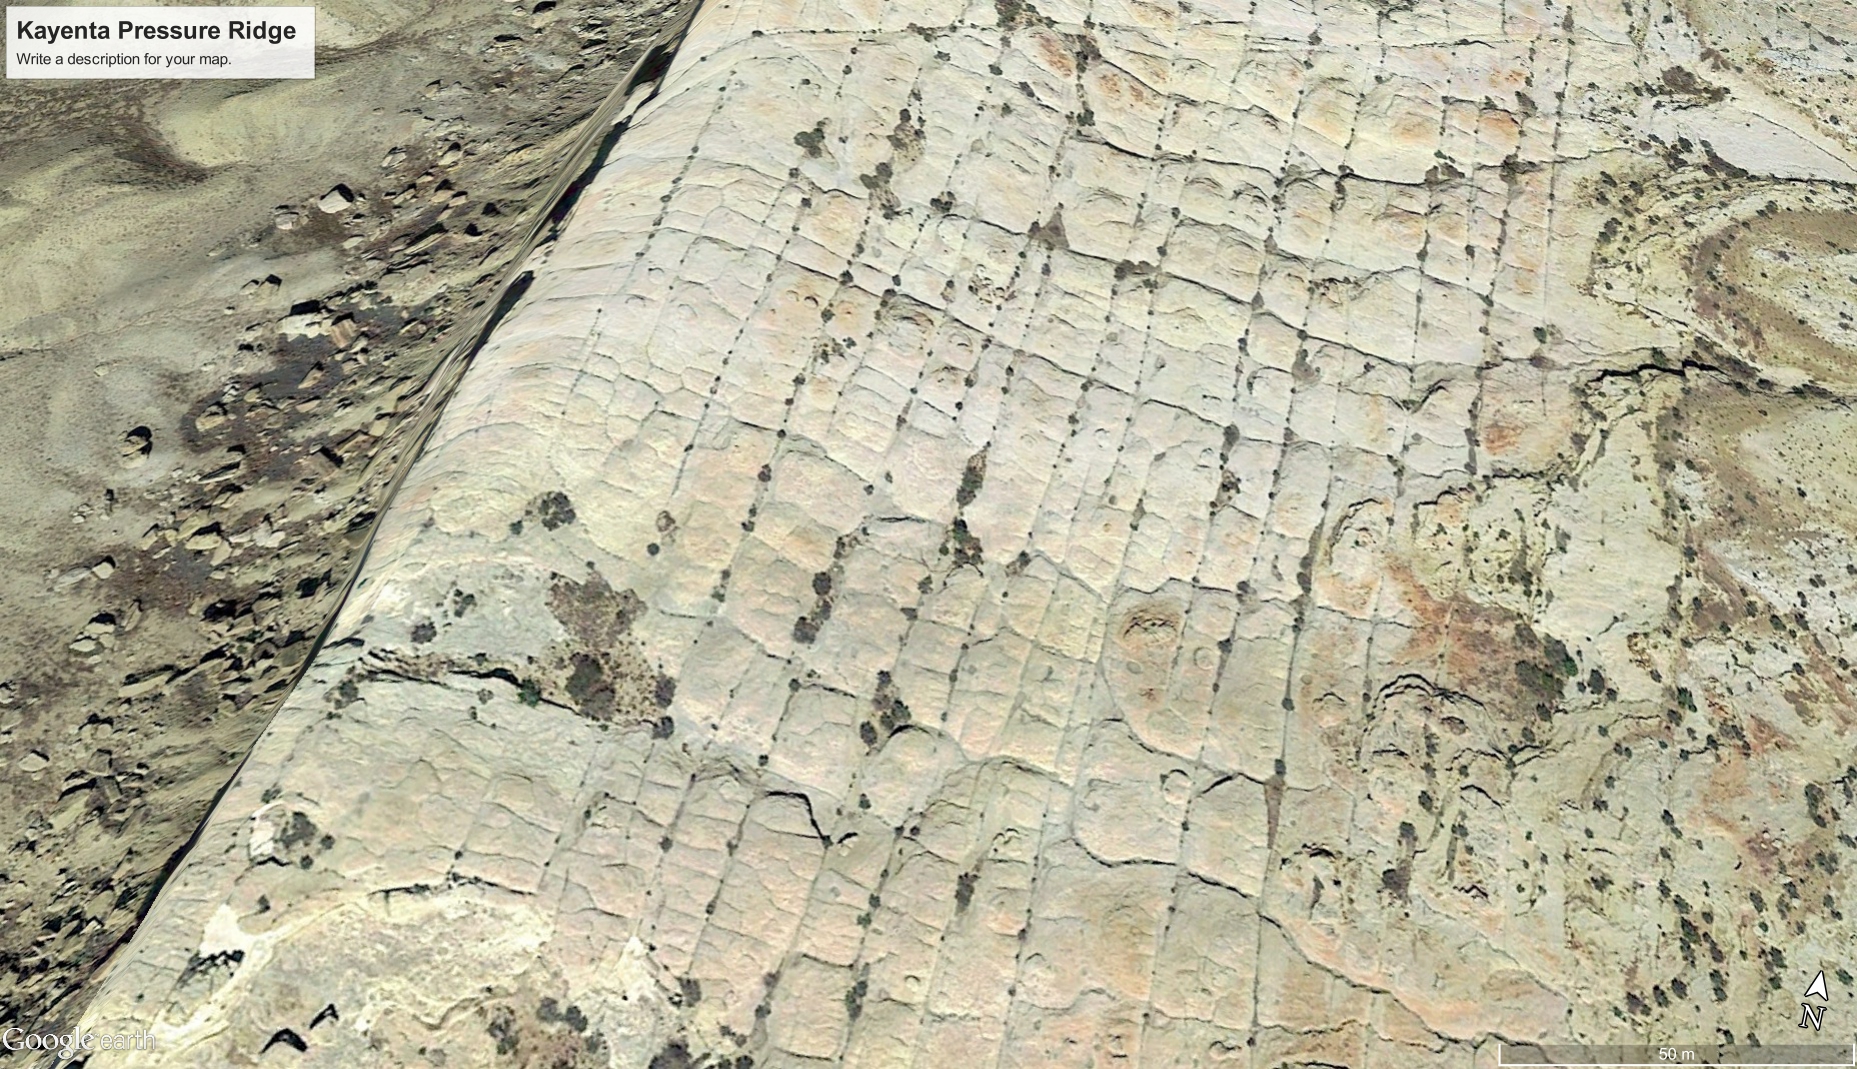
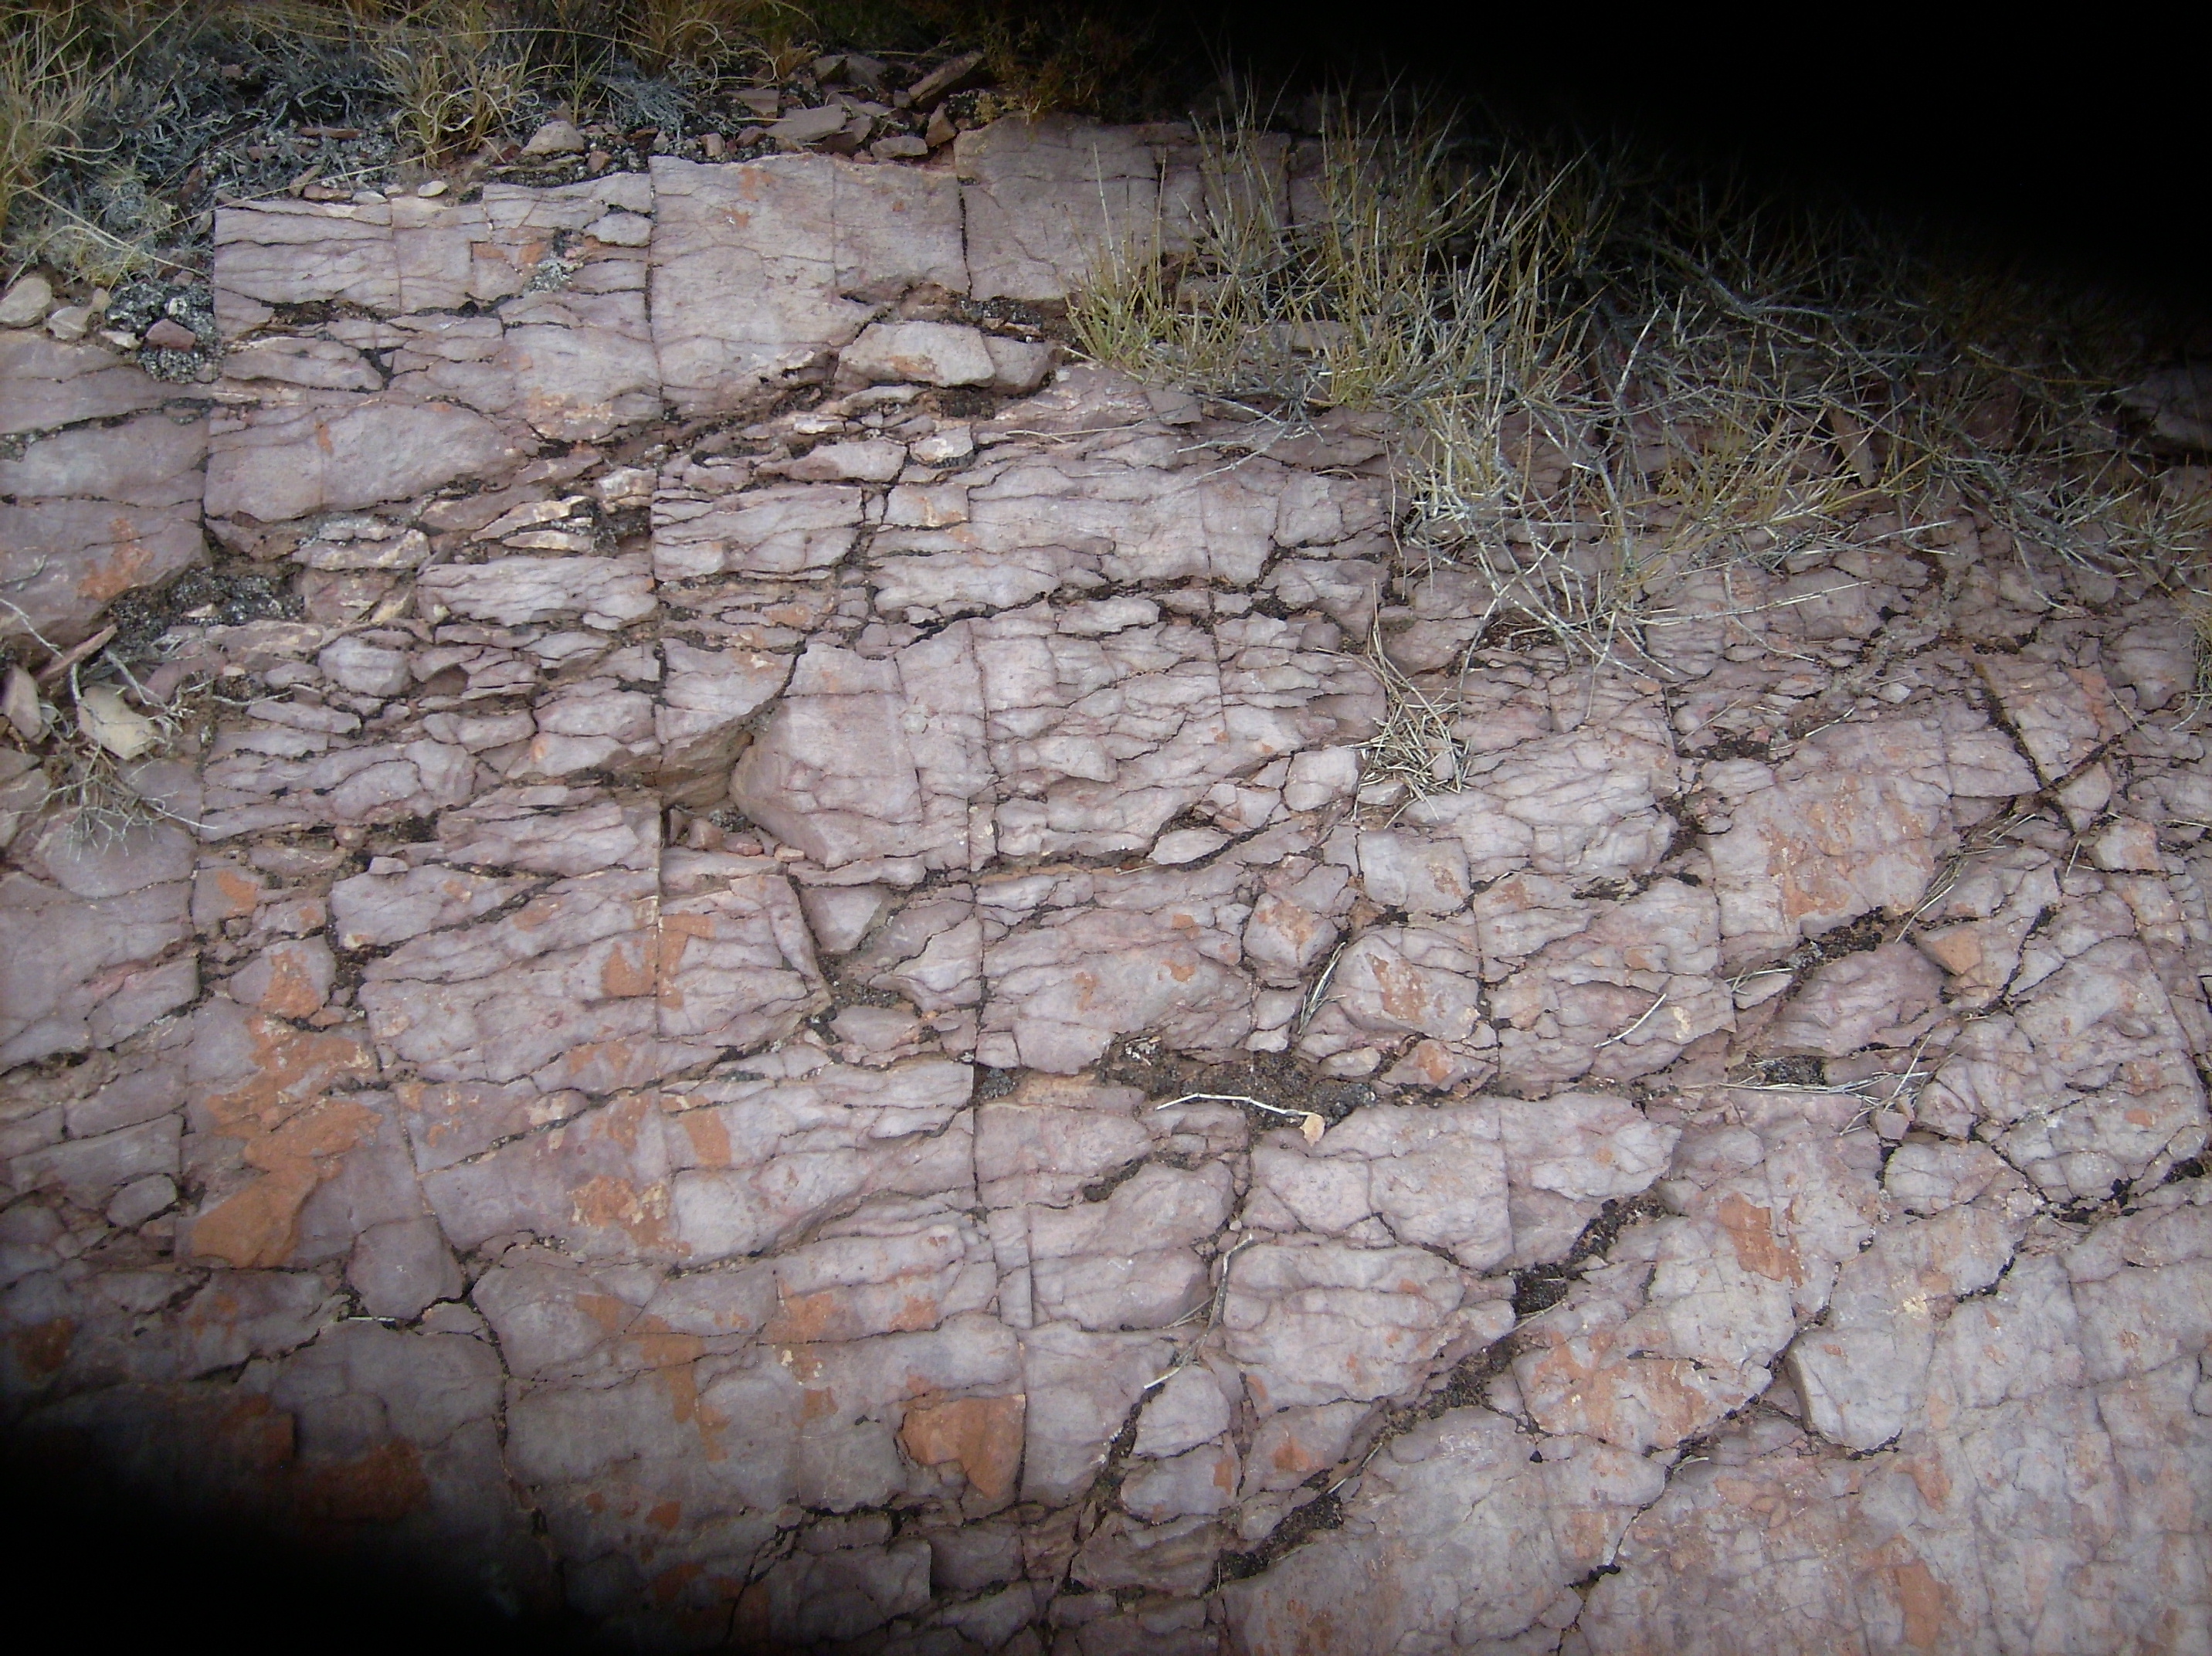
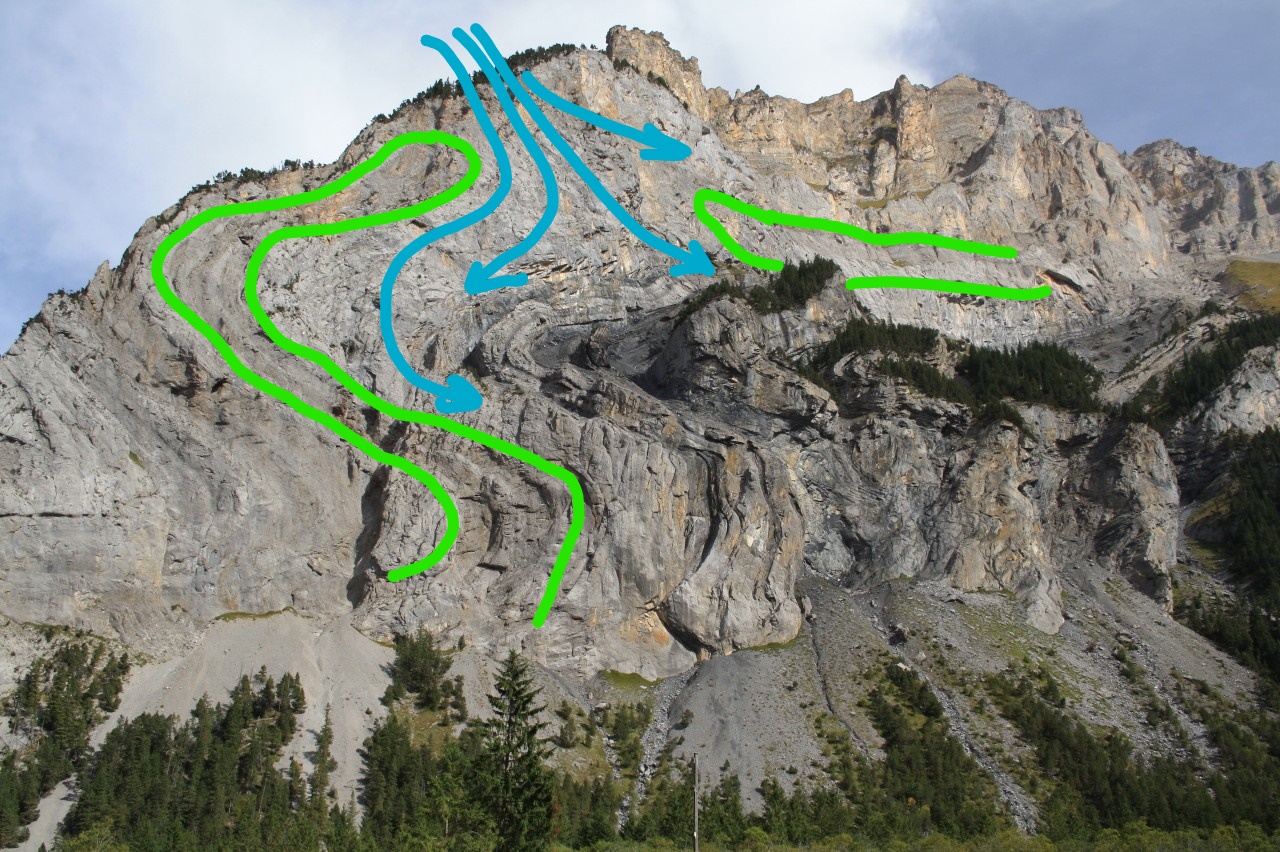
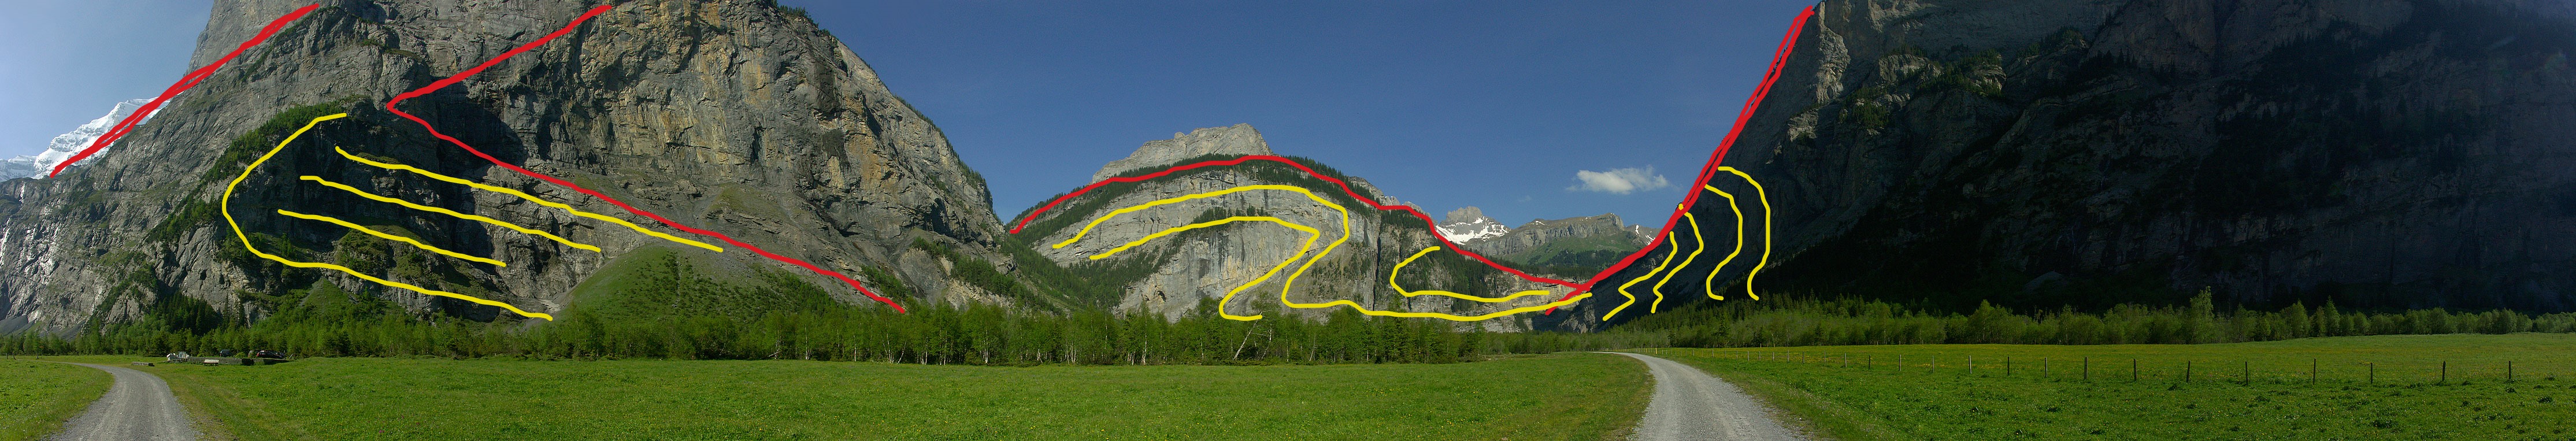
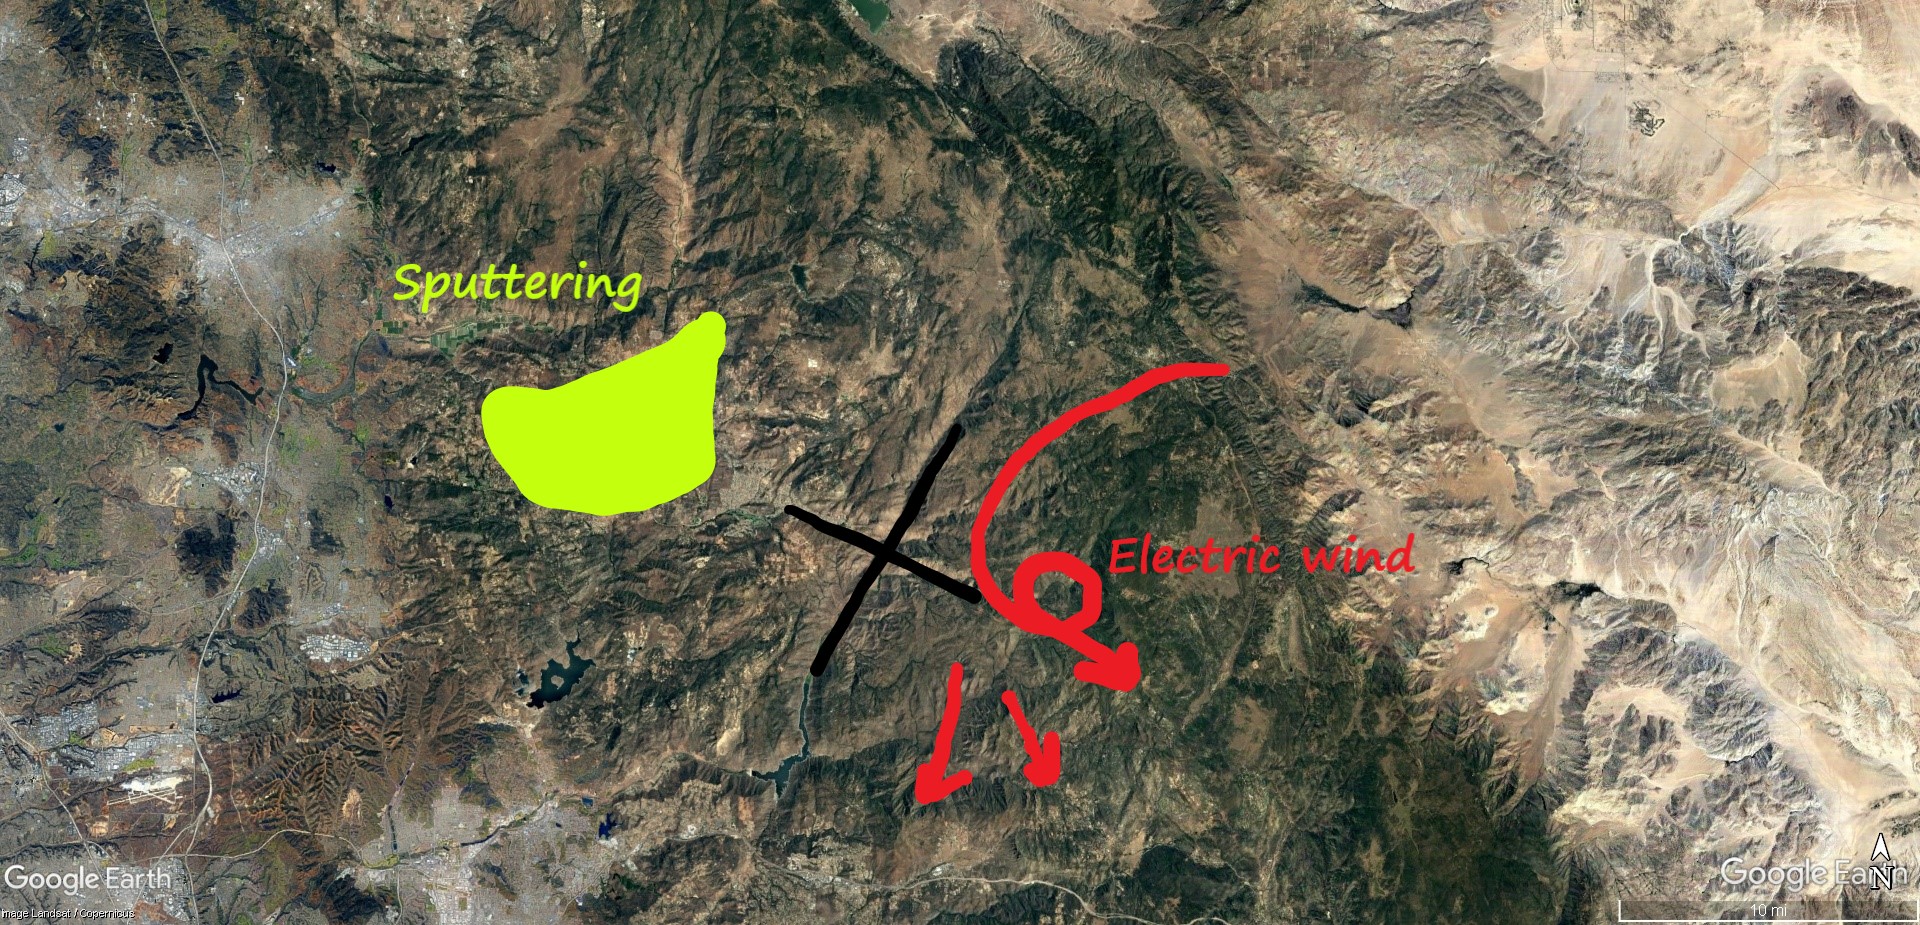
The songbird is but one example of the hologram and how harmony scales information fractally. The bird is almost entirely composed of pressure ridges formed by plasma winds, lightning and volcanic eruptions. The plasma wind was inducted by ground currents to blow orthogonally across them to create the many pressure ridges. It is an electromagnetic interference pattern caused by capacitance between the ground and atmospheric phases of moving charge concentrations in a plasma storm. It is, by my definition, a holographic interference pattern of electromagnetic energy sourced from the Earth. Telluric currents that reach deep into the Earth shaped this bird.
It was an interaction of wind, volcanoes and lightning that, according to “science” should be chaotic and random. An electrical coupling of Earth and sky by capacitance – the spherical capacitance of the Earth – holds a mirror to the Earth’s inner energy. It isn’t random. This is “as above, so below” writ large. We are seeing the “spirit” of the Andes laid bare.
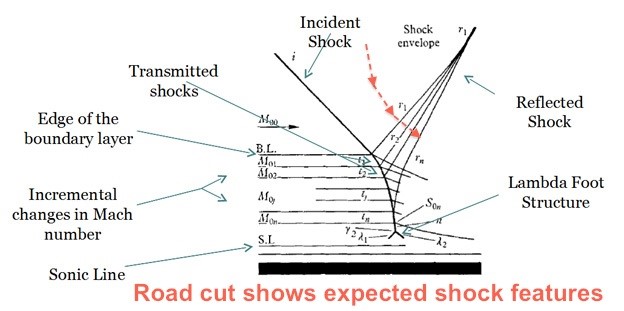
I can describe in detail how the wind blew to form each mountain, the vectors and Mach speeds, and what kind of storm generated the winds, but I’ve done that before several times with mountains like these, so I don’t want to repeat that effort now. I want to point out that all the information about the energy that created this bird is still there, available to read by anyone.
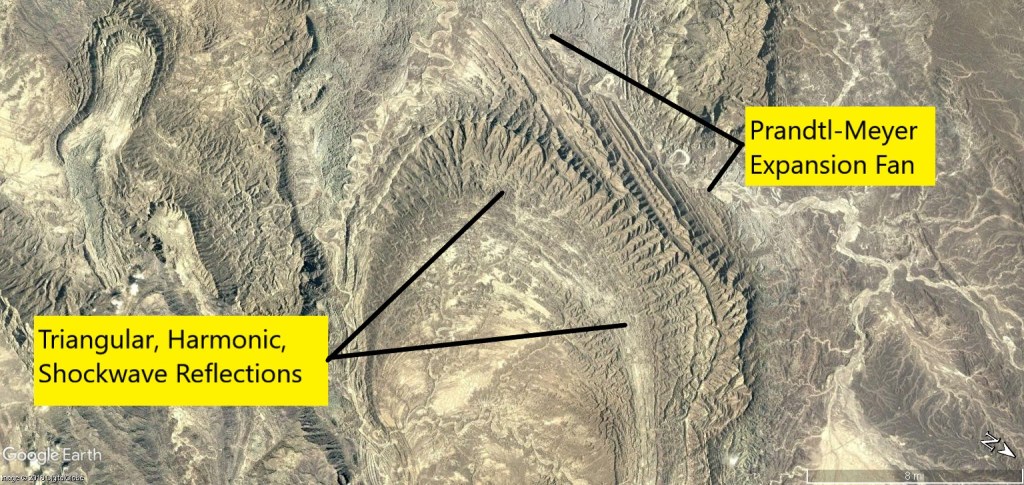
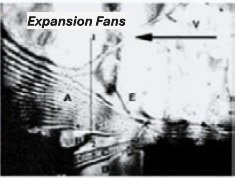
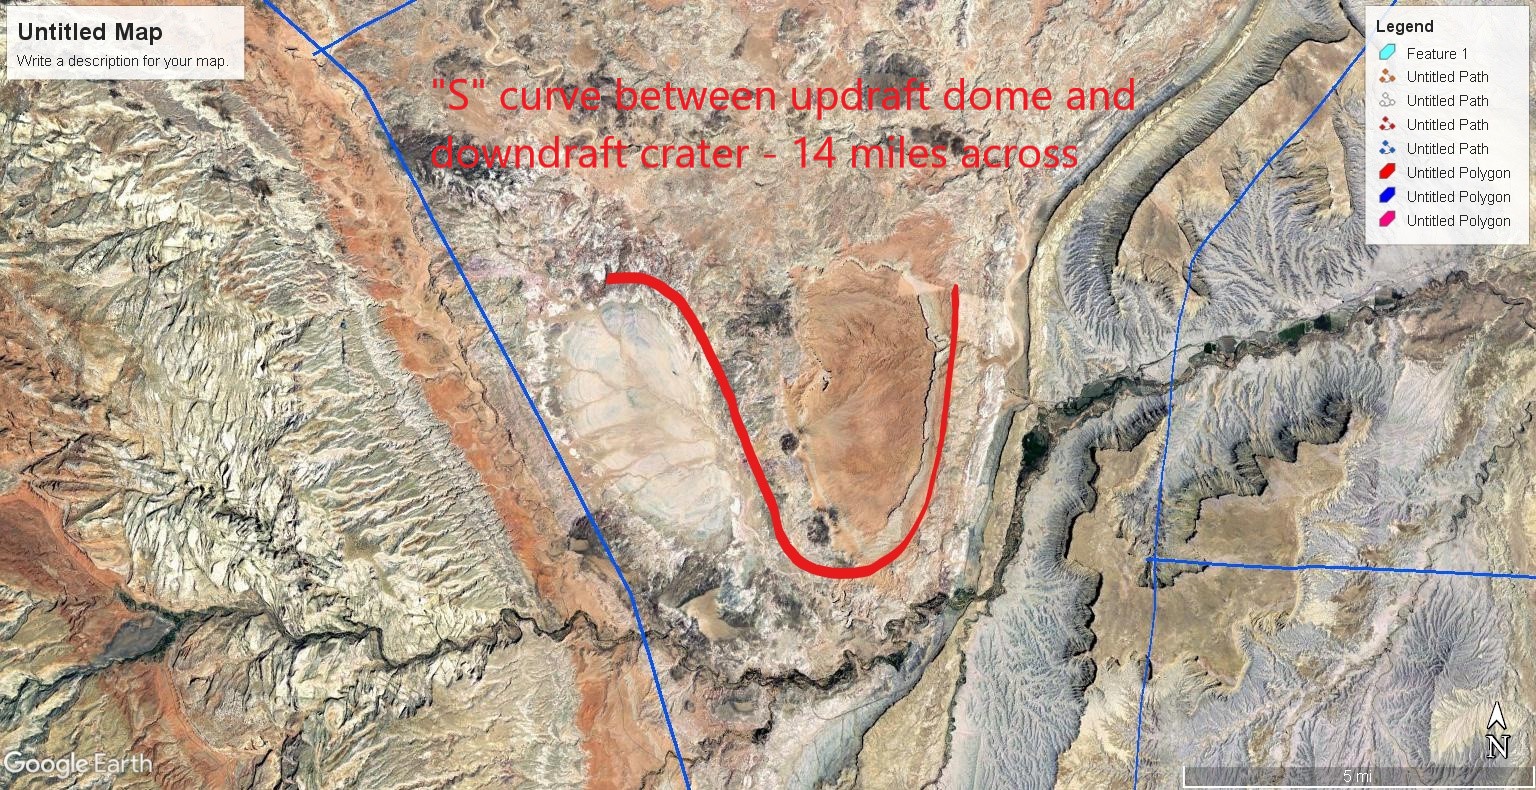
We can read the landscape and identify volcanoes, discharge craters, sputtered and etched canyons, places where the Earth boiled with electrolysis and dunes shaped by shock waves in supersonic plasma winds, but it is hard to find words to explain this bird. The only word that even applies is “holographic”.
As said by 17th century polymath Blaise Pascal, “The last function of reason is to realize that there are an infinity of things that surpass it.”
From ants to plants, electricity has a role in growth, locomotion and communication in the natural world that science is only beginning to become aware of. Our moods, energy and state of awareness is controlled by frequencies in our electromagnetic brainwaves. We swim in energies we don’t see that affect us in ways we aren’t aware of.
Consensus science is theory based on a “space-time” framework. The entire framework is based on mathematics that aren’t in Nature. Singularities, monopoles, strings and extra dimensions may make beautiful math, but they don’t exist as real things. The result is it produces no technology, or knowledge useful to mankind and never has.
Black holes don’t make better mousetraps. The theories simply produce more theories that circle each other in a cul-de-sac and go nowhere. They need a consensus because they lack anything resembling proof. If you have witness-able proof – the true basis of science – consensus is beside the point.

There is a cognitive dissonance in effect when the four “known forces of Nature” are referred to as “fundamental”. That dissonance is the idea that gravity is somehow separate and distinct from the other three. The other three are all manifestations of electromagnetism at different scales of amplitude and wavelength.
Logically if one looks at Nature, so is gravity. The idea gravity is somehow a bird of a different color separate from the flock is a wild goose chase – pardon the multiplicity of metaphors – that ultimately leads to hunting unicorns, like dark energy. It is asking the wrong question.
All forces are a consequence of one unifying thing: energy. Energy is what is truly “fundamental” to all of Nature that we experience. “What is energy?” is the question that should be asked. That question isn’t asked because it leads to the concept of God.
Cut to the bone, the “Alpha and Omega”, “as above, so below”, “as within, so without”, and all the other esoterica describes cosmic energy. Cosmic energy is the one God to rule all. Energy is the Intelligent Designer.
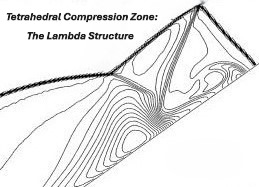
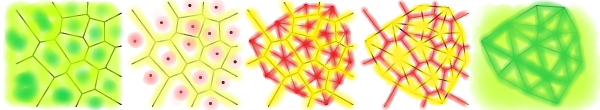
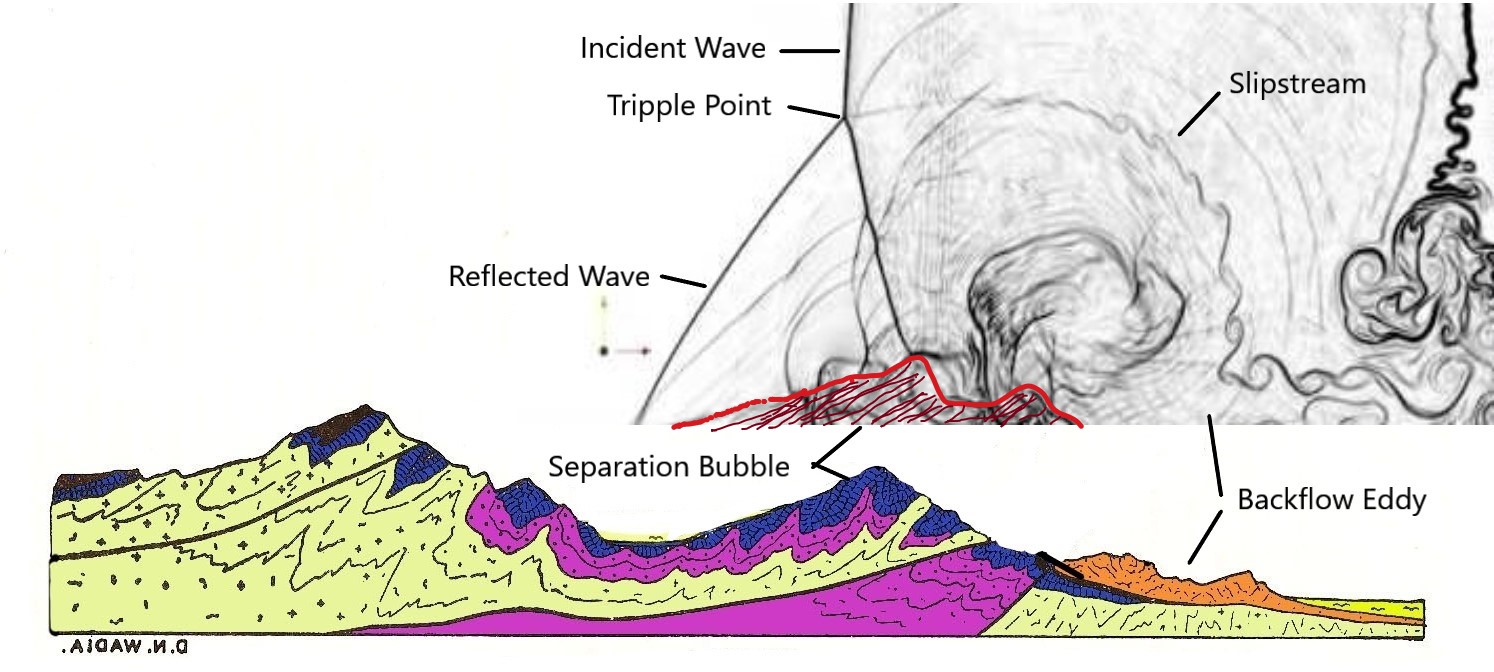
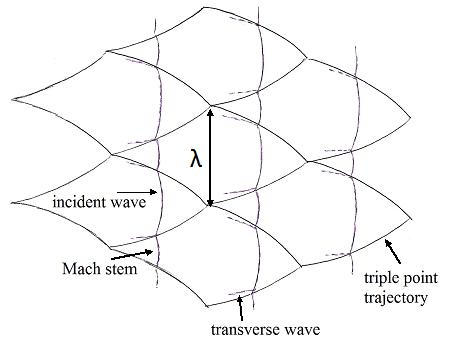
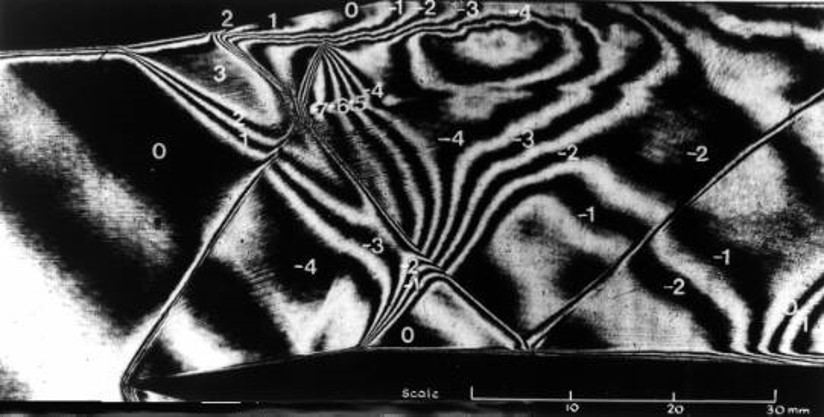
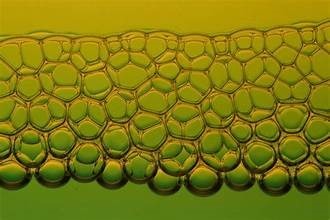
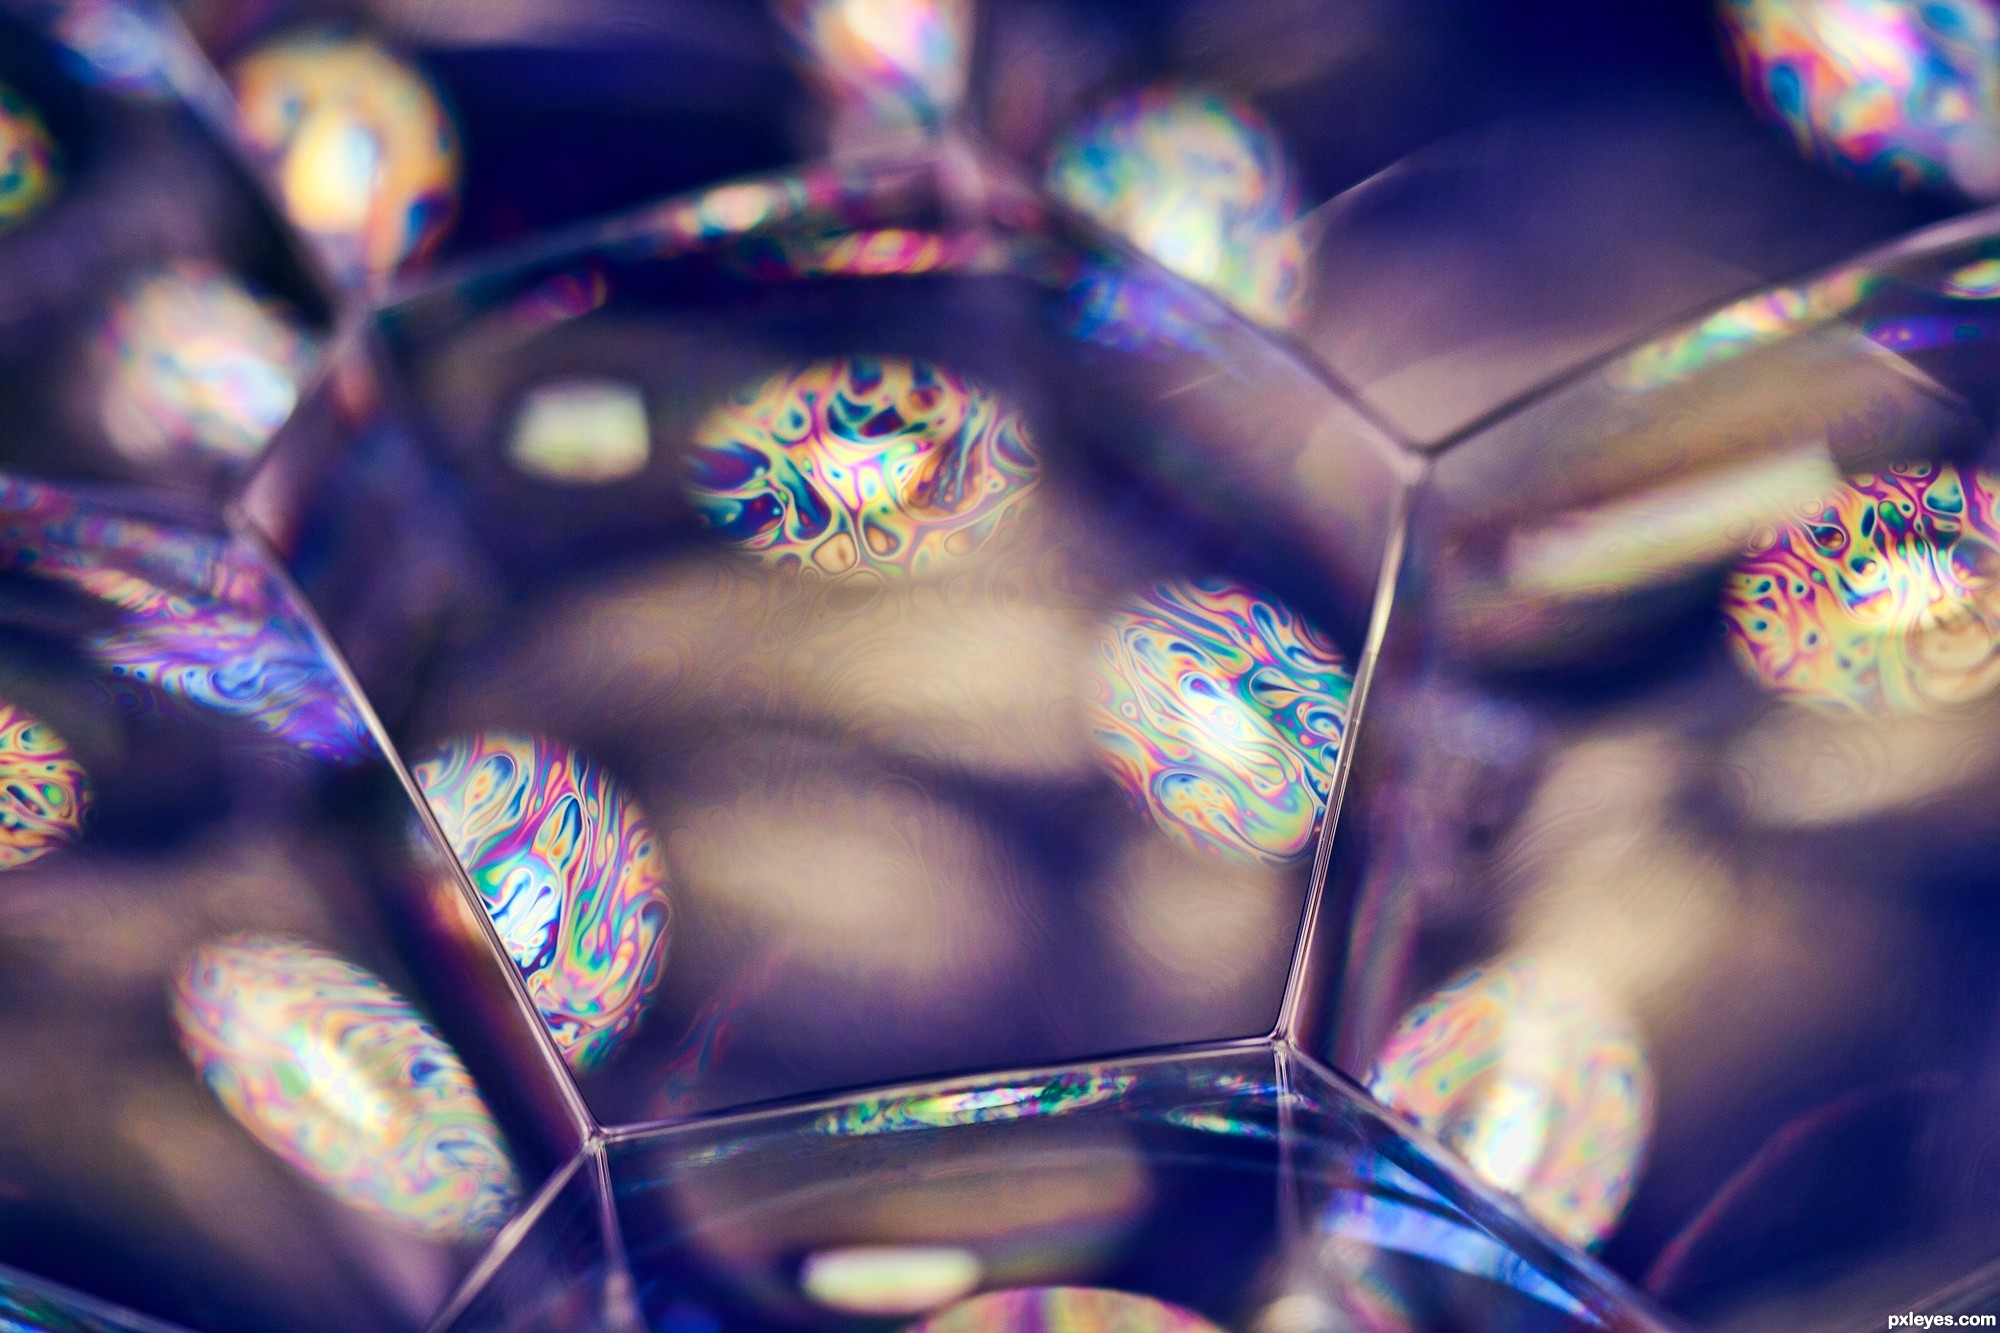
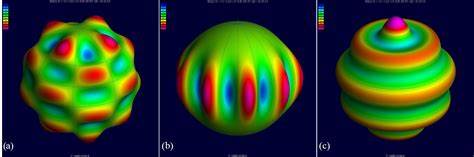
A pure form of energy is given structure by frequency interference. Standing waves of constructive and destructive interference results in a continuous foam of potential energy. It is a pattern of compression and expansion where surface tension forms the compression zones around bubbles of expansion. Surface tension is where most of the energy is stored.
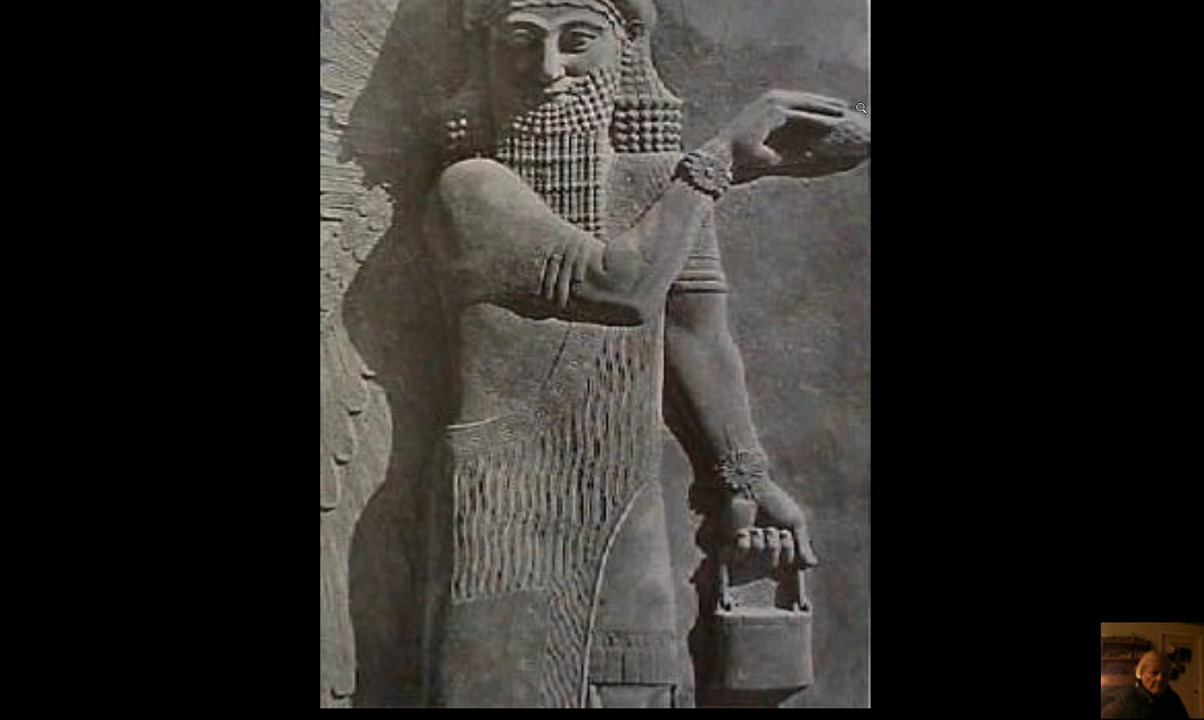
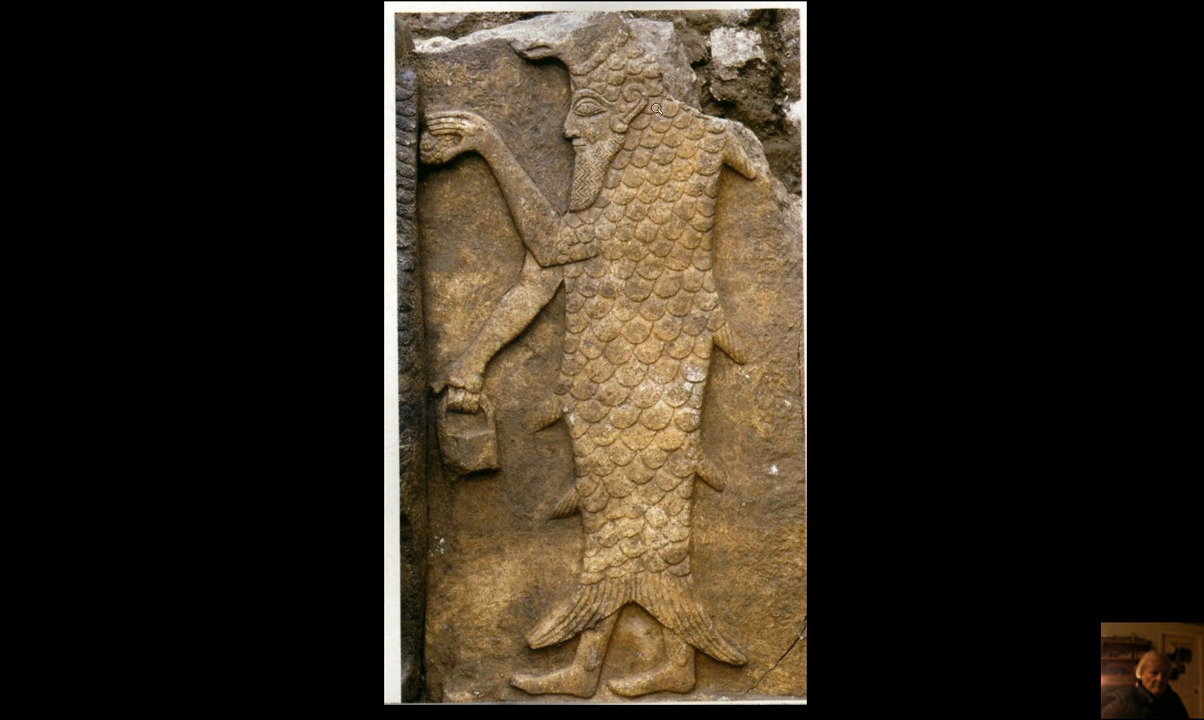
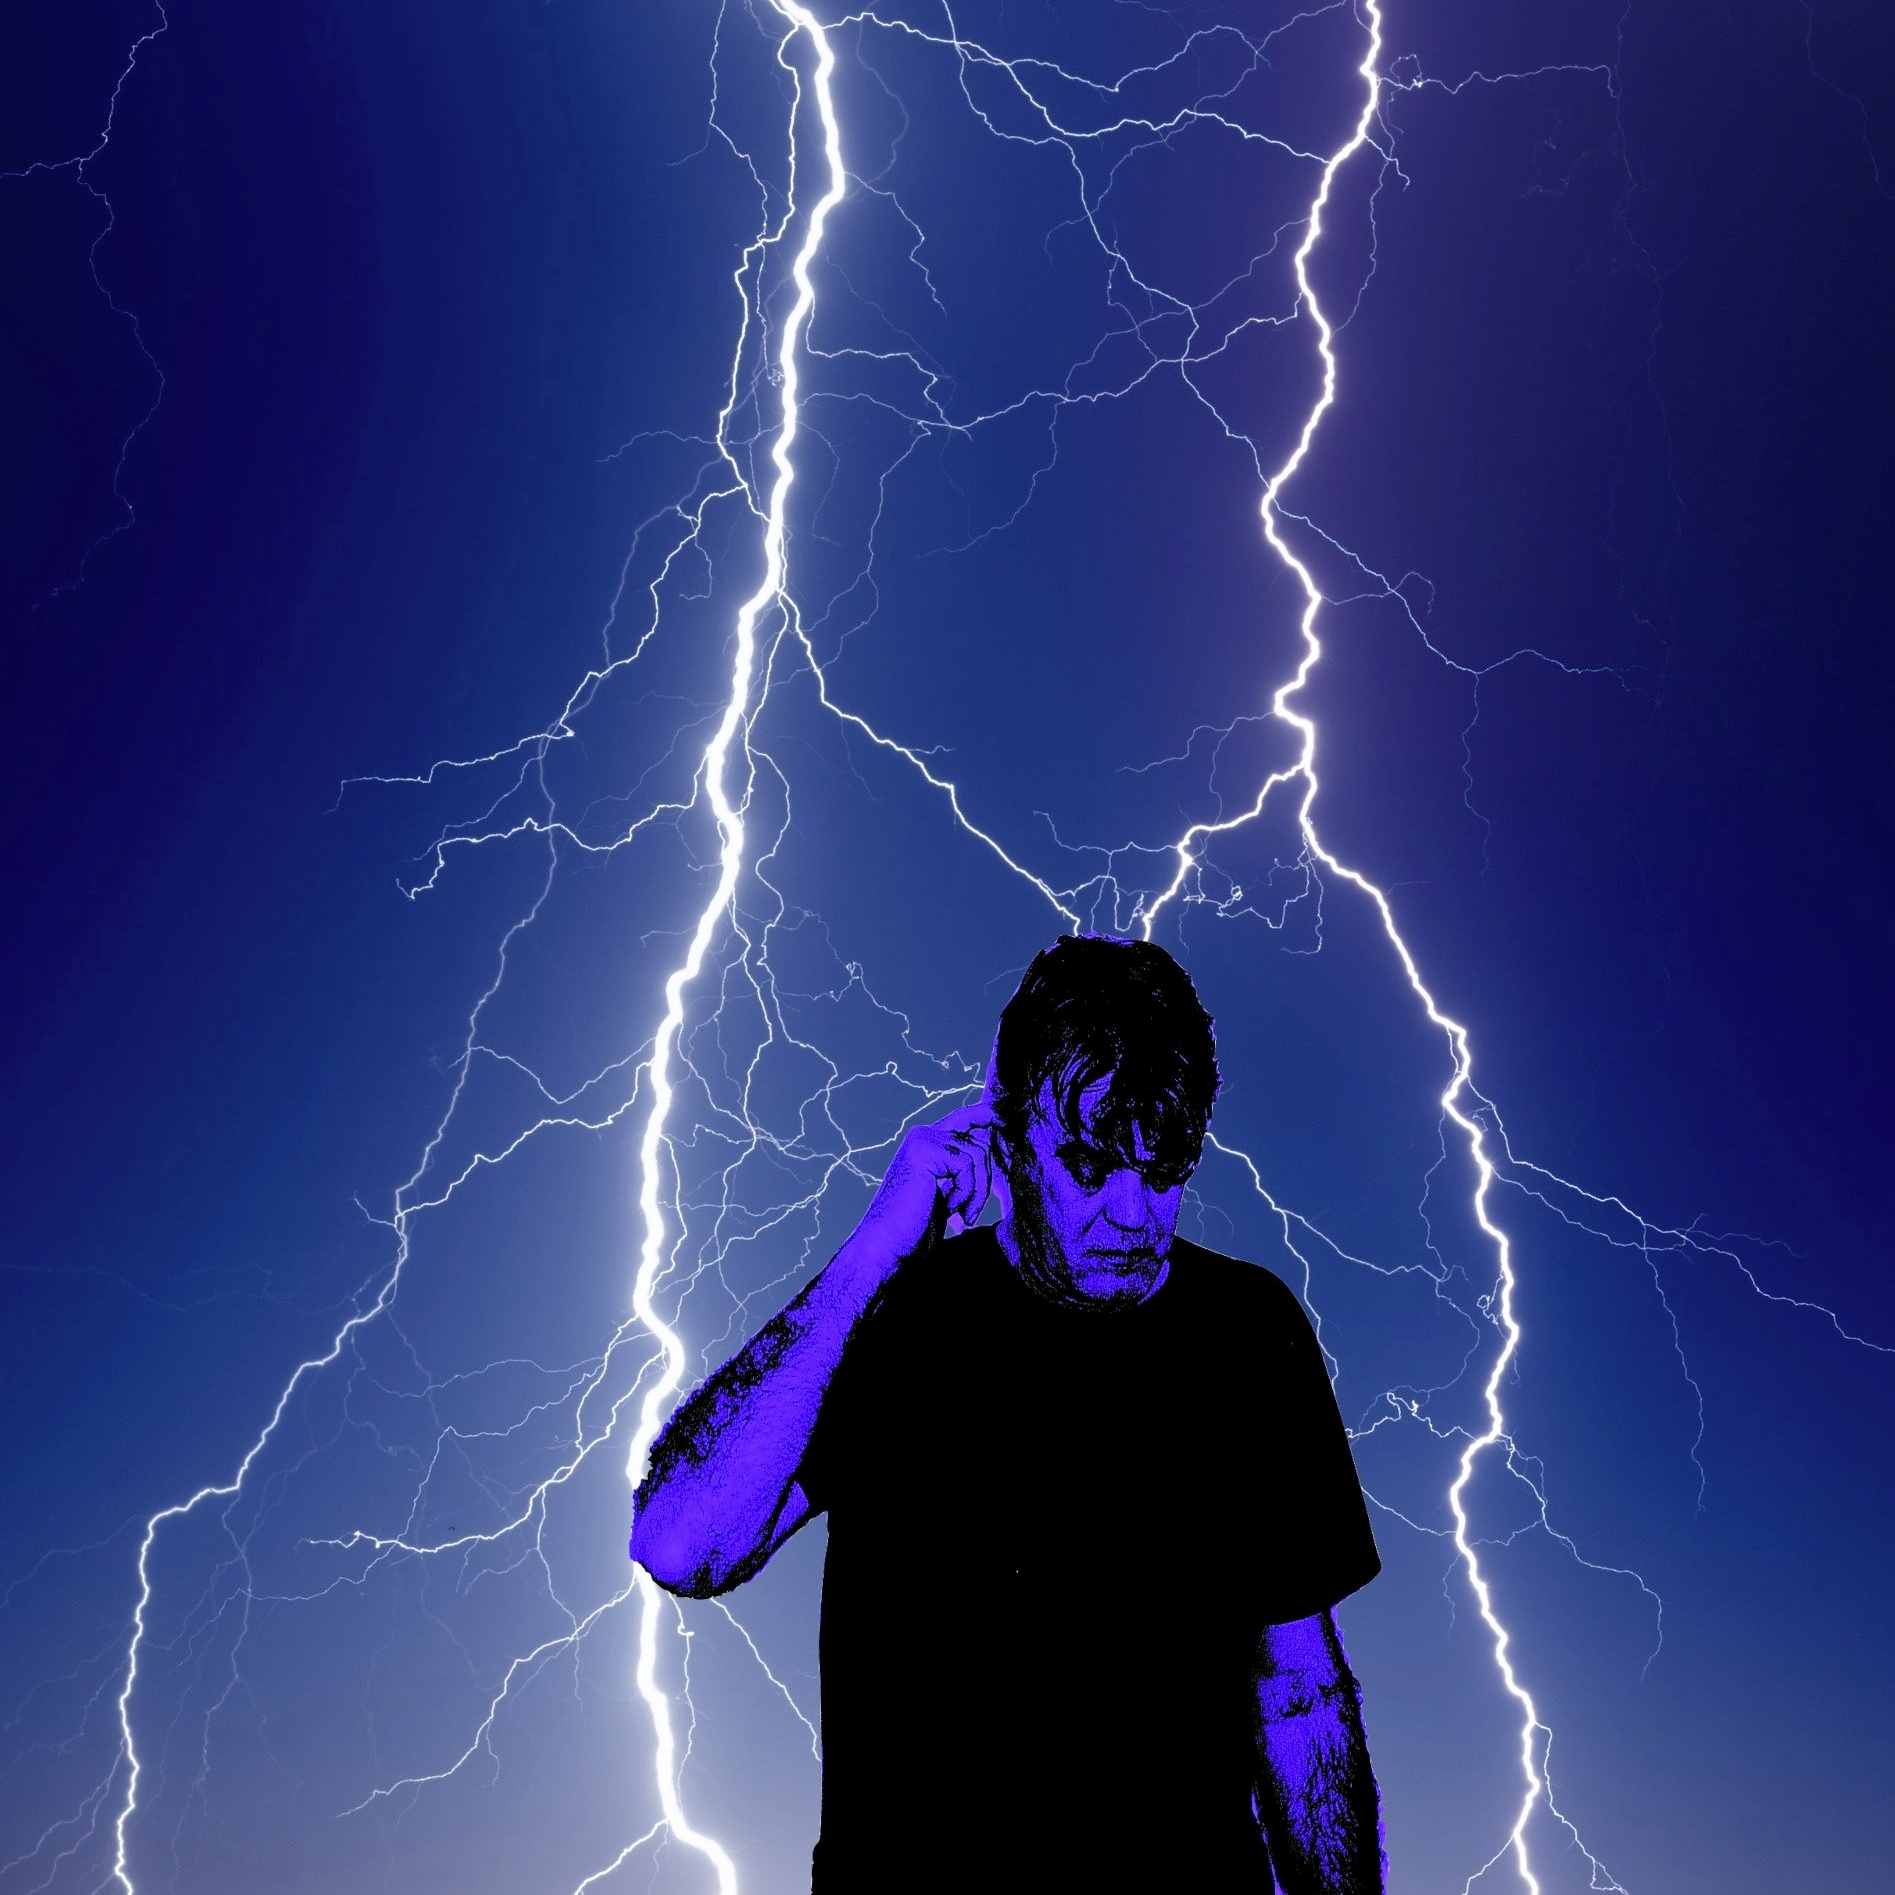
This is what used to be called the Aether, the luminiferous fluid that was considered the “fabric of the universe” throughout history, from the time of Plato to Tesla. Zeus and his Thunderbolt is not simply a “storm god”, it is a direct homage to raw Cosmic energy. Materialistic atheism took firm control in the 20th century and stamped down belief in the aetheric, along with the use of common sense.

The cosmos is filled with frequencies and harmonies we can’t directly observe, like dog whistles our ears can’t hear, or microwaves our eyes can’t see. Solar cycles take decades to evolve that produce harmonics over millennia. Those frequencies and harmonies are where the mysteries lie, but there are no “extra dimensions”, there are no “black holes” and there are no theoretical “strings” attached.
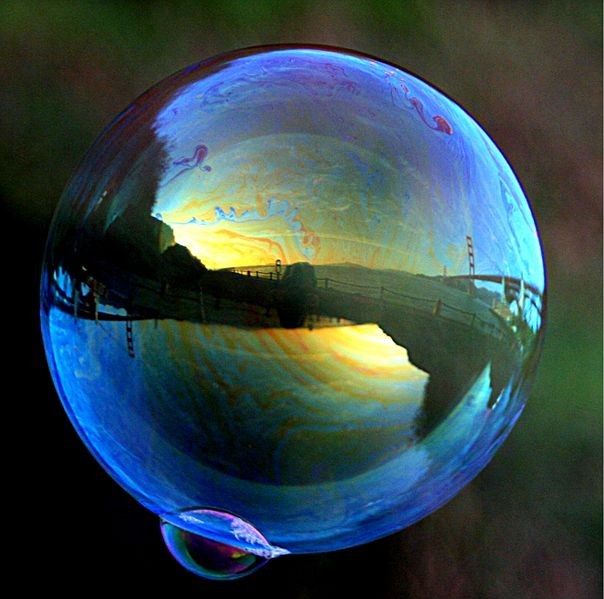
Similar to how soap bubbles reflecting light can look like steel balls – not hollow spheres – materialist’s imaginations fail to grasp that matter is just more energy inside a bubble. They can break them apart and see what splashes out, but the frequency of the raw energy locked inside the bubble is beyond the reach of their instruments, so they perceive a “particle” and modify it with notions of “duality” to explain why it doesn’t act like a particle. Their failure to comprehend isn’t for lack of data, it’s from inventing mathematics that does not reflect actual Nature.

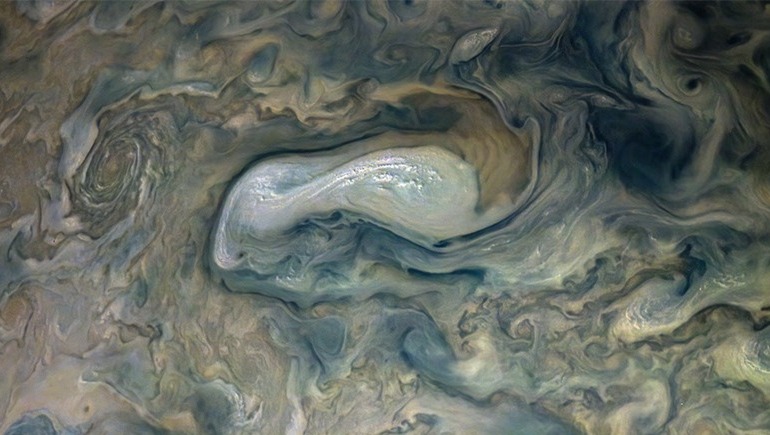
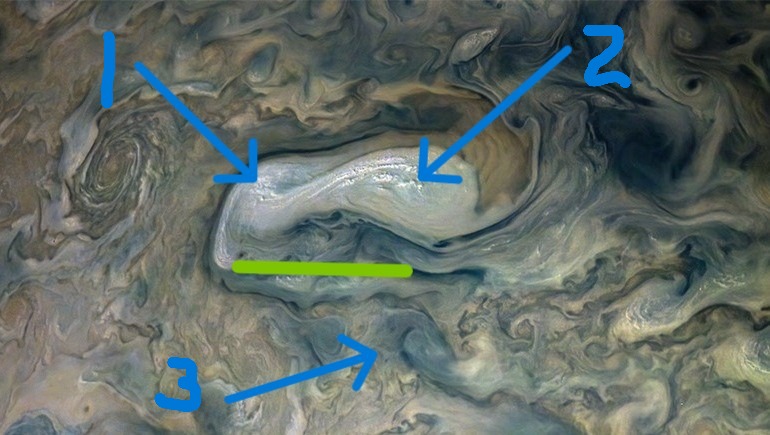
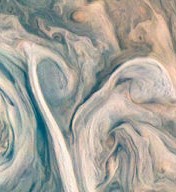
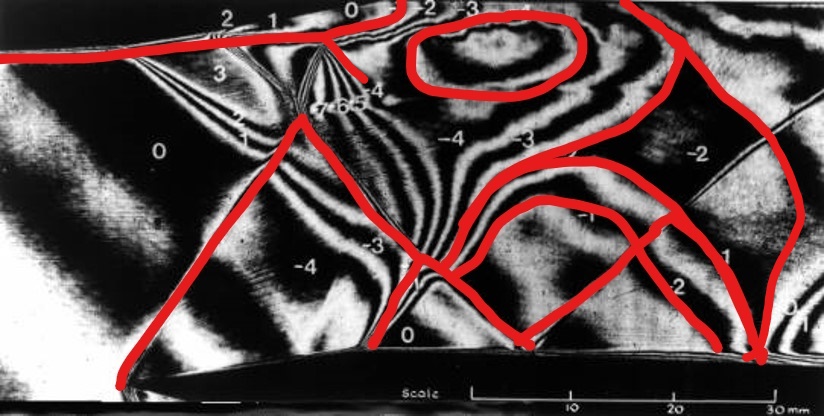
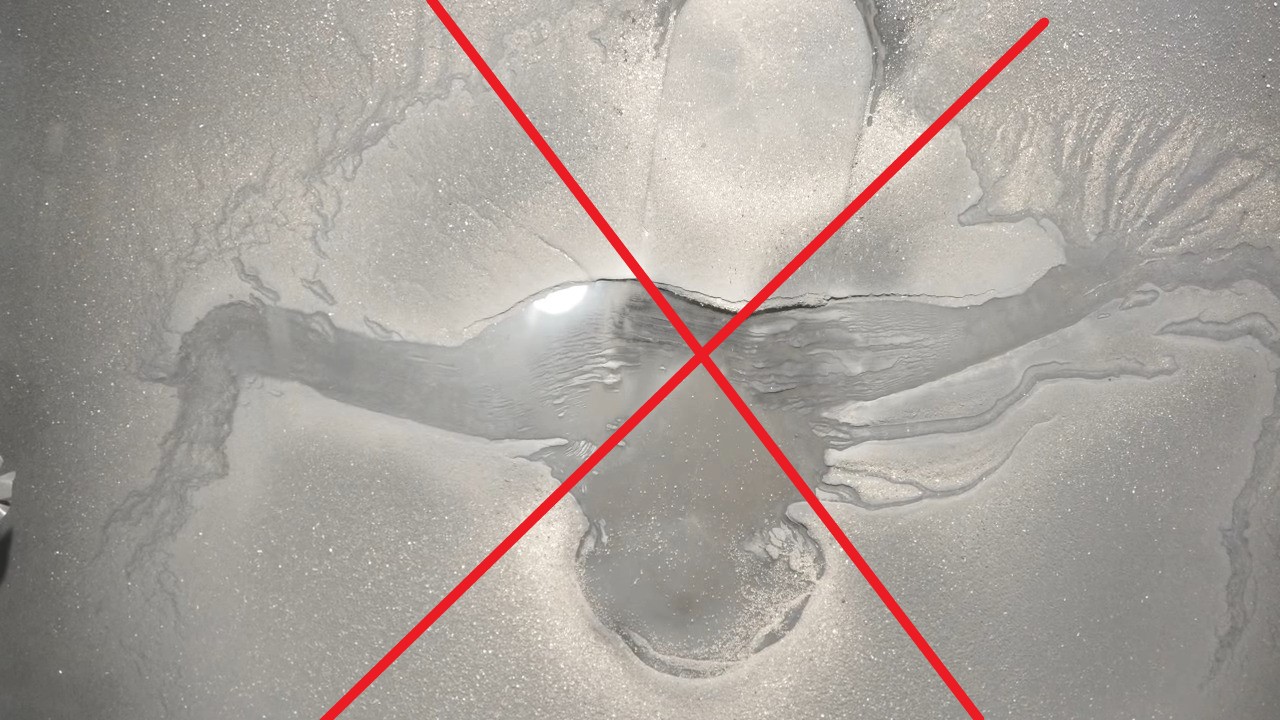
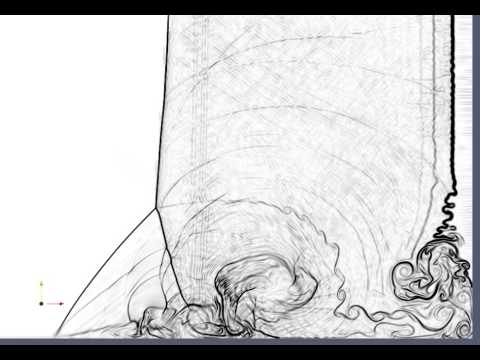
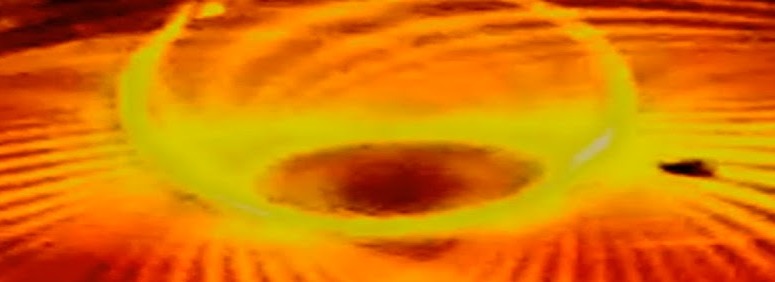
A standing wave is a volume of potential energy. Consider the drop of water in Figure 13. It is a singular drop that emerged from a superposition of waves and just de-cohered from it’s parent waveform. It is a drop of potential energy. Such is a particle.
The particle retains the structure, momentum and information of the parent waveform, but energy filling the space inside the bubble is in a closed circuit at frequencies instruments can’t follow. They can’t pin it down and measure it like a grain of sand any more than they could find one inside the drop of water.
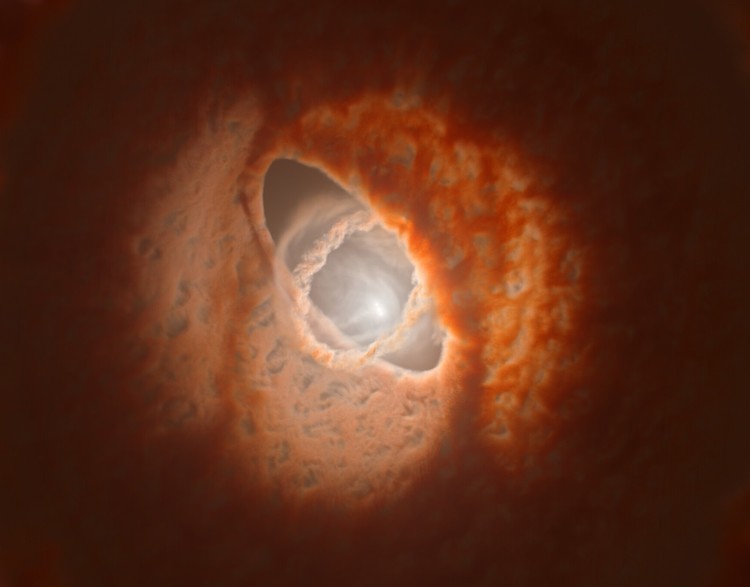
The drop of water is an analogy that lacks the charge and structure of electromagnetism. More appropriately, a plasmoid created by “Z-pinch” provides a better model for a singular bubble in the aether.
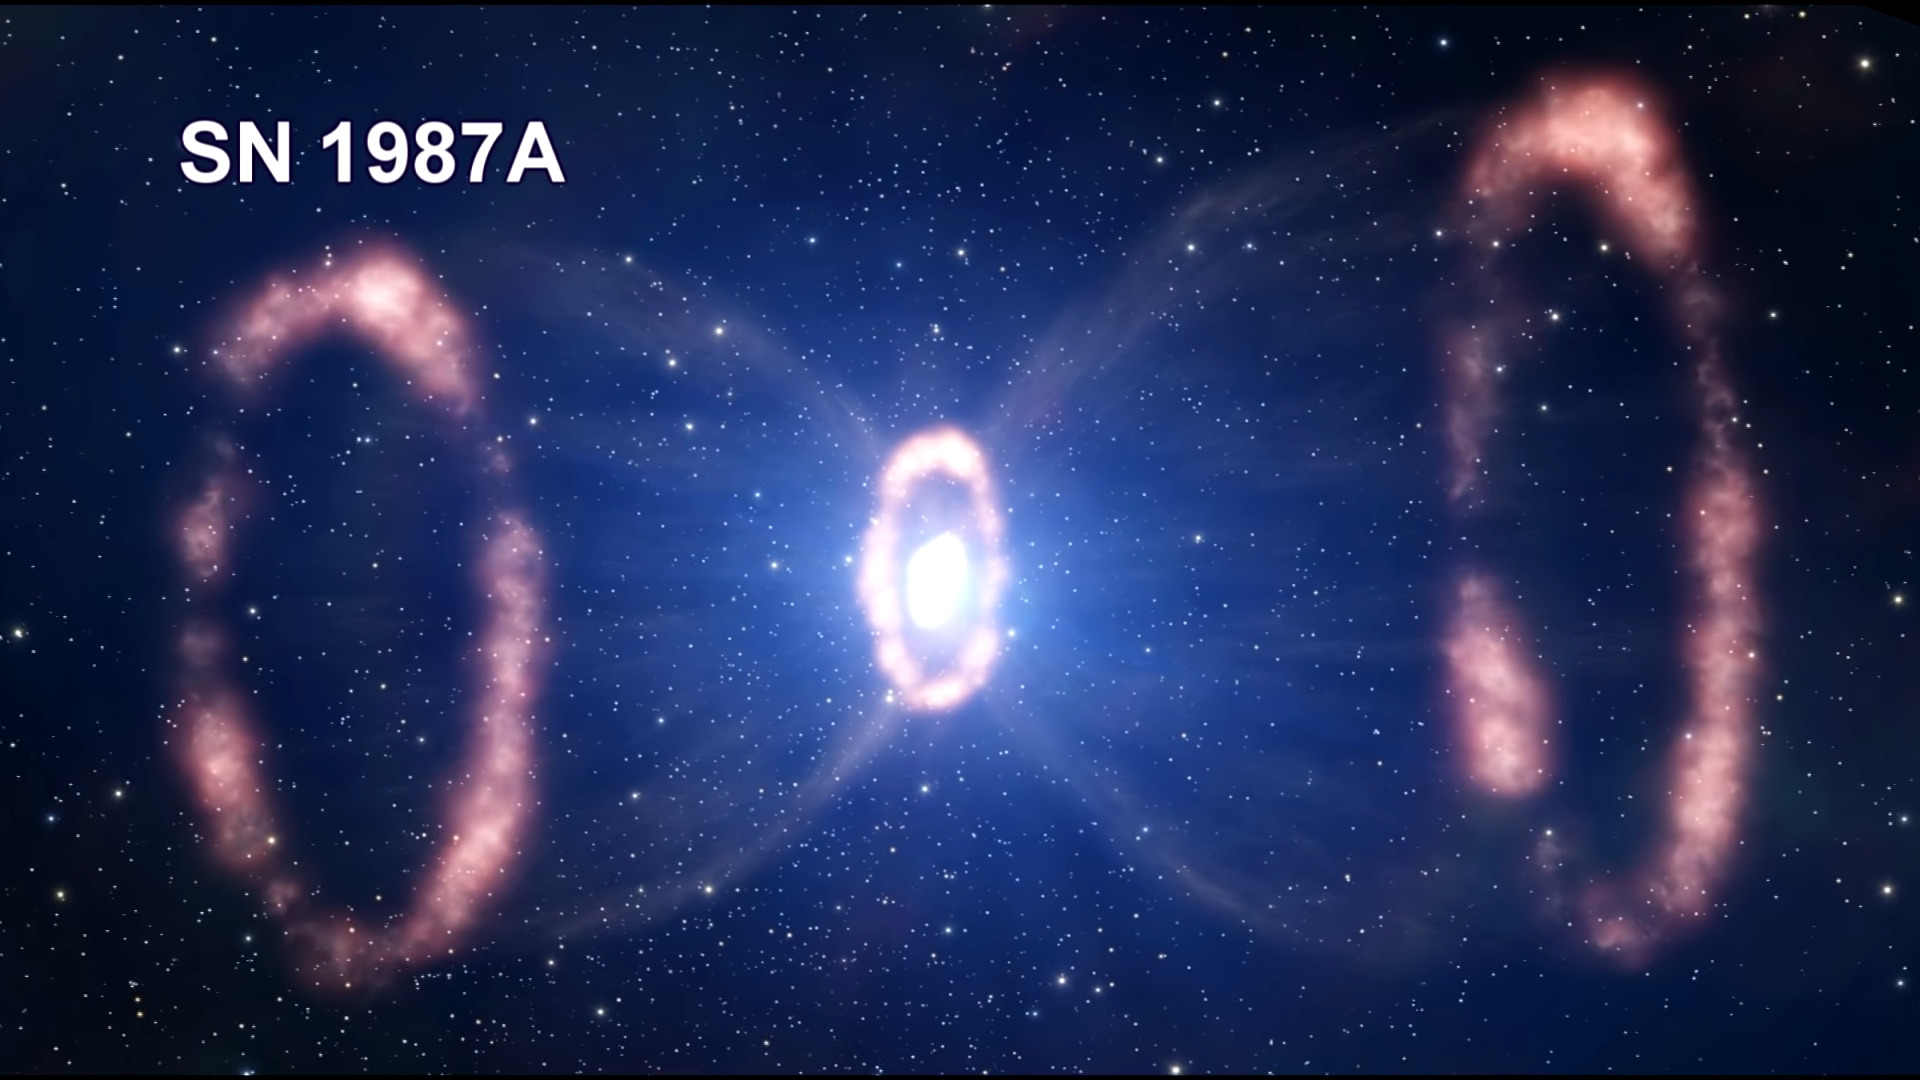
Energy structures itself through harmonic resonances that holographically scale as a fractal phenomenon. In other words, circuitry follows the same patterns at every scale. Therefore, the form of a star reflects the form of an element of the aether, just as it reflects the form of a galaxy, a living planet, or even a thunderstorm. Not in a material sense, not in it’s observable shape, but as a circuit. It is the pattern energy self-organizes into naturally, and mirrors itself again and again, wherever energy flows. Everywhere.
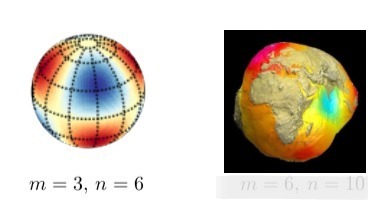
Fractal similarity is a product of circuitry. It’s the circuitry intrinsic to the Aether that is reflected throughout Nature. Circuitry is the shape of energy flow and how energy embodies geometry.
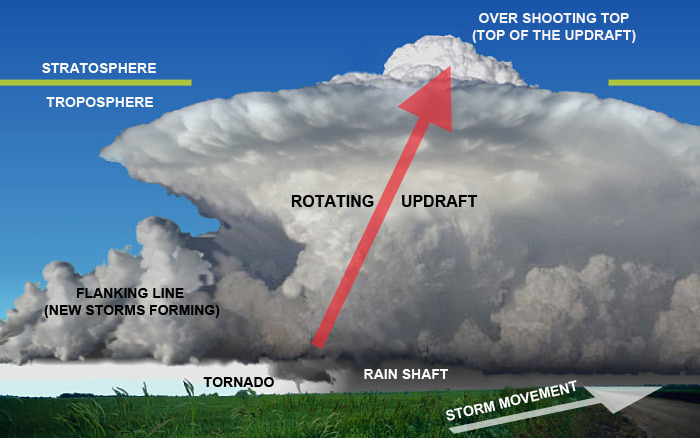
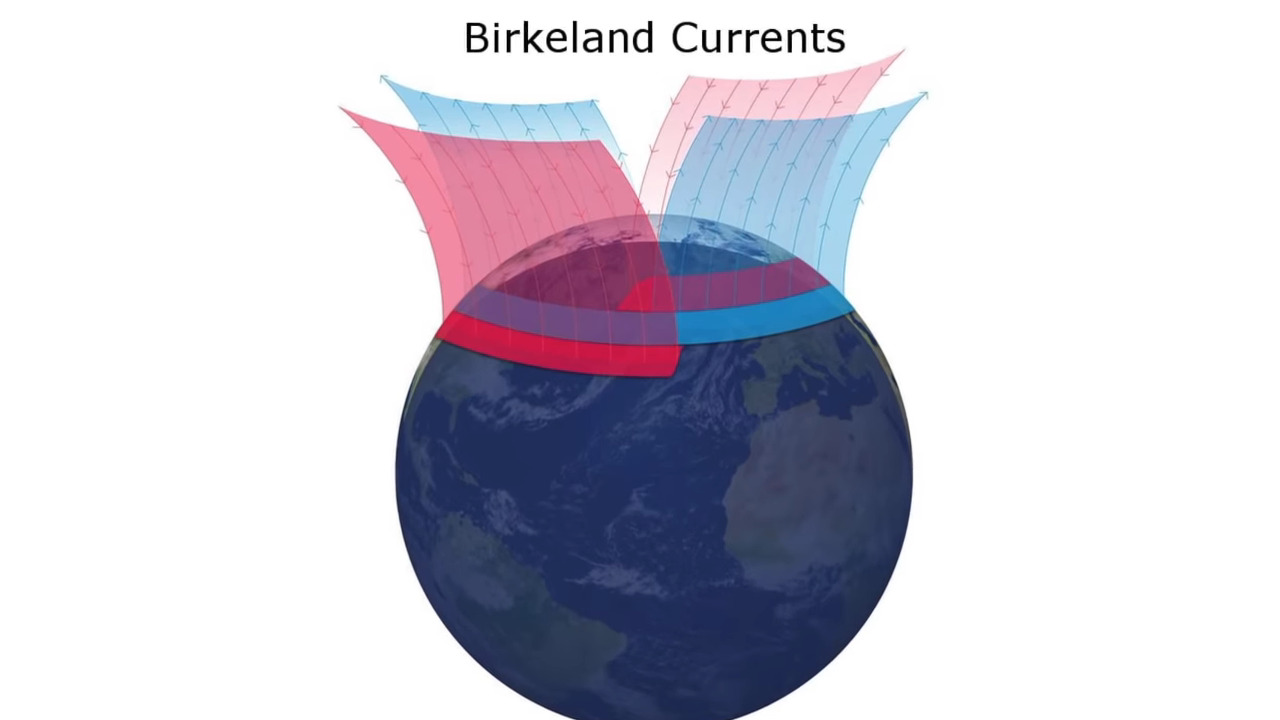
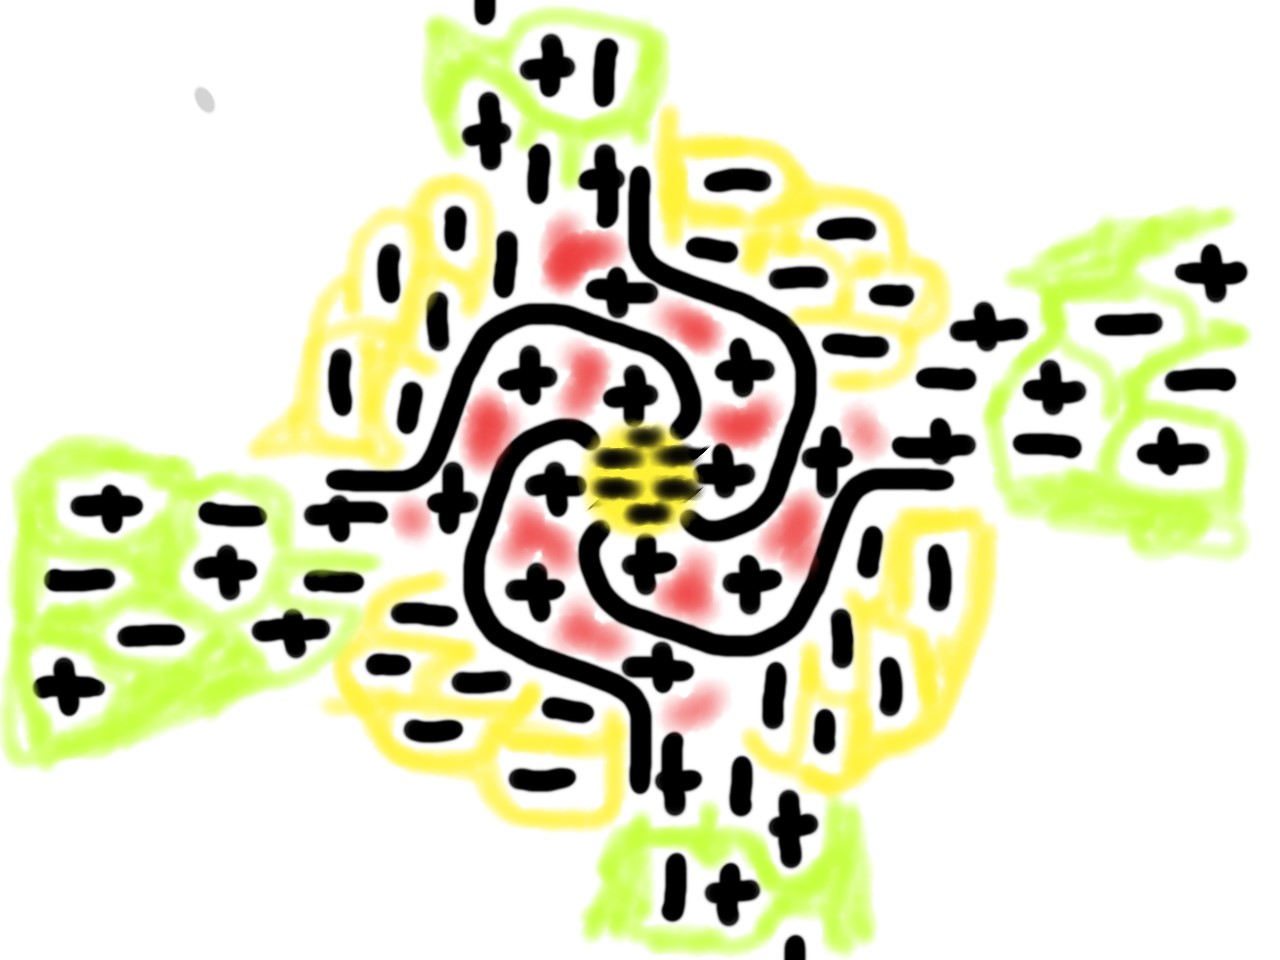
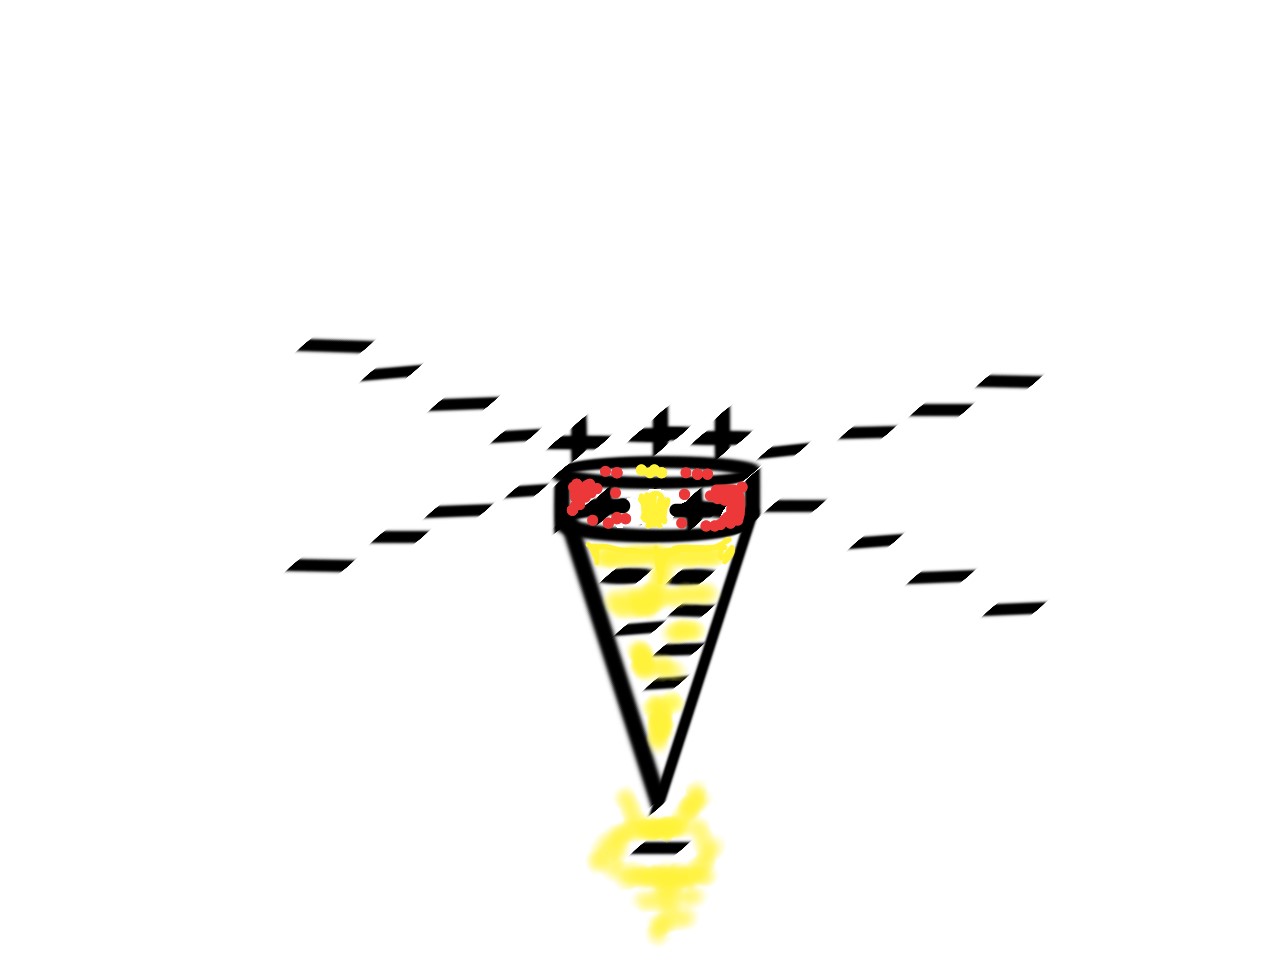
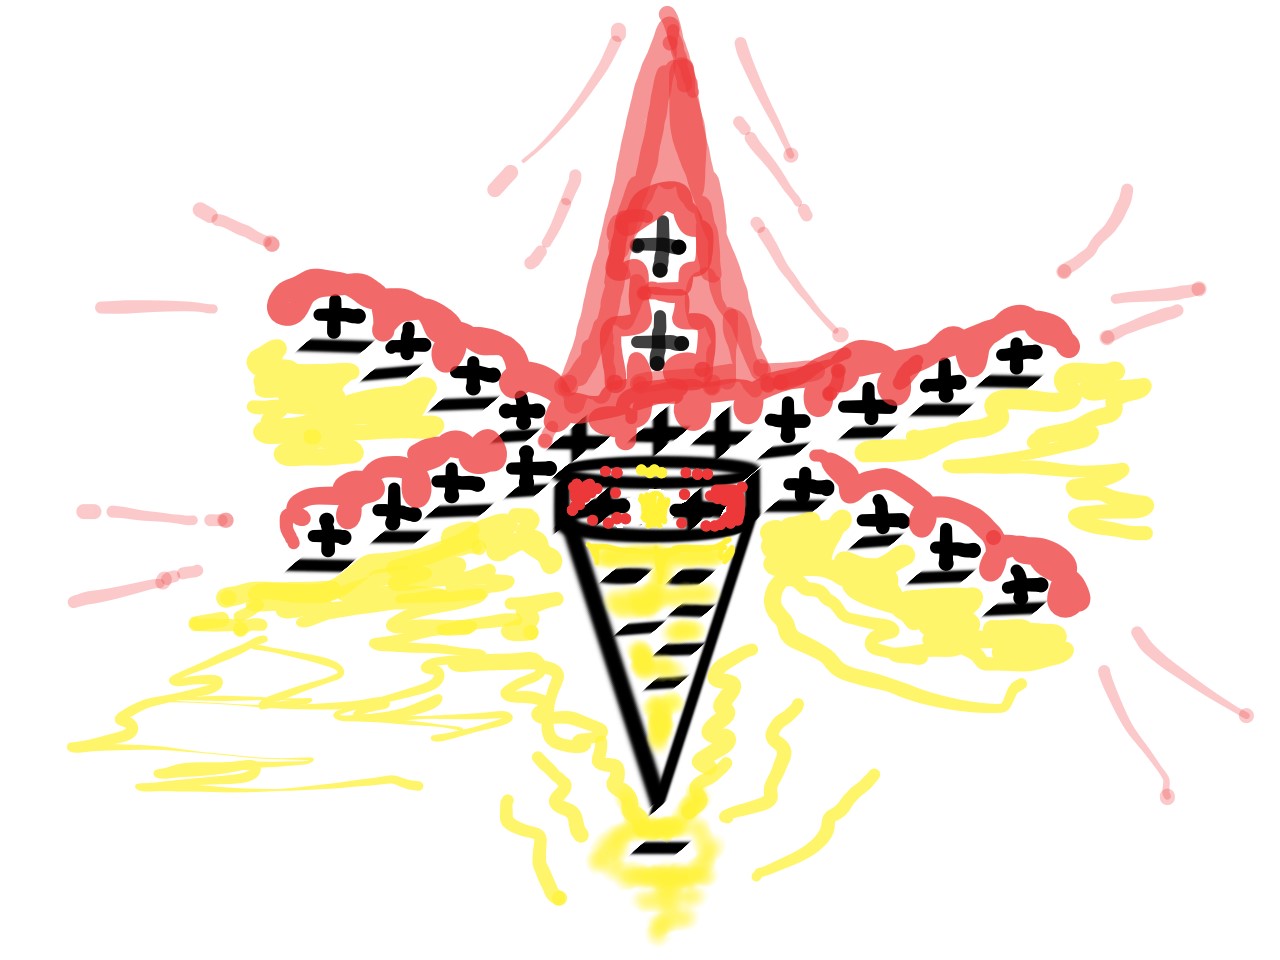
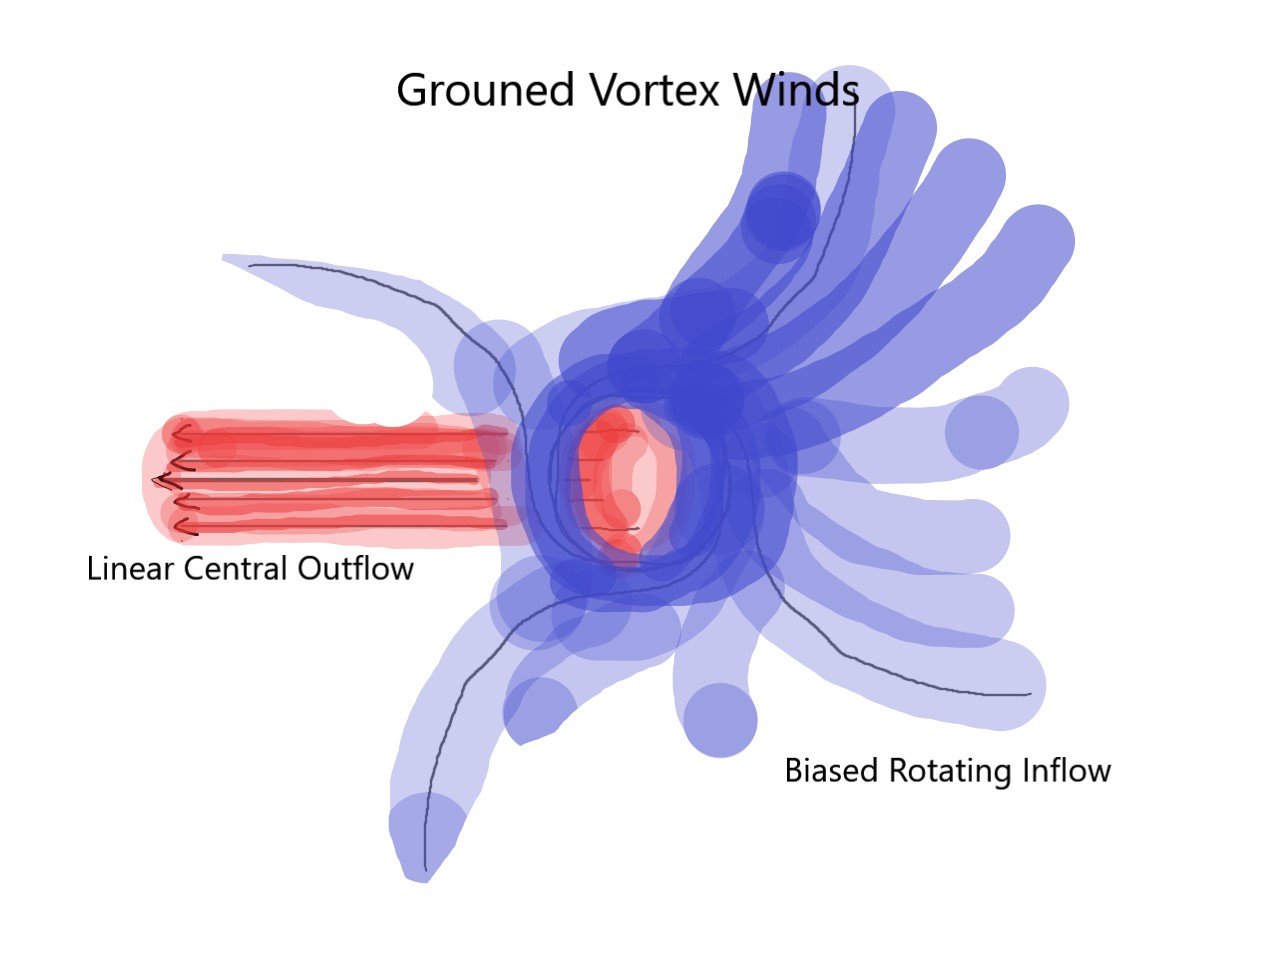
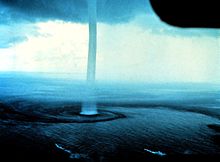
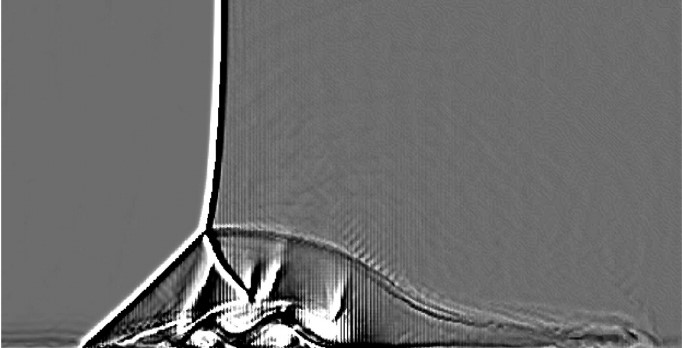
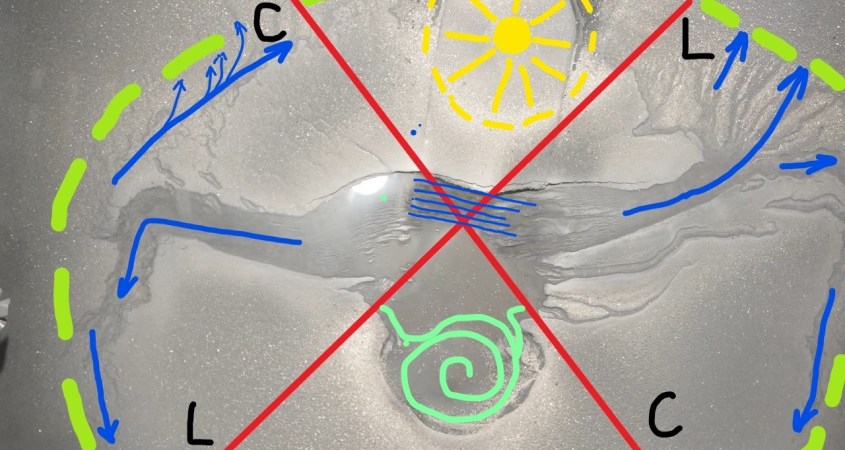
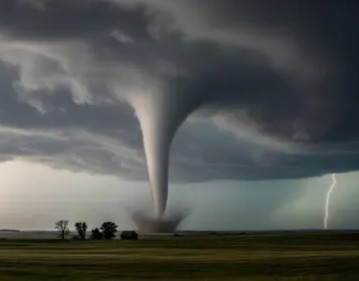
A tornado and a dust devil are not similar-but-different things. Nor are waterspouts and land-spouts. They are all the same Marklund convection current forming a circuit between the Earth and sky. It is a type of coaxial electric wind that forms a negative channel inside a positive vortex. The negative wind sweeps positive ions to the outside and up, creating a tremendous pressure drop that draws ground winds carrying more ionic dust. It isn’t just self-organizing, it is self-amplifying, by inducting energy into the circuit. Different intensities of ionization and chemistry in different circumstances makes for variations in the vortex, but the circuit is the same.
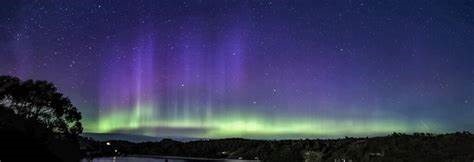
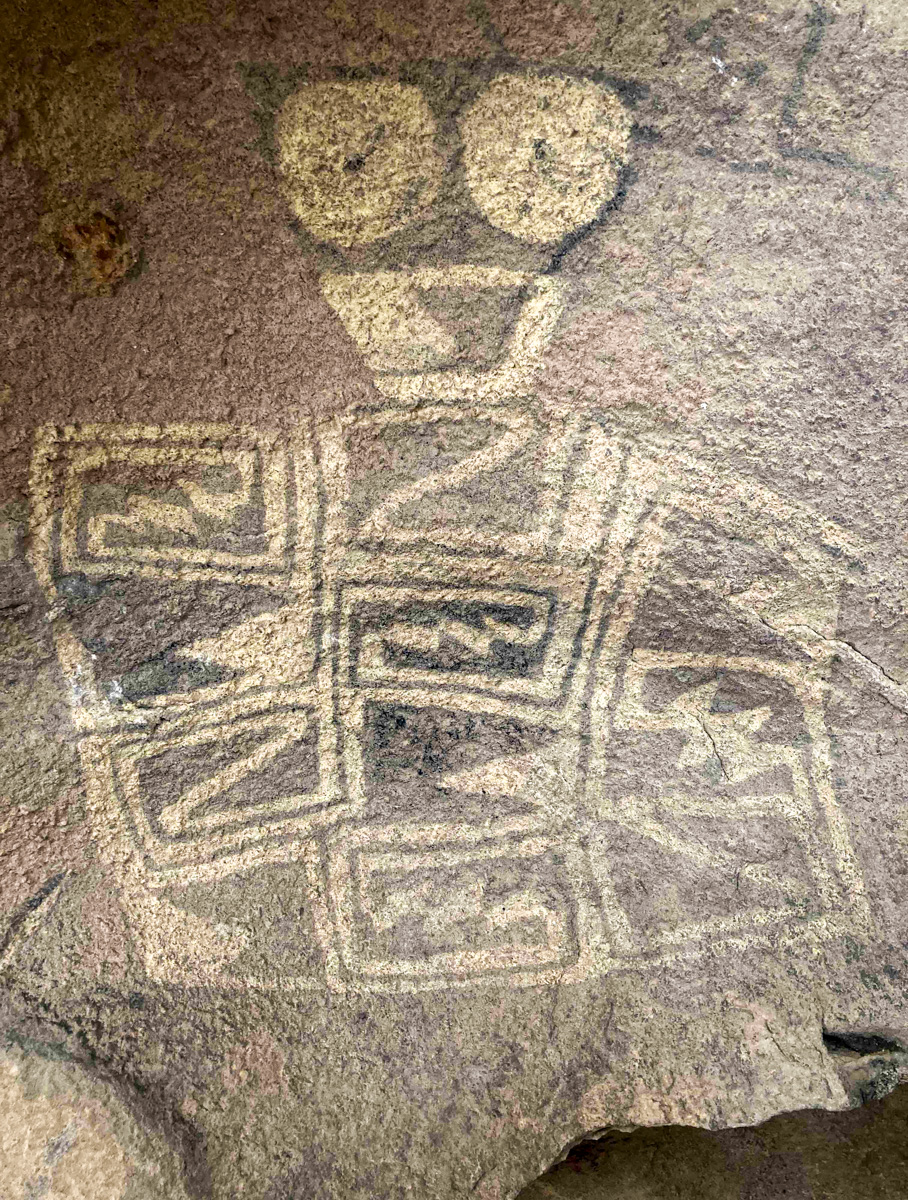
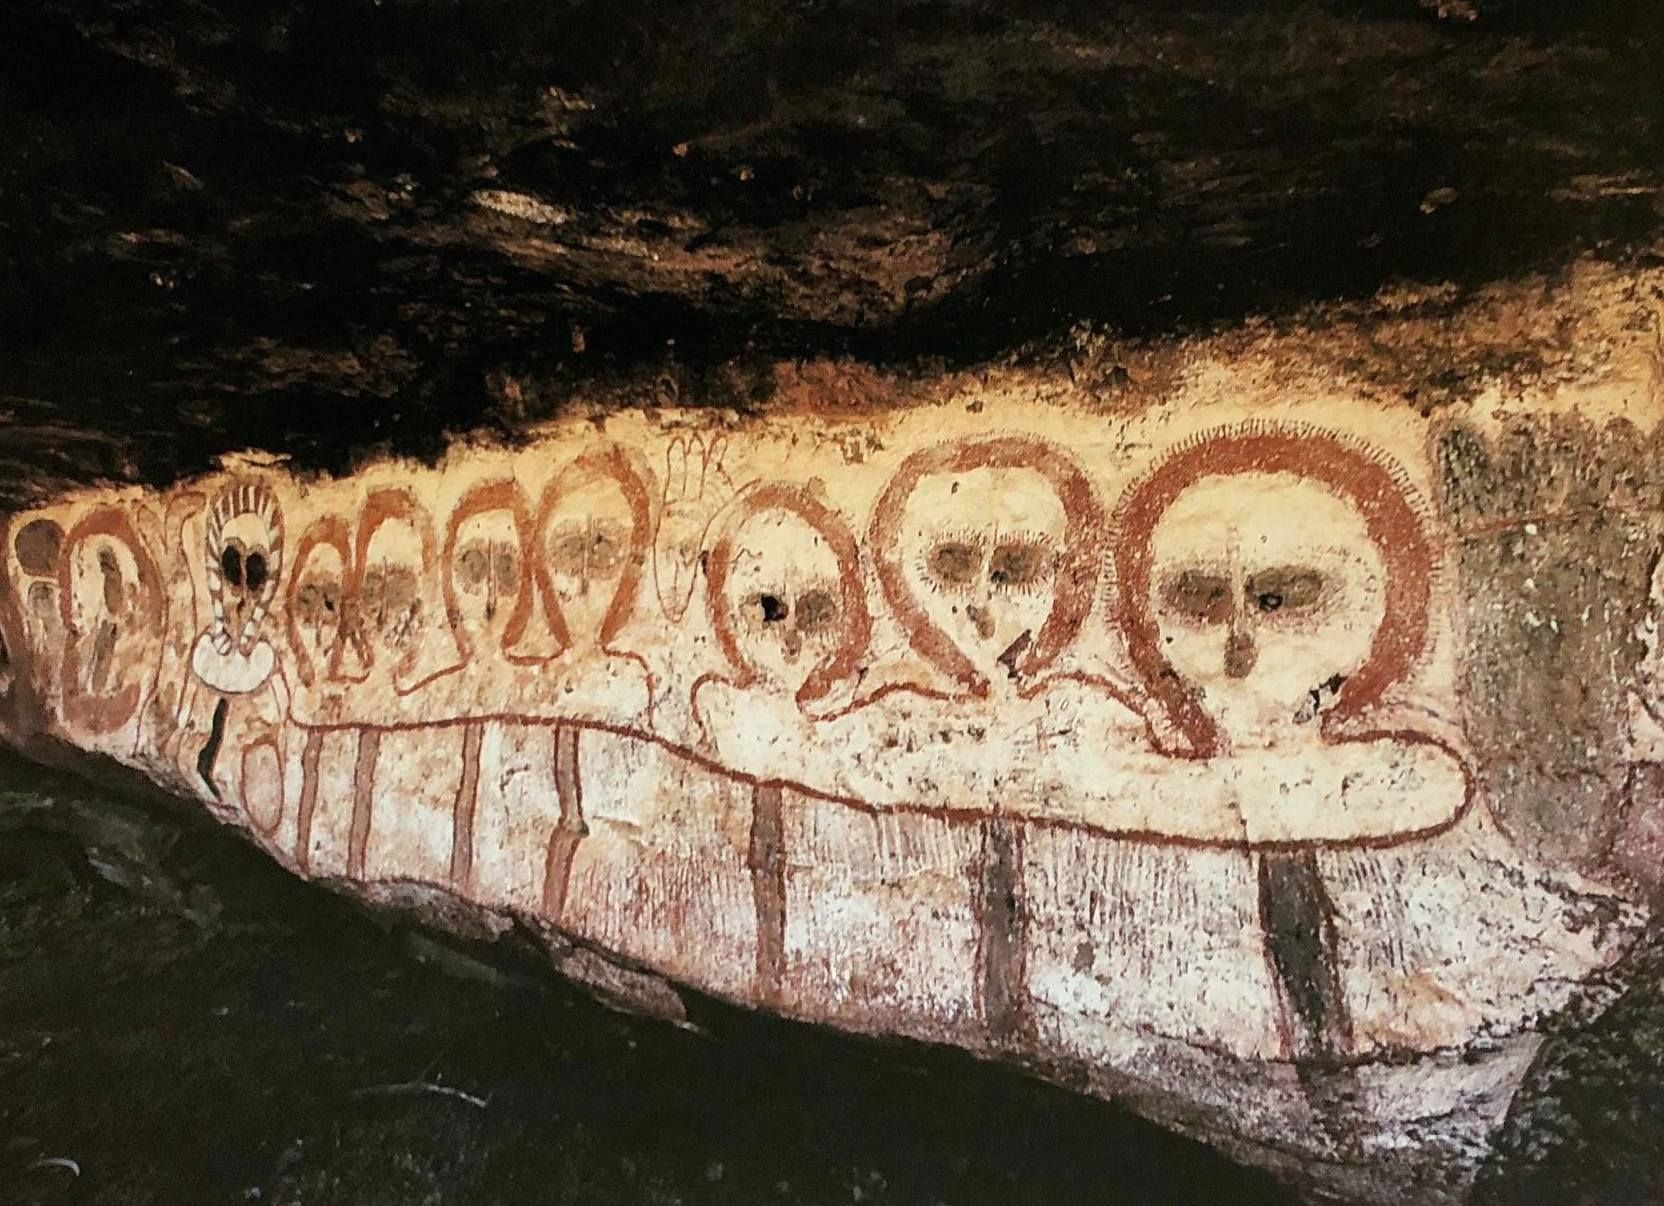
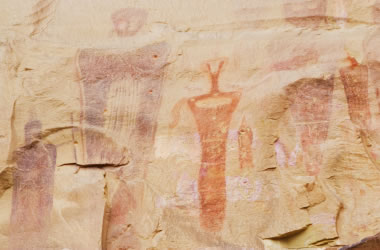
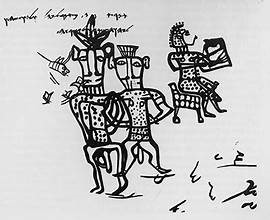
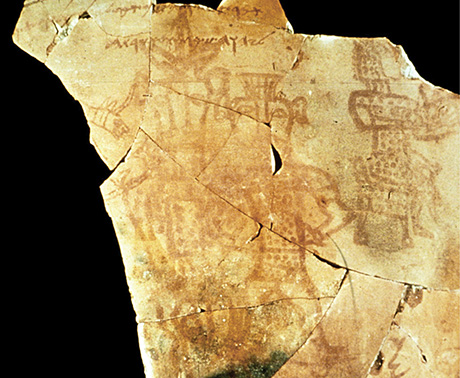
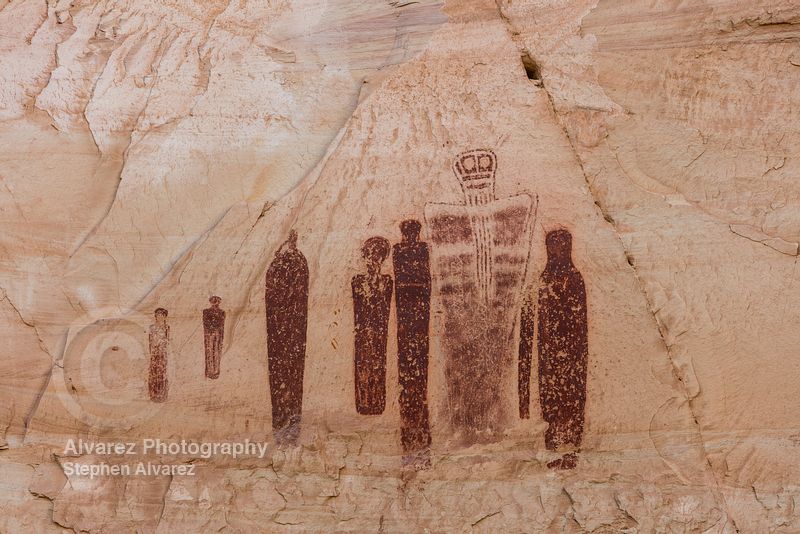
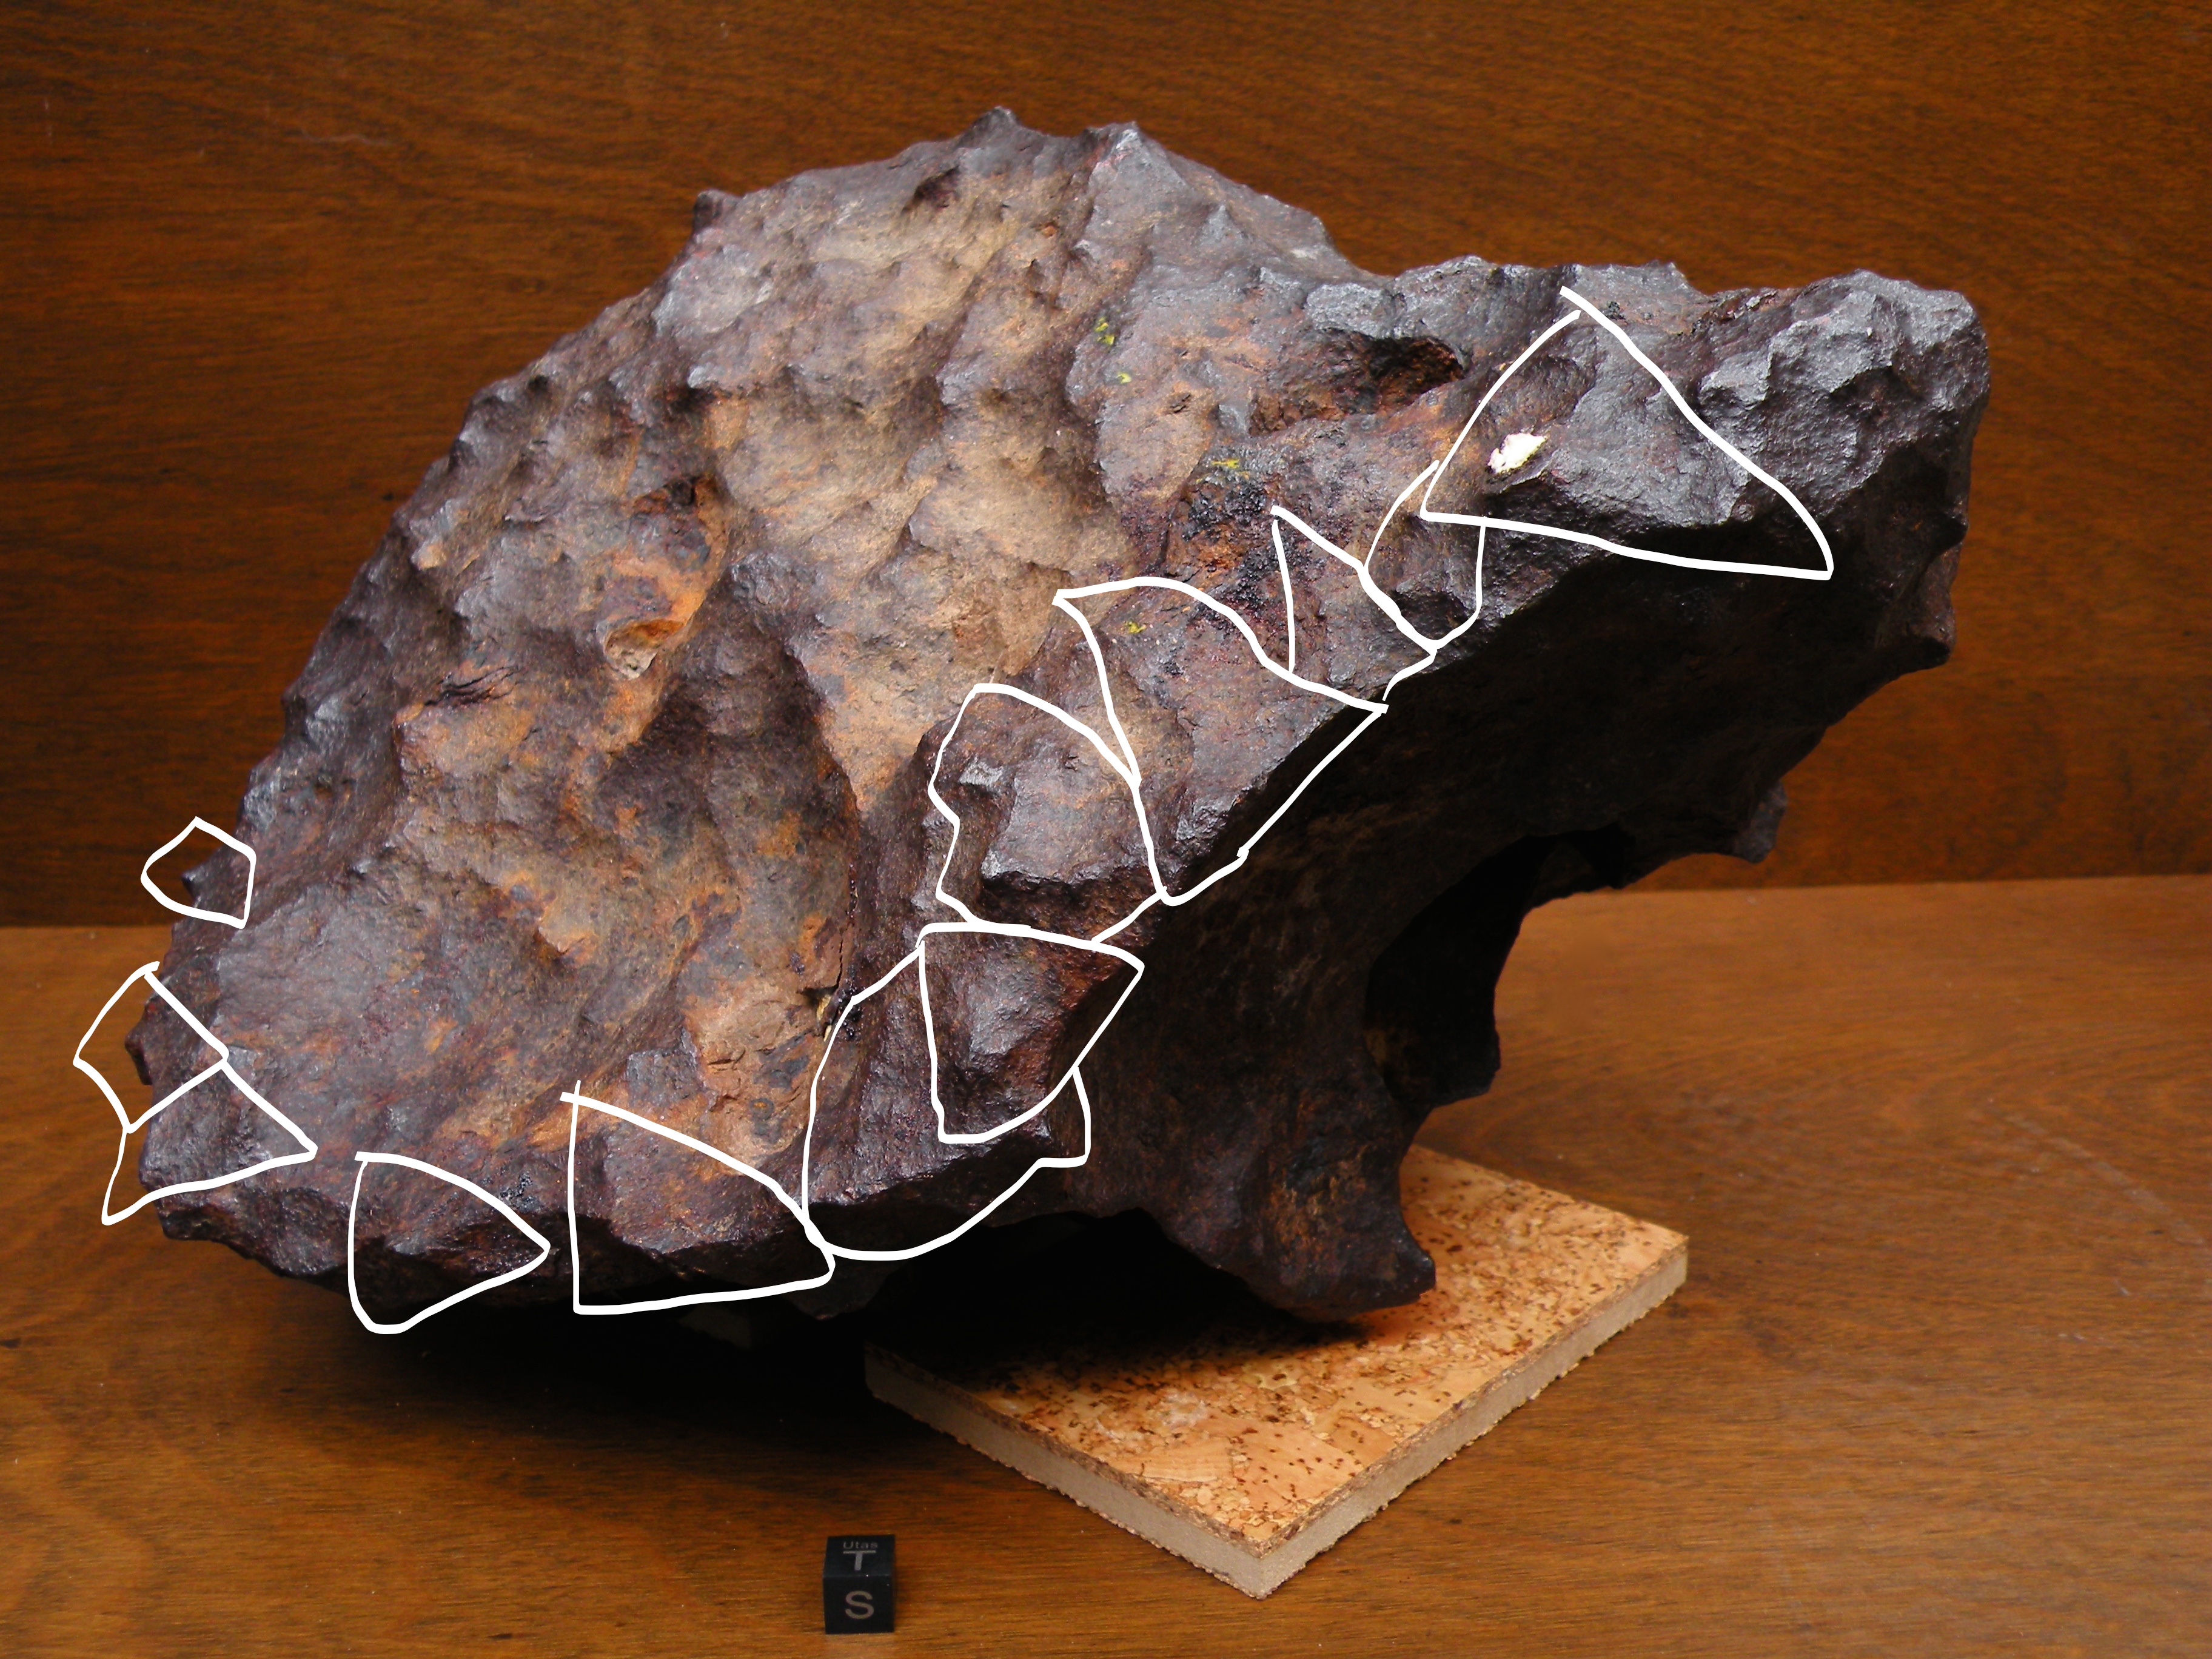
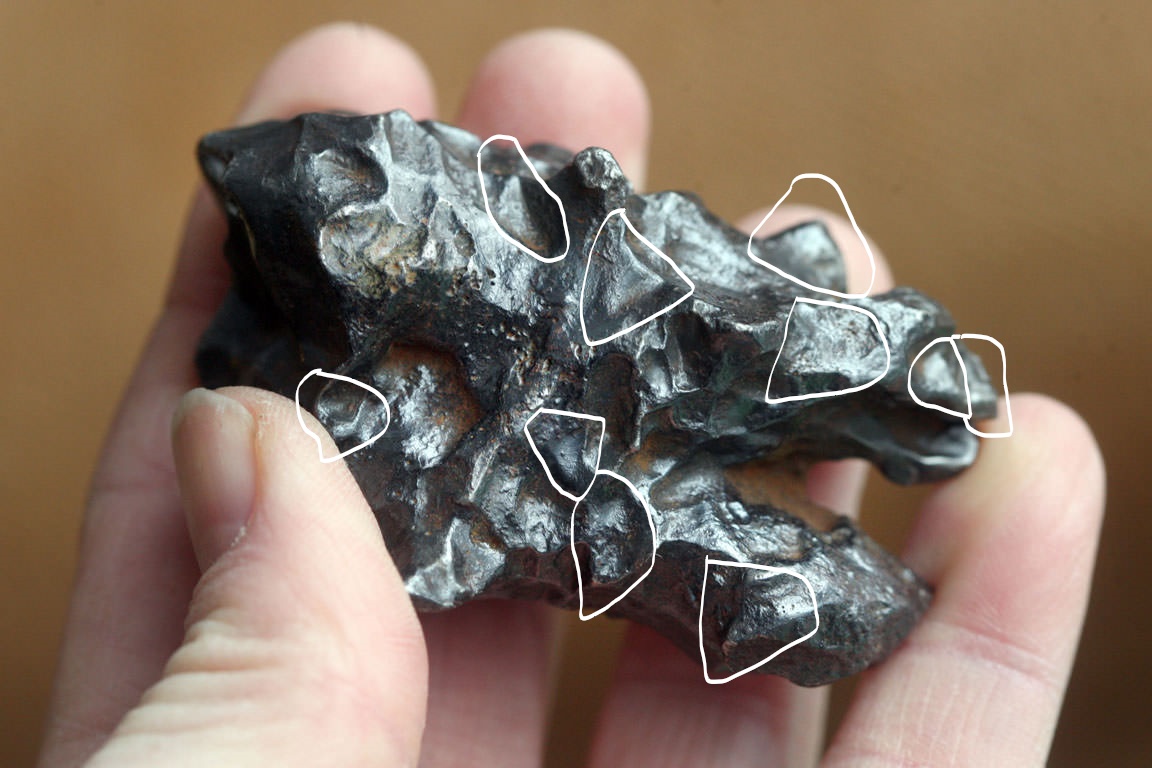
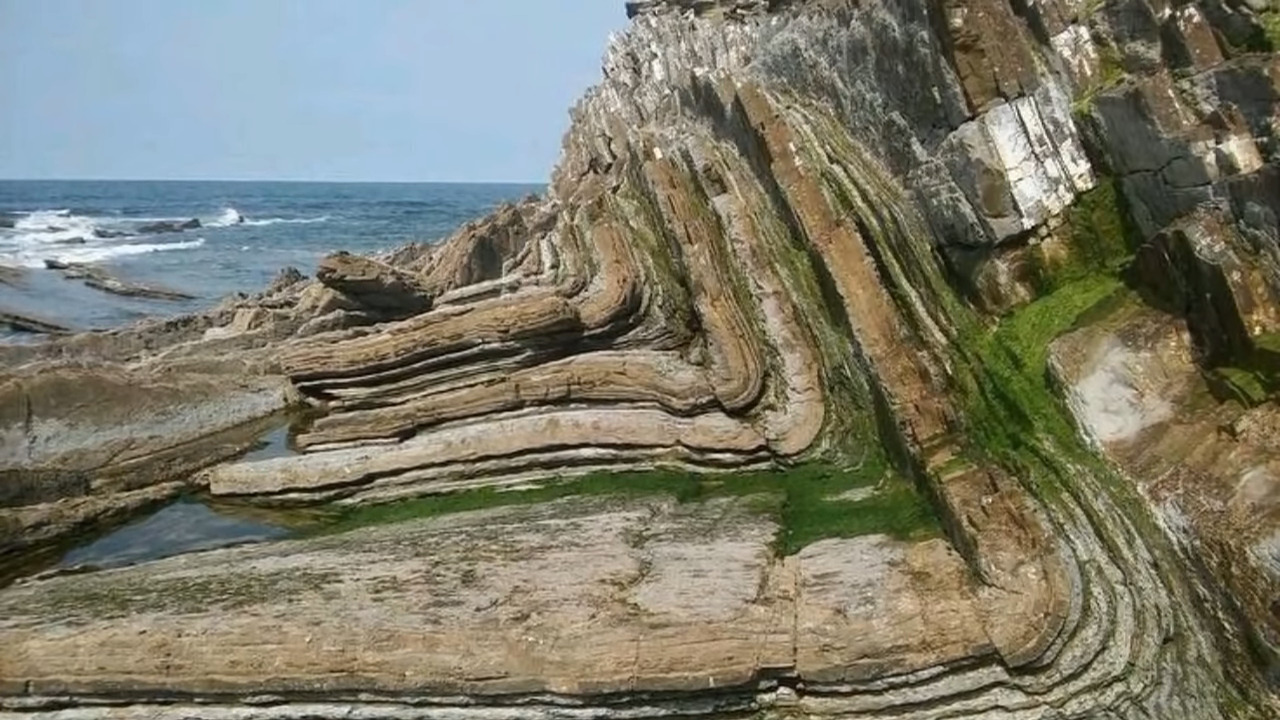
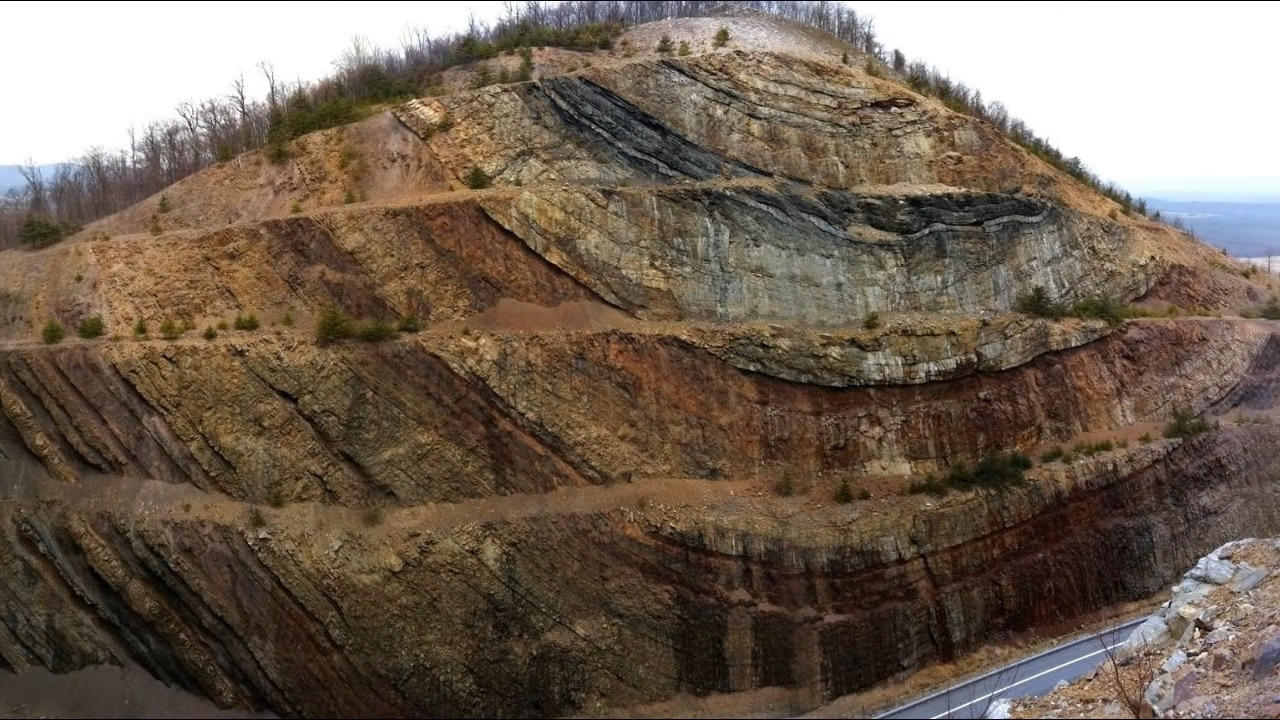
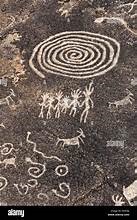
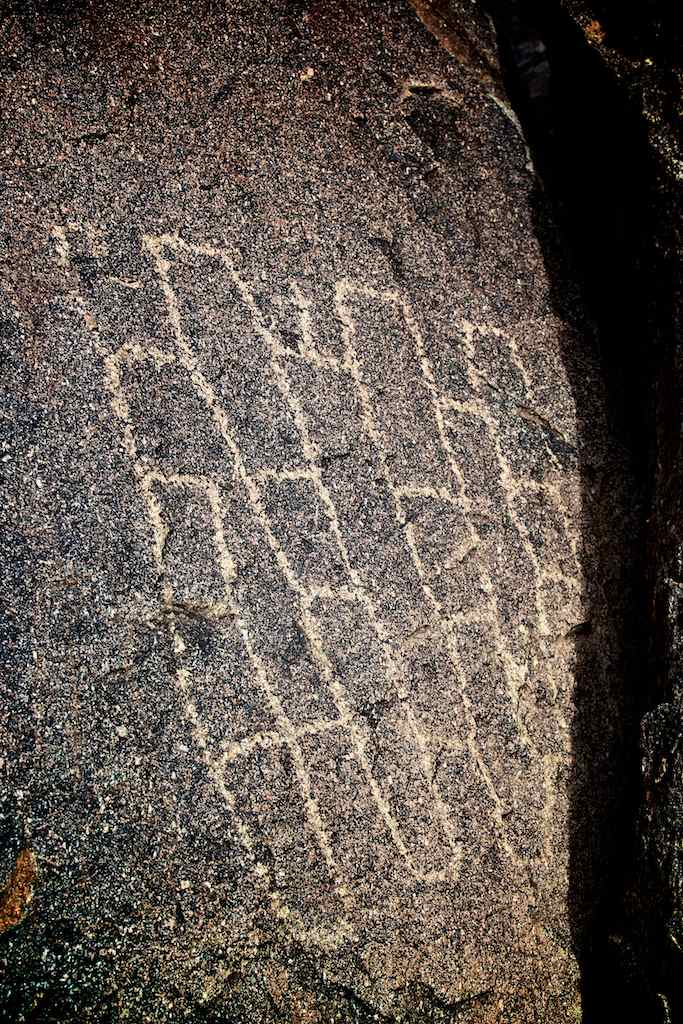
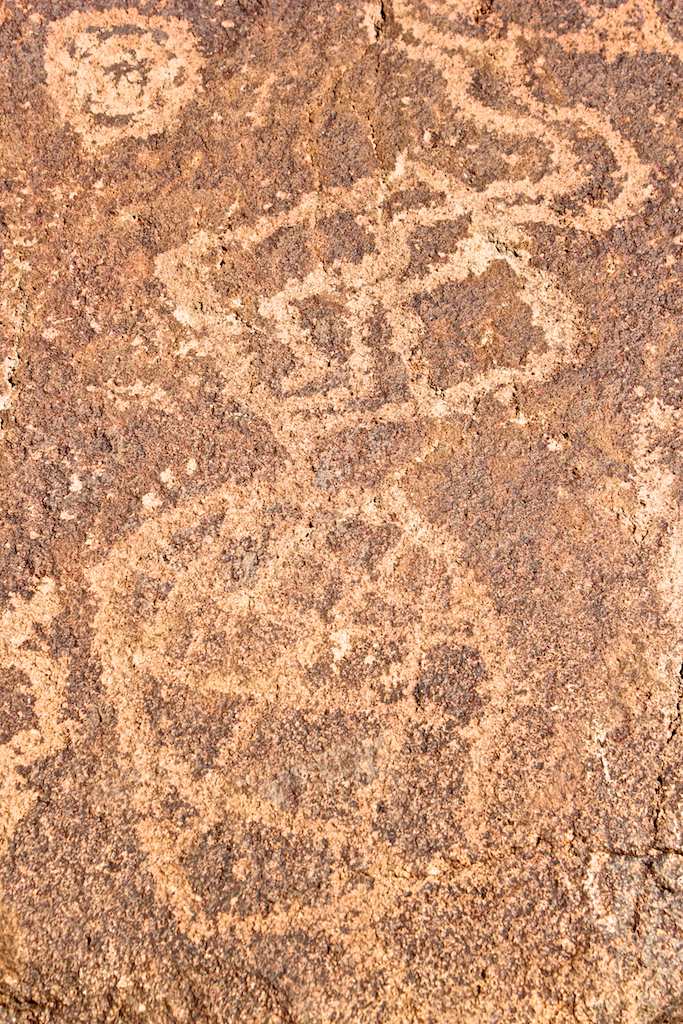
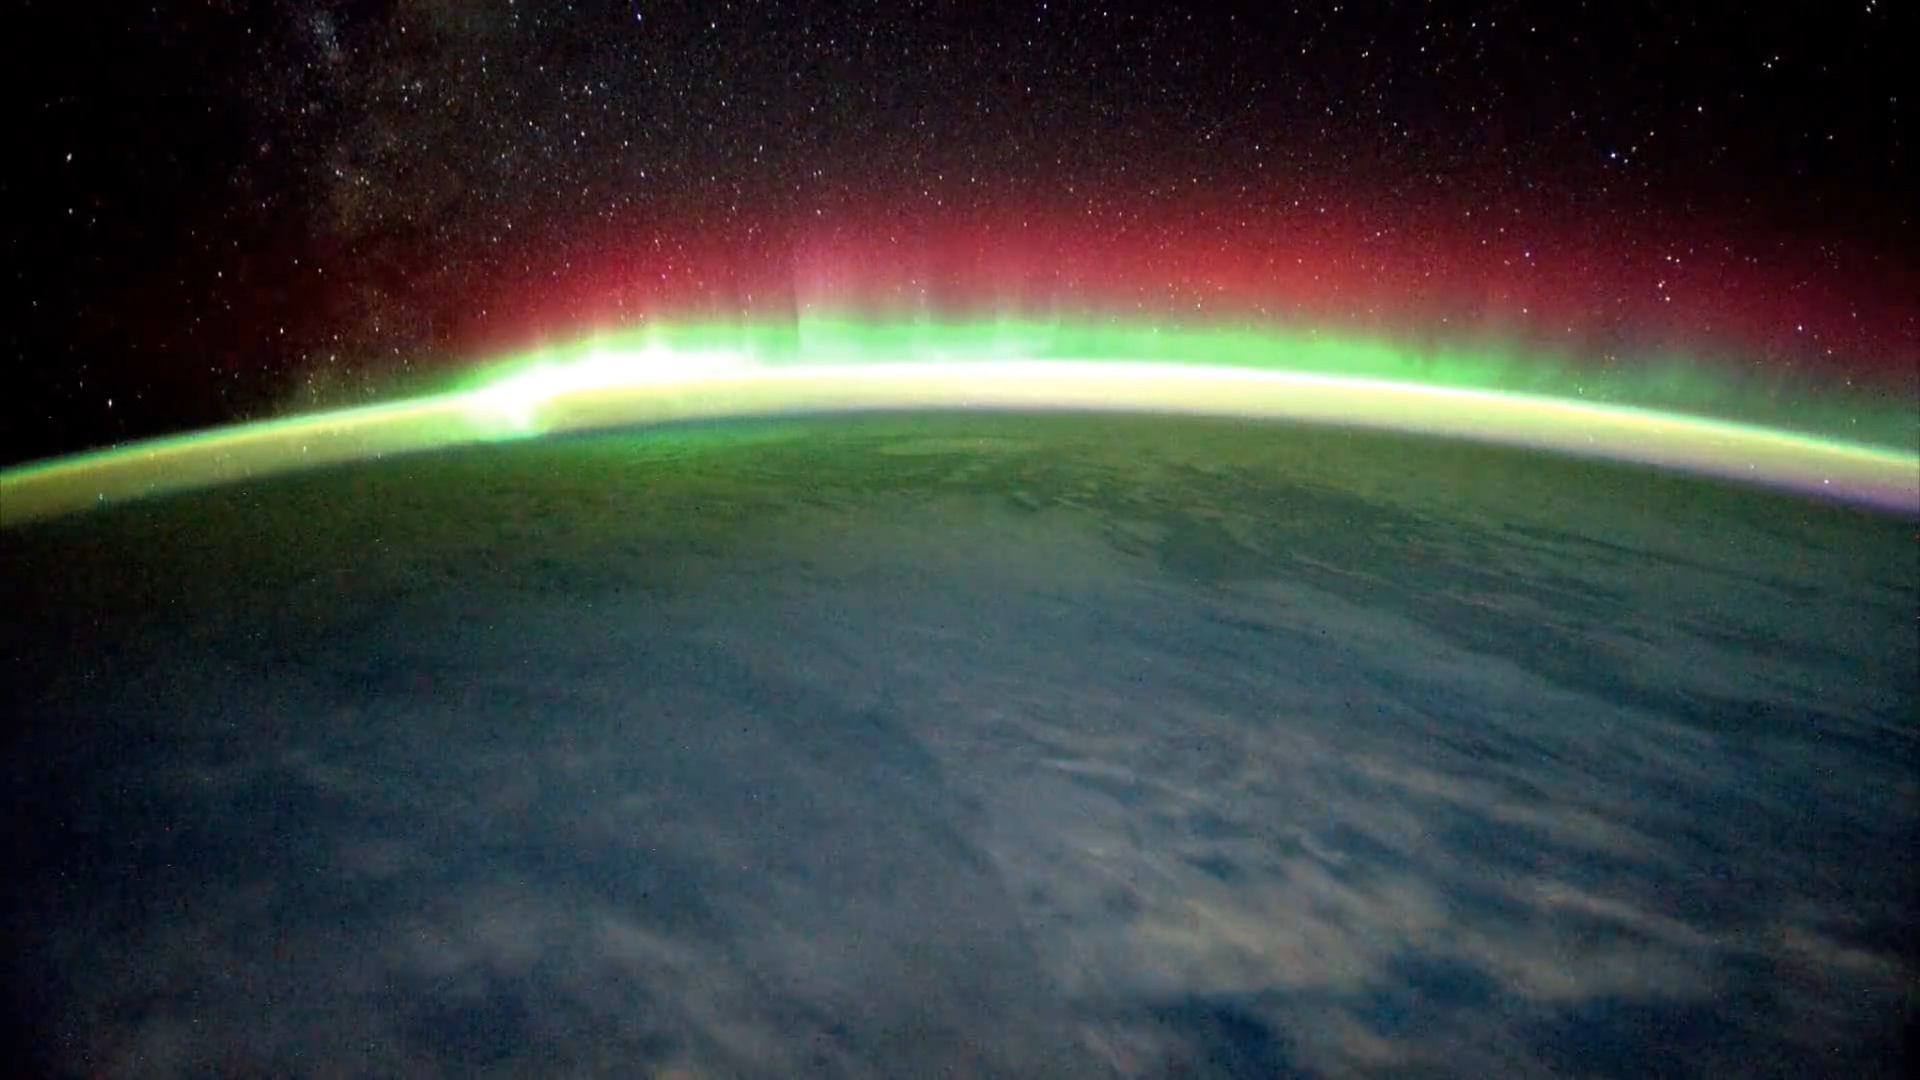
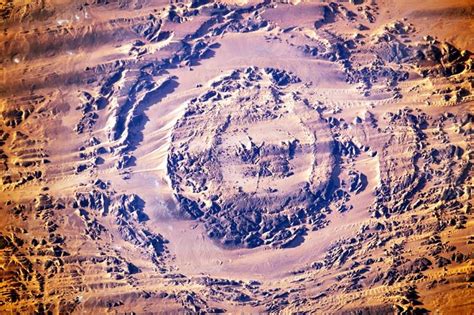
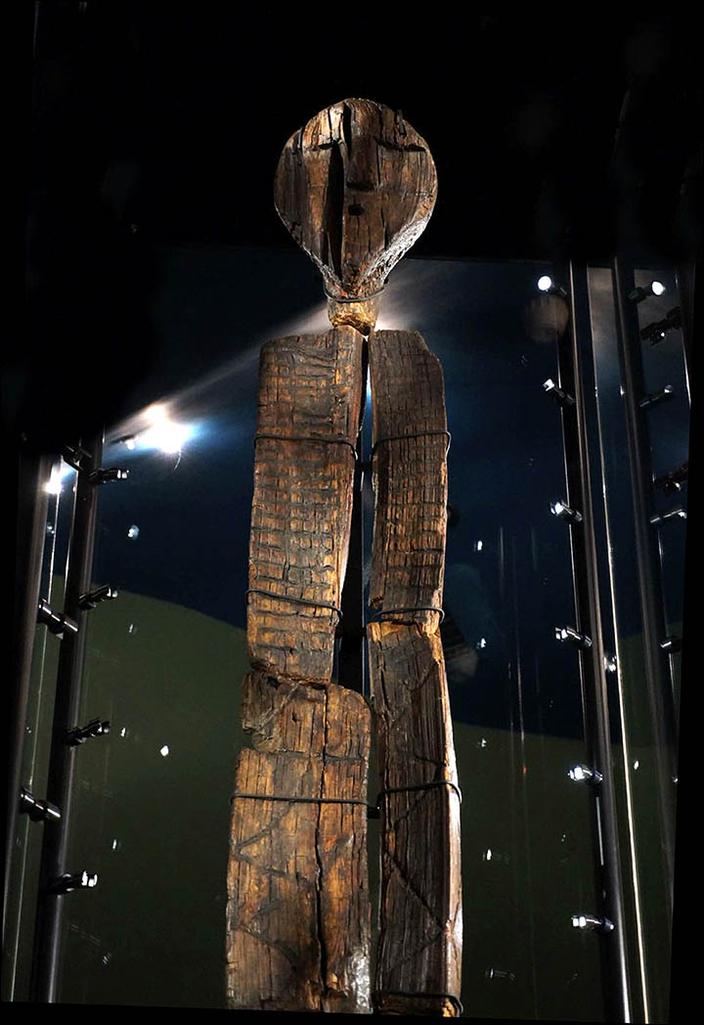
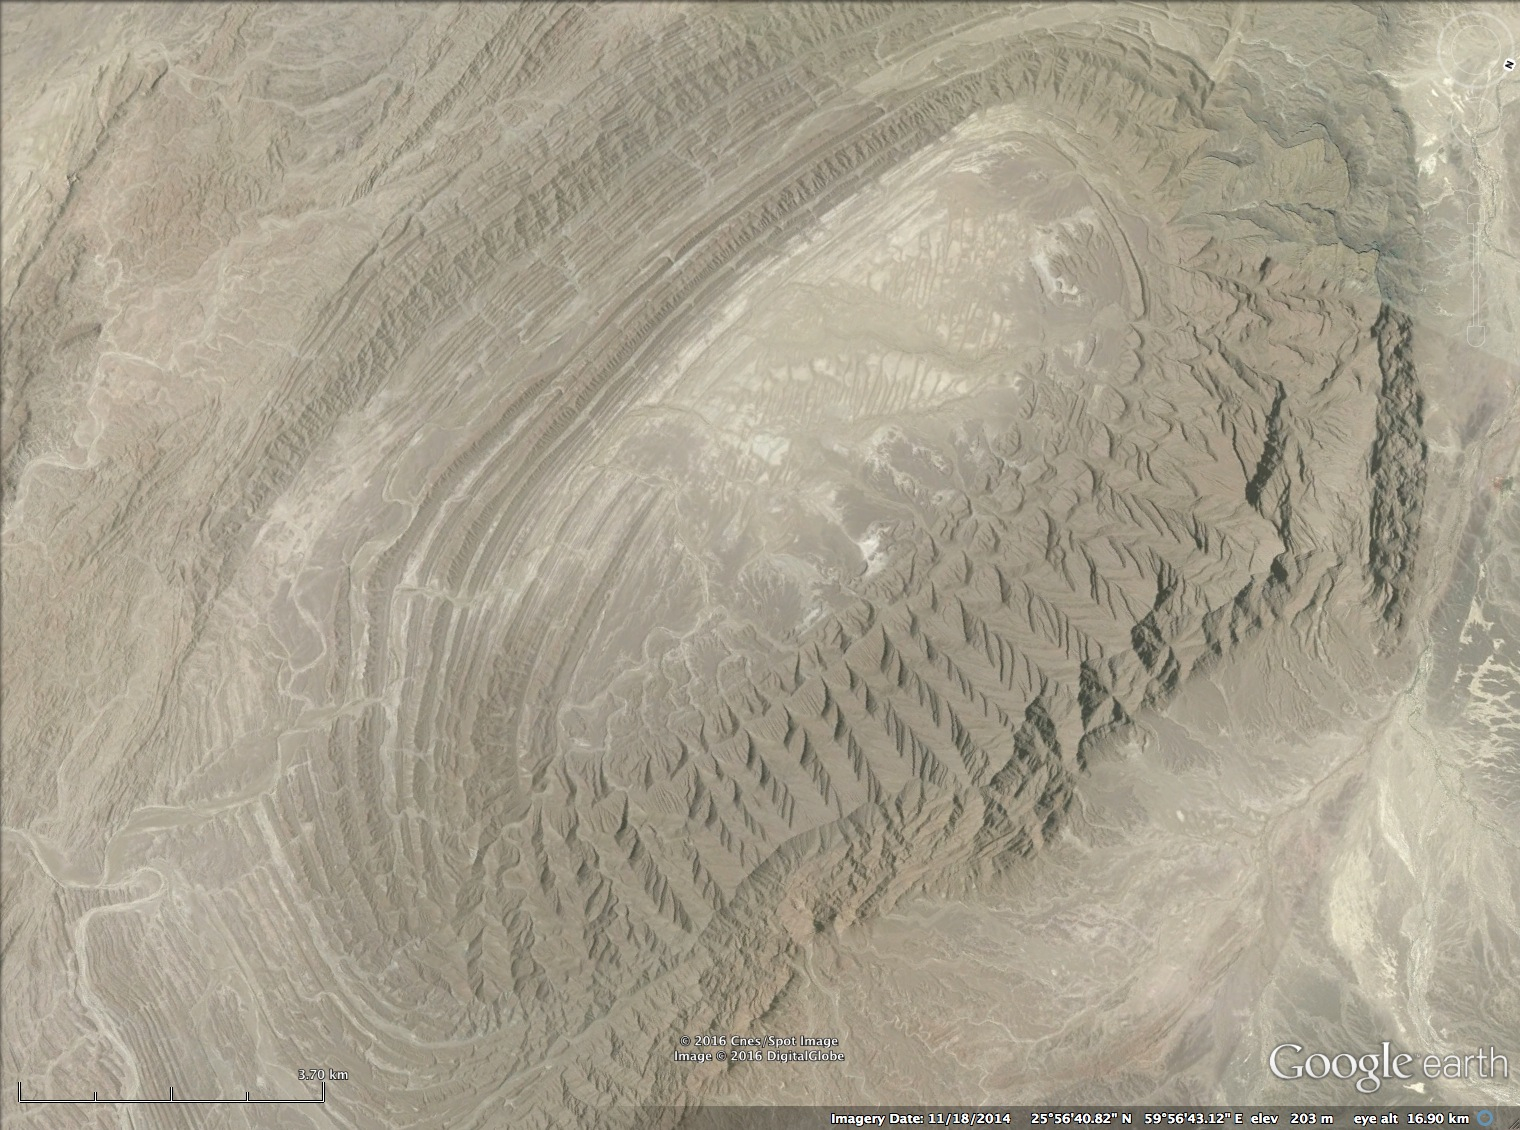
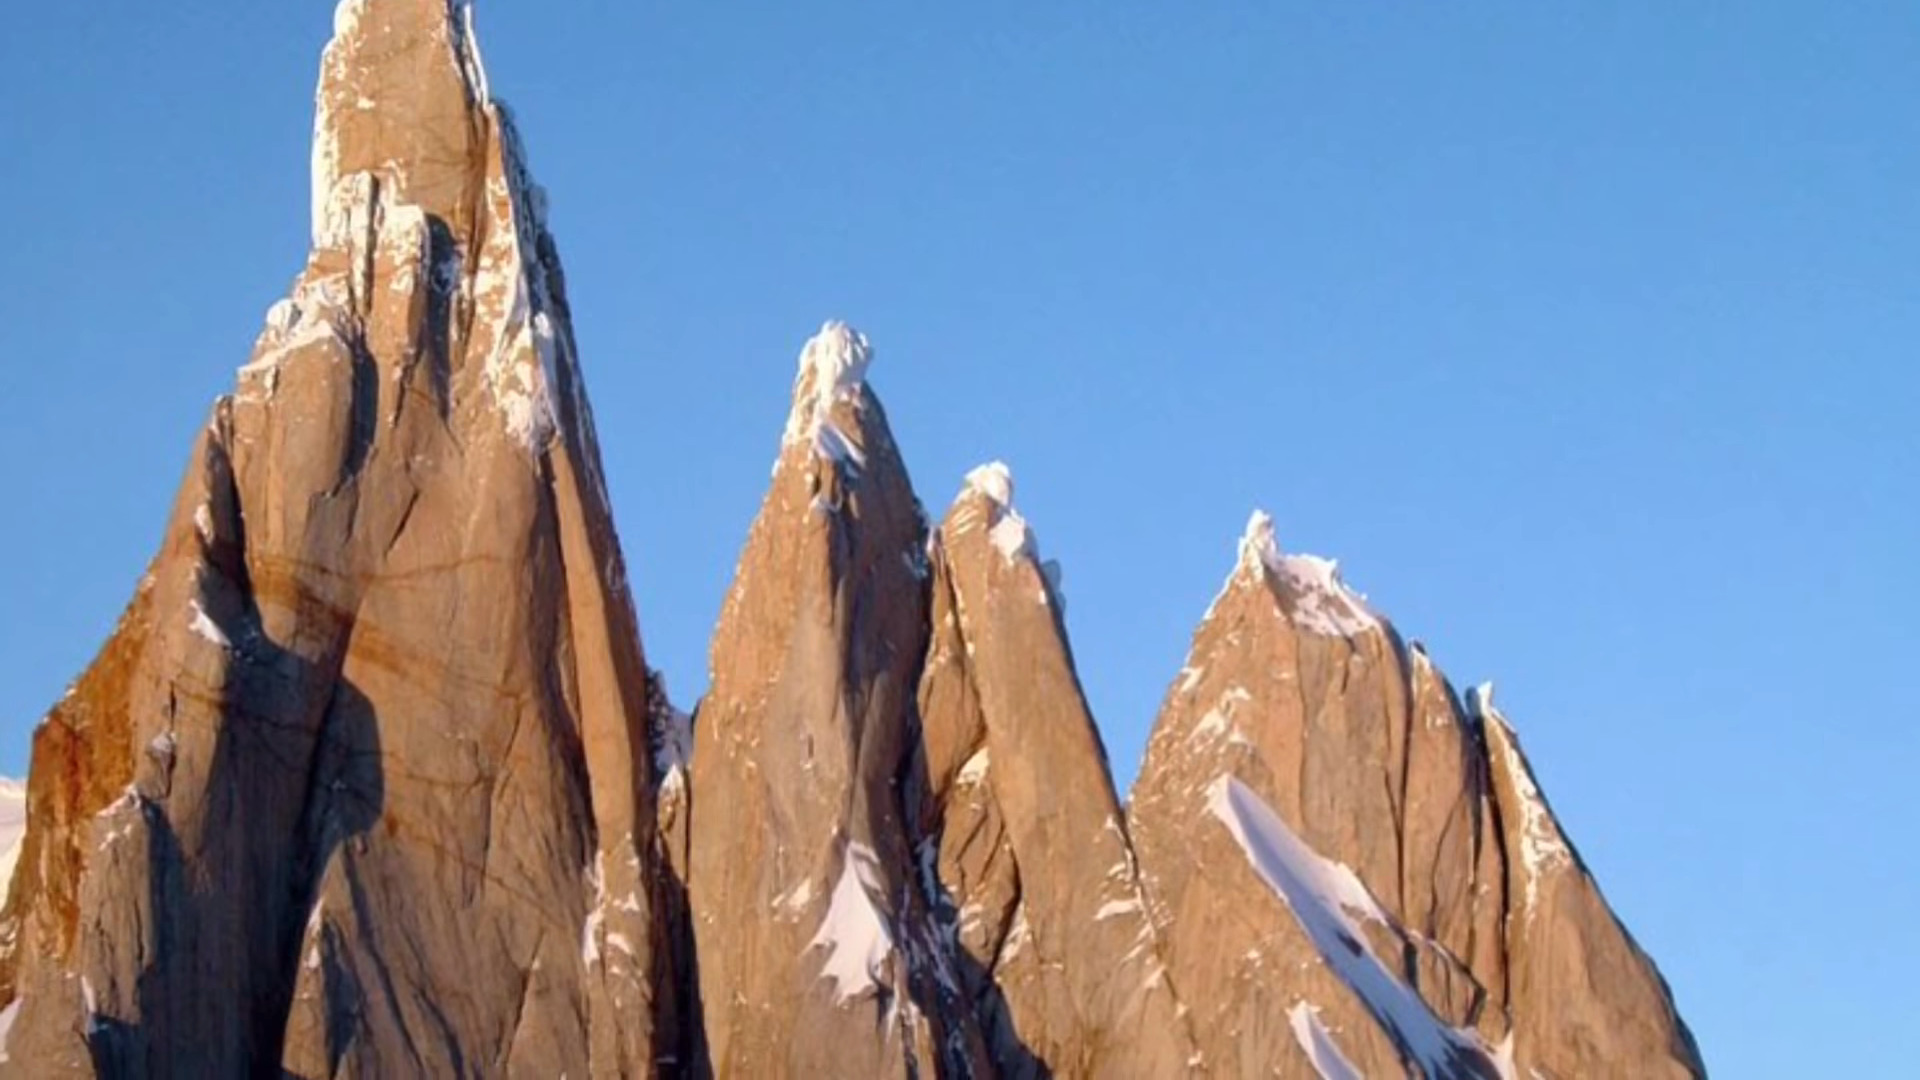
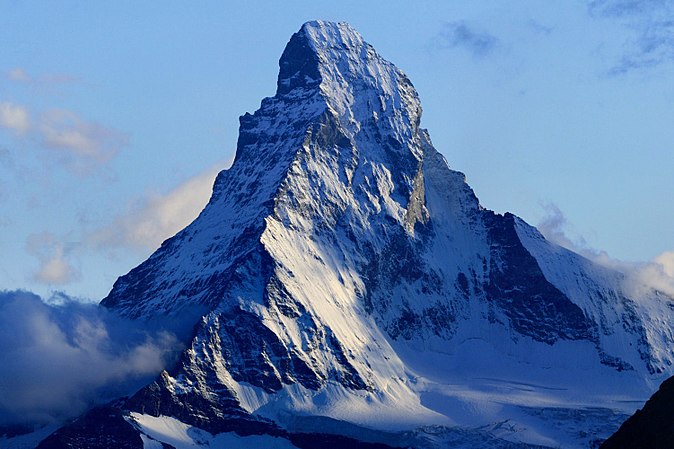
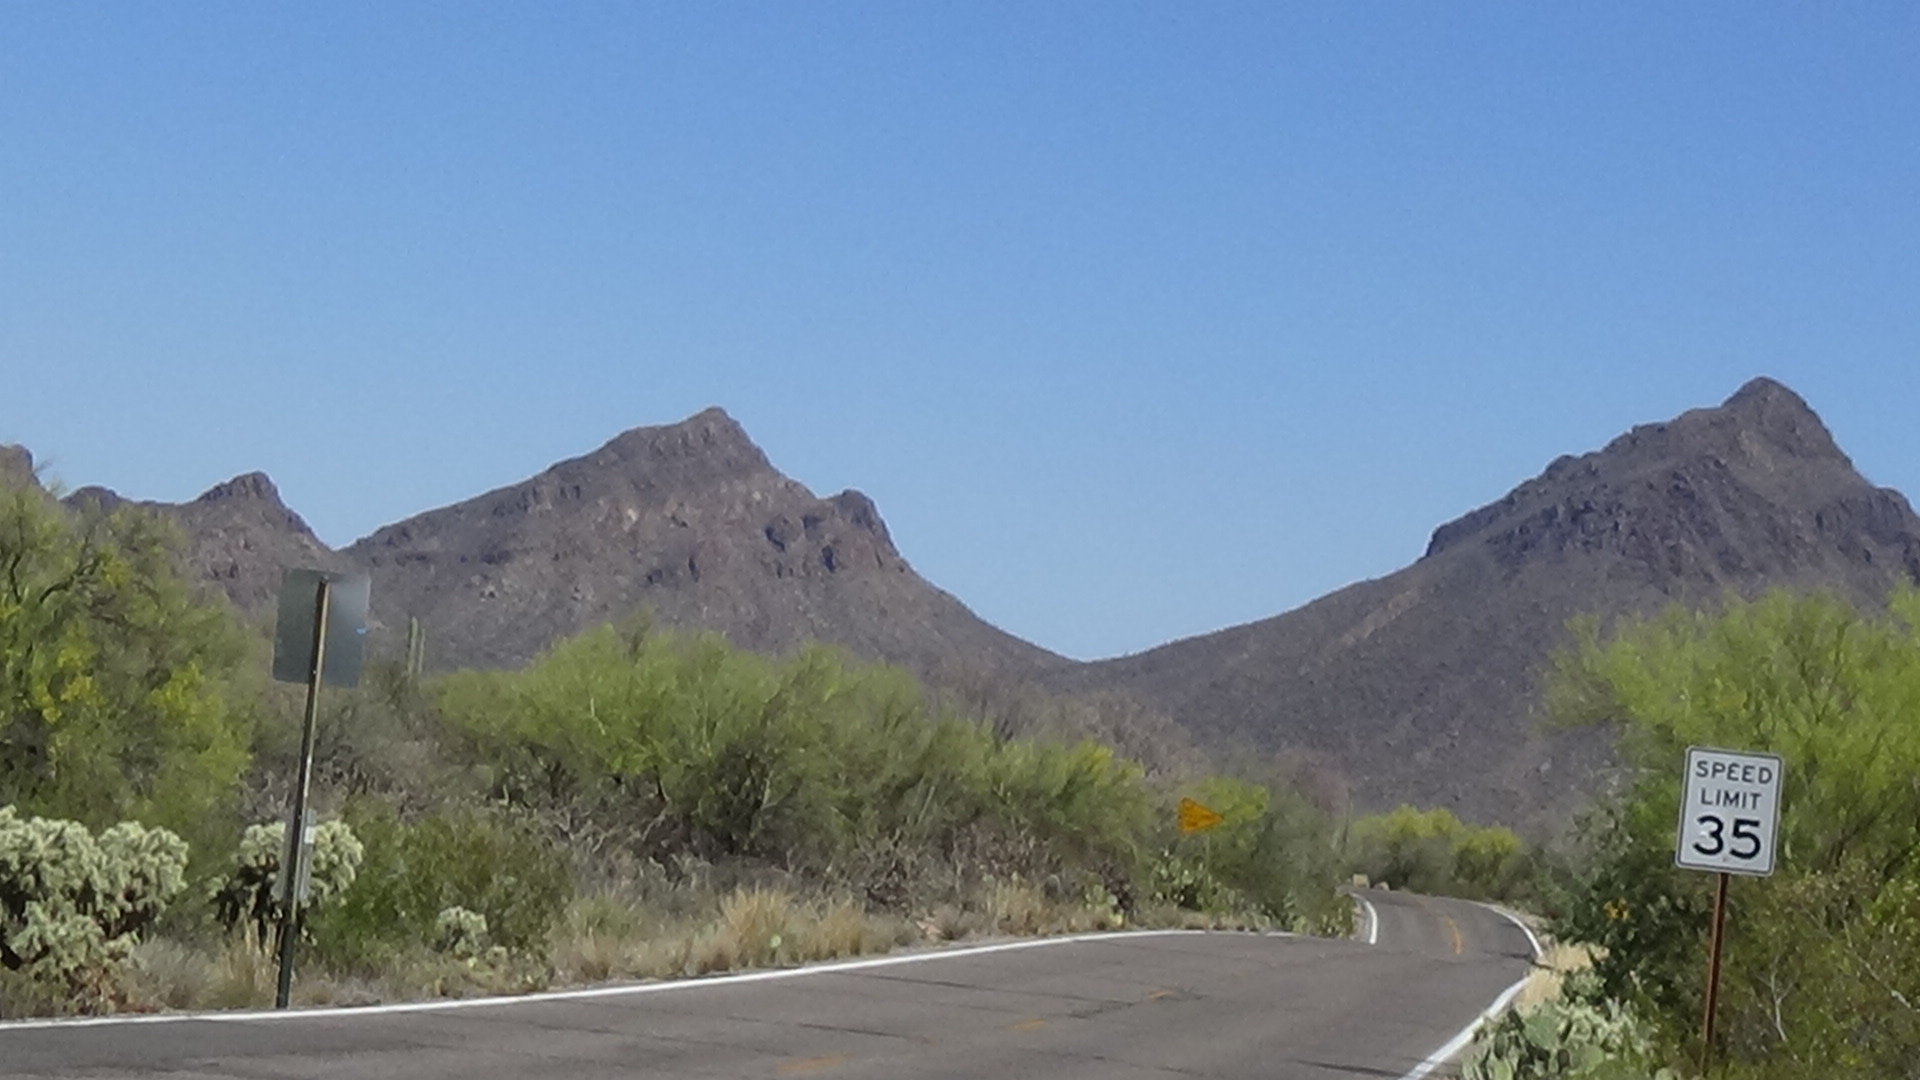
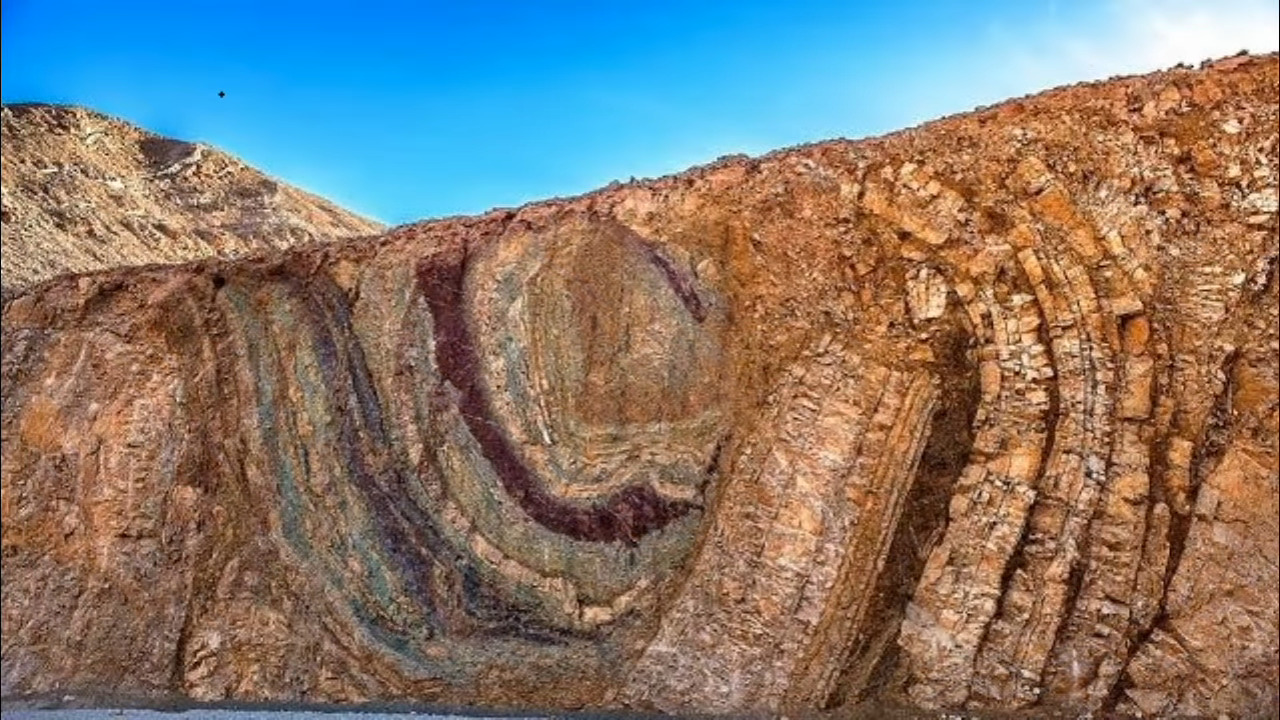
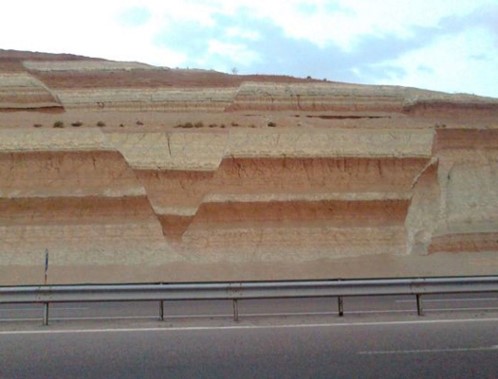
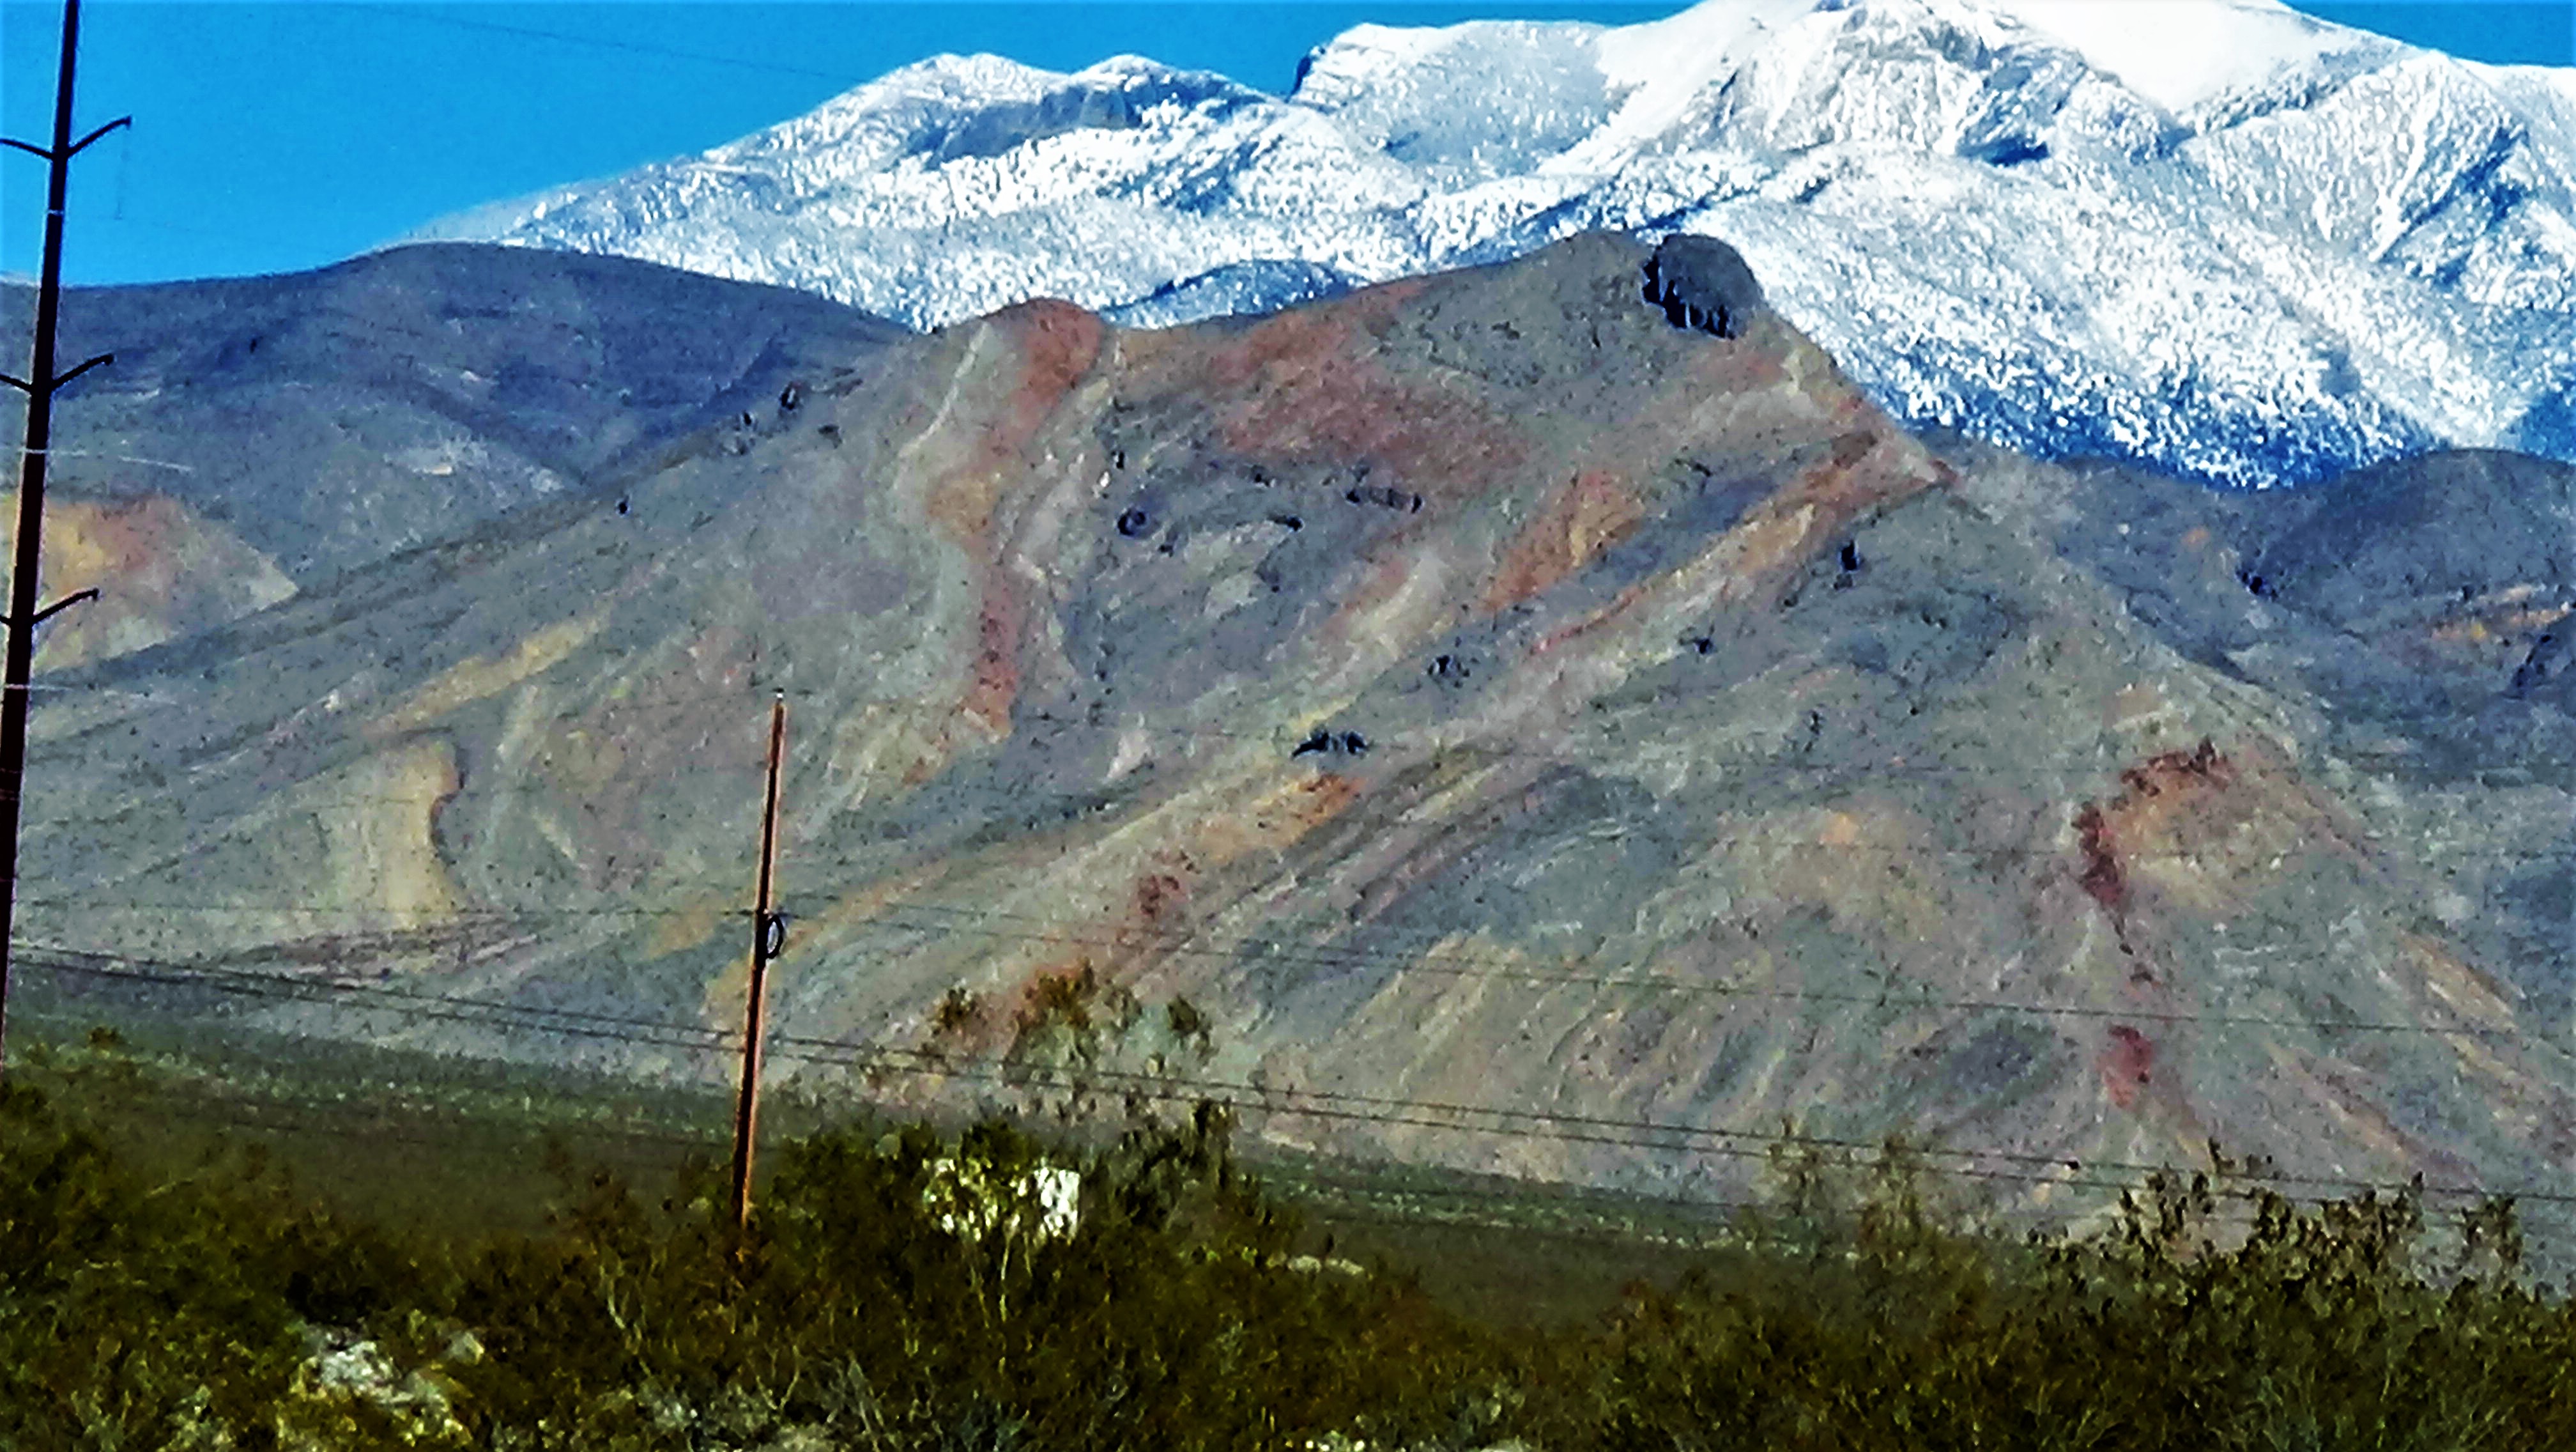
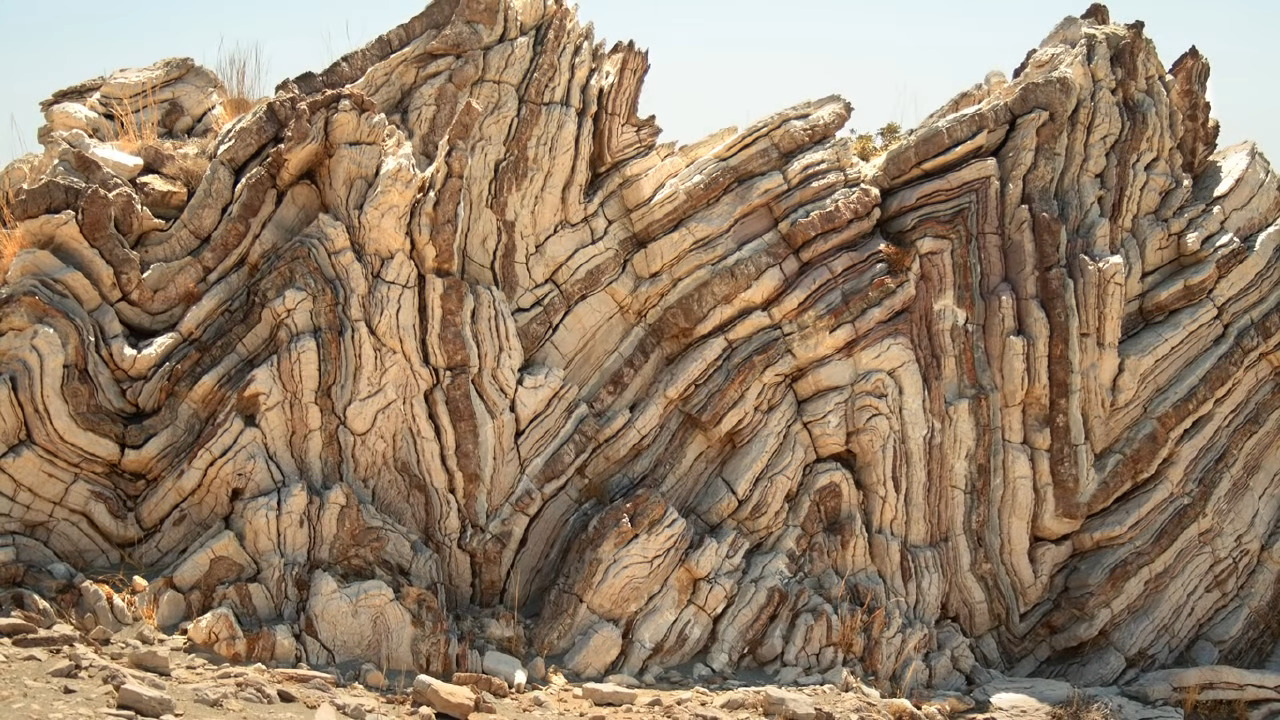
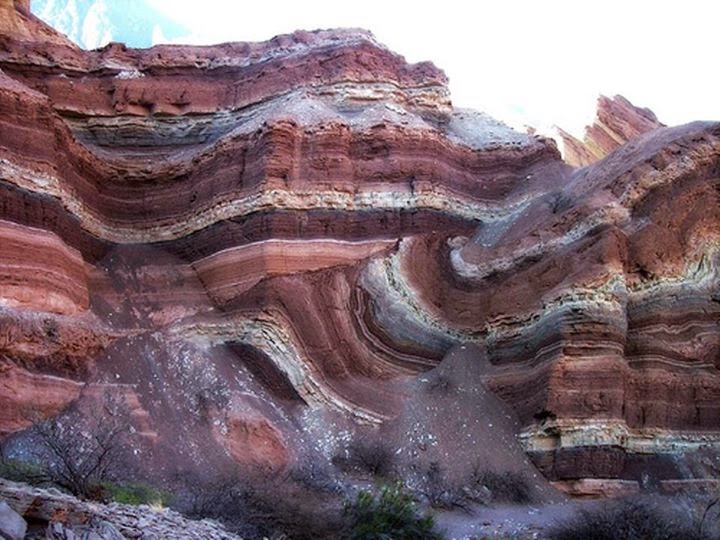
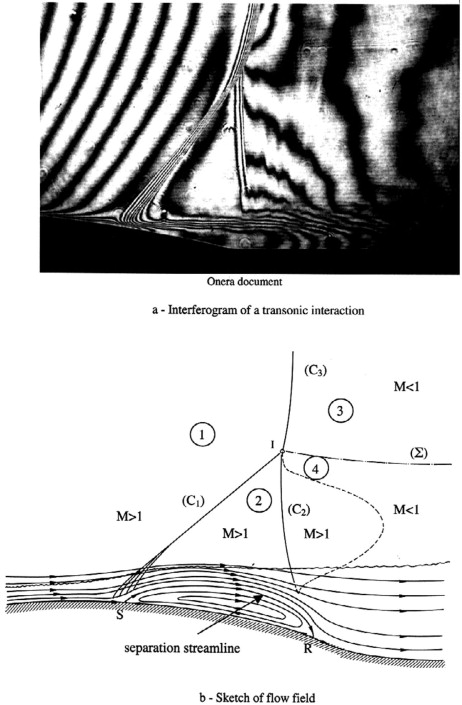
A shock wave electrostatically separates dust from supersonic plasma winds into tetrahedral piles we call mountains. Ionization in solid-state matter diffuses in patterns like the Mandelbrot set that can be seen in canyons. Clouds look like feathers, rivers look like lightning discharge and ancient aurora looked like people and animals in the sky. Everything is electric and that is why.
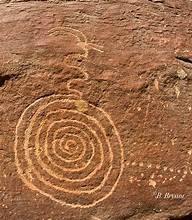
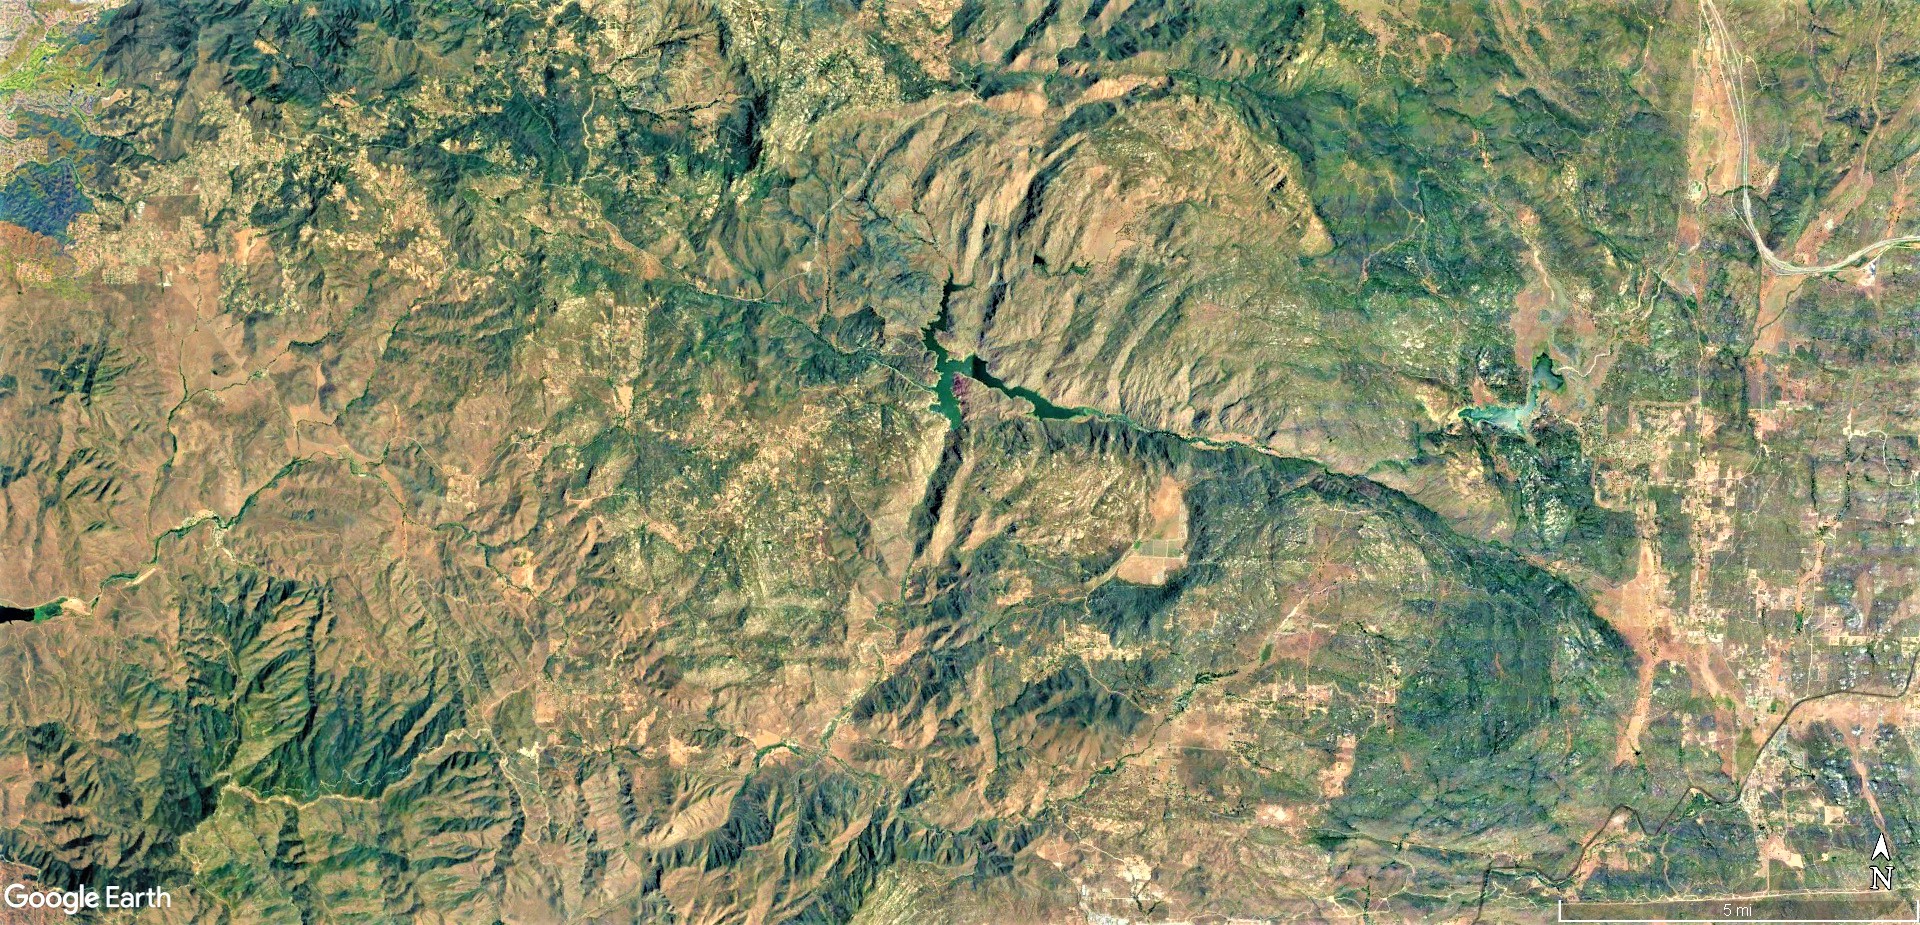
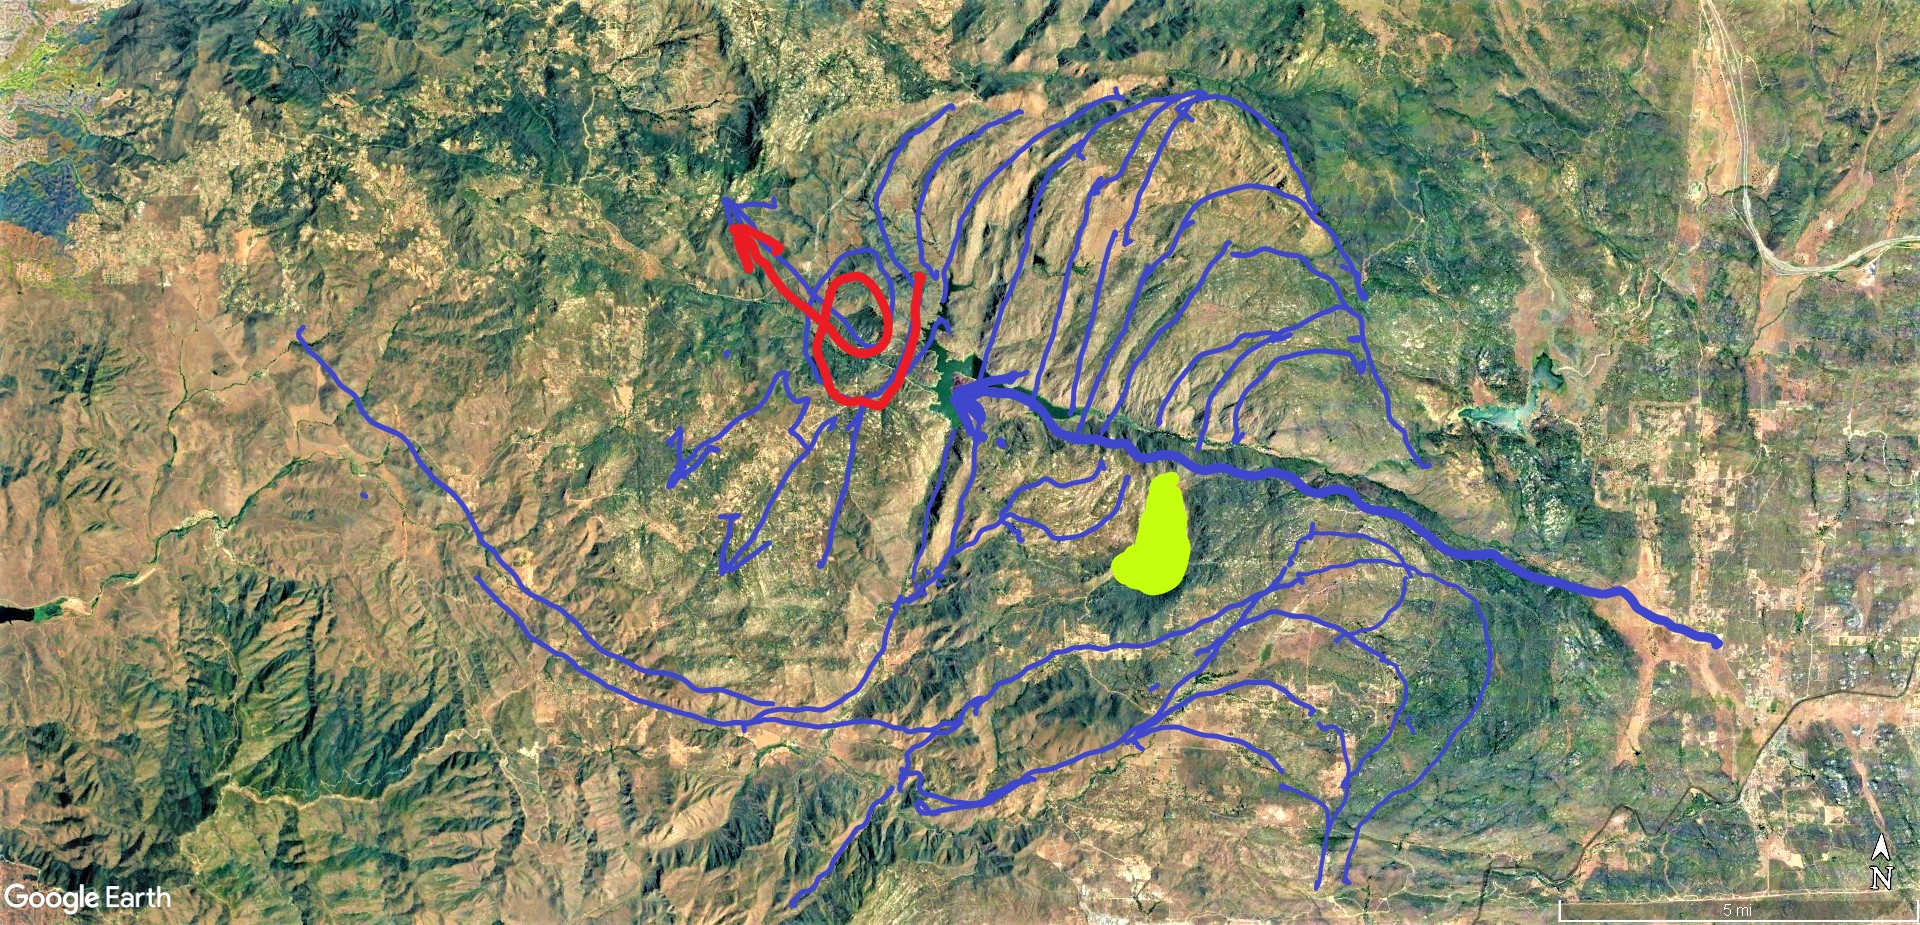
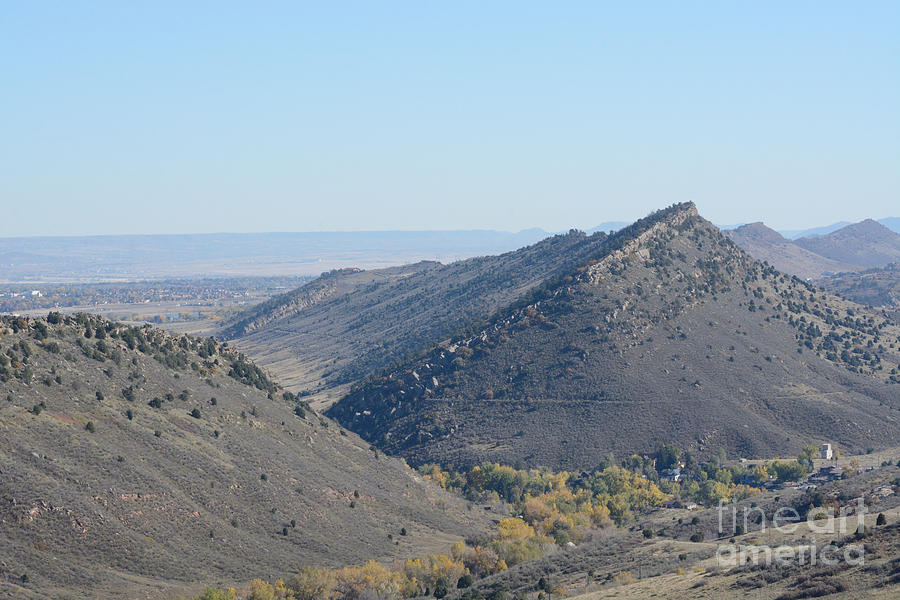
Fractal, self-similarities are everywhere in geology, astronomy, chemistry, biology and anywhere energy moves. It’s why we see Fibonaccian spirals in ocean waves, pine cones and even the eyeball of a bird made of mountains in the Andes. To see a detailed fifteen minute discussion of the fractal nature of mountains, watch “Every Mountain on Earth Matches a Tree Root System“.
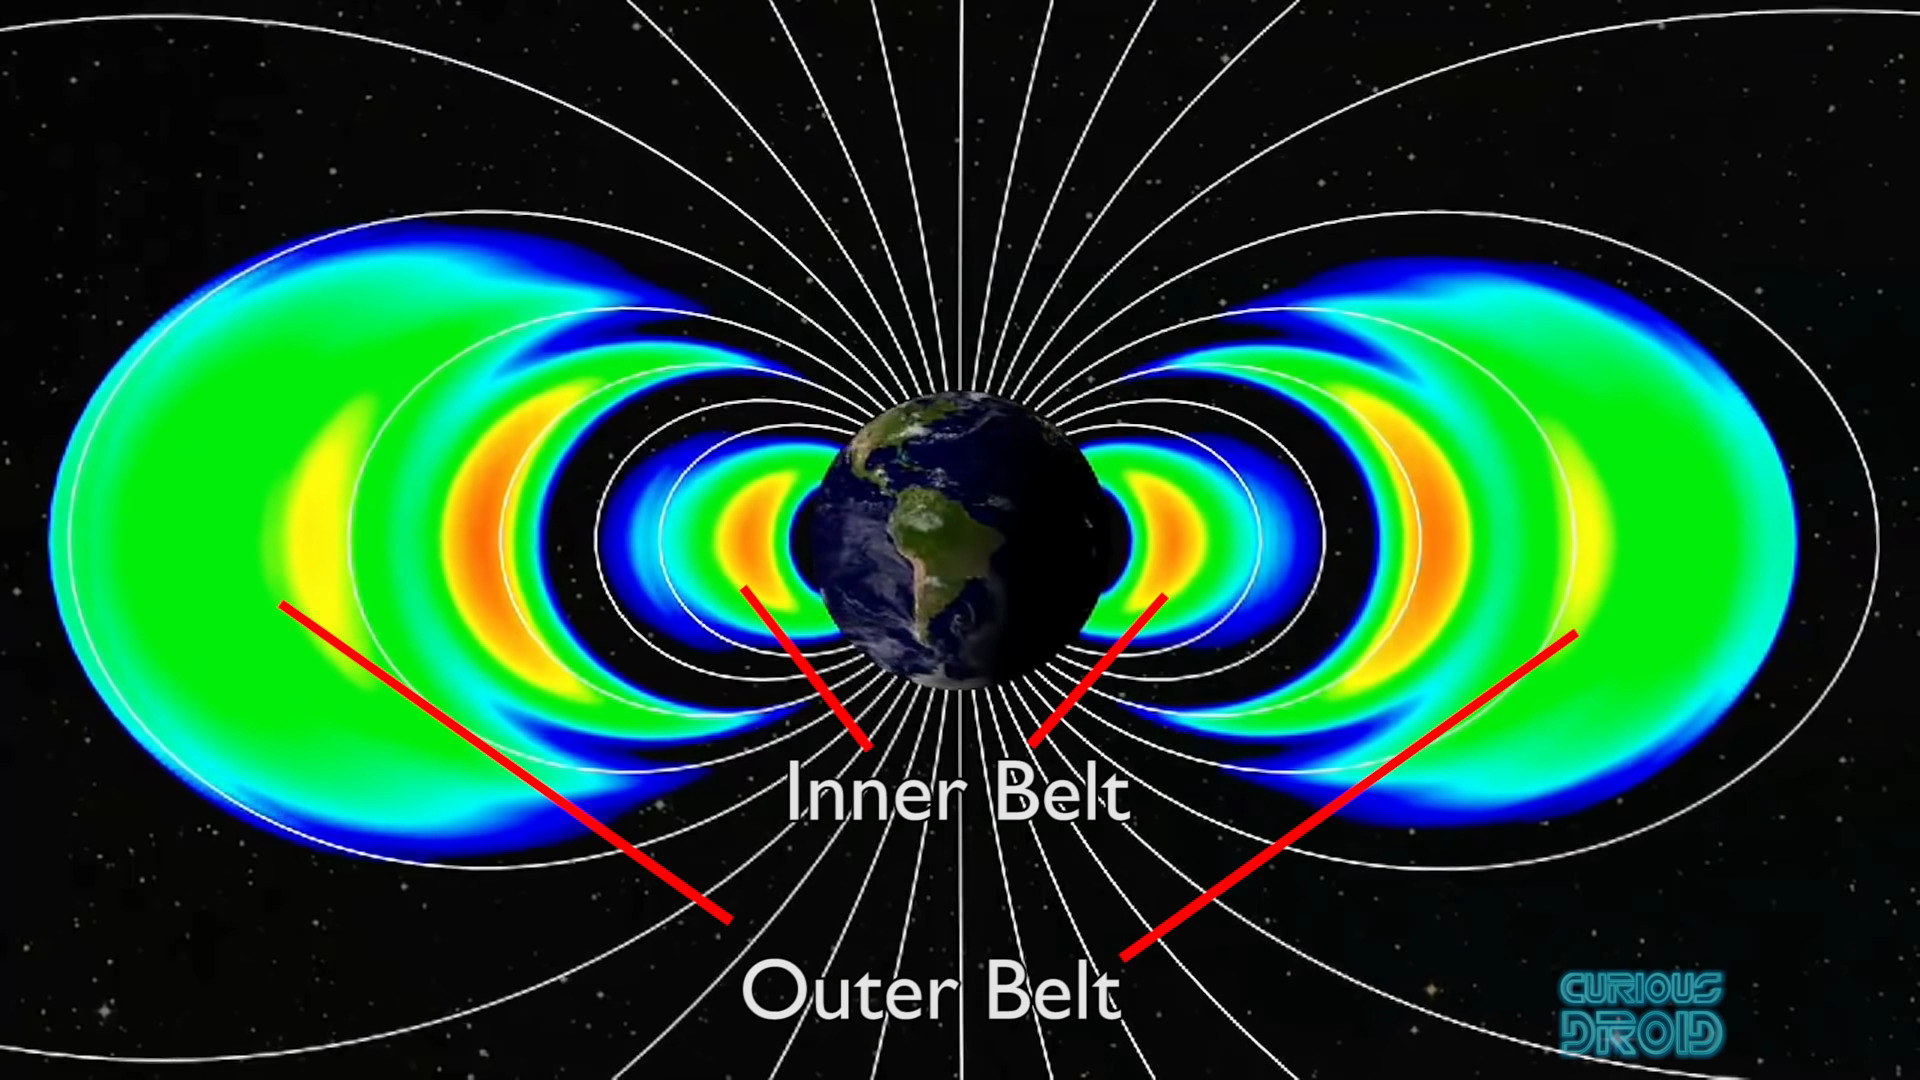
None of it is coincidence. The “tree root system” they describe is the geometry of energy flow out of the Earth. This is more proof of the mirror effect of spherical capacitance in Earth’s electric circuitry. Those are the fractal shapes placed where the crust of the Earth became saturated with charge and the ionic, airborne dust was electrostatically deposited by dusty plasma winds.
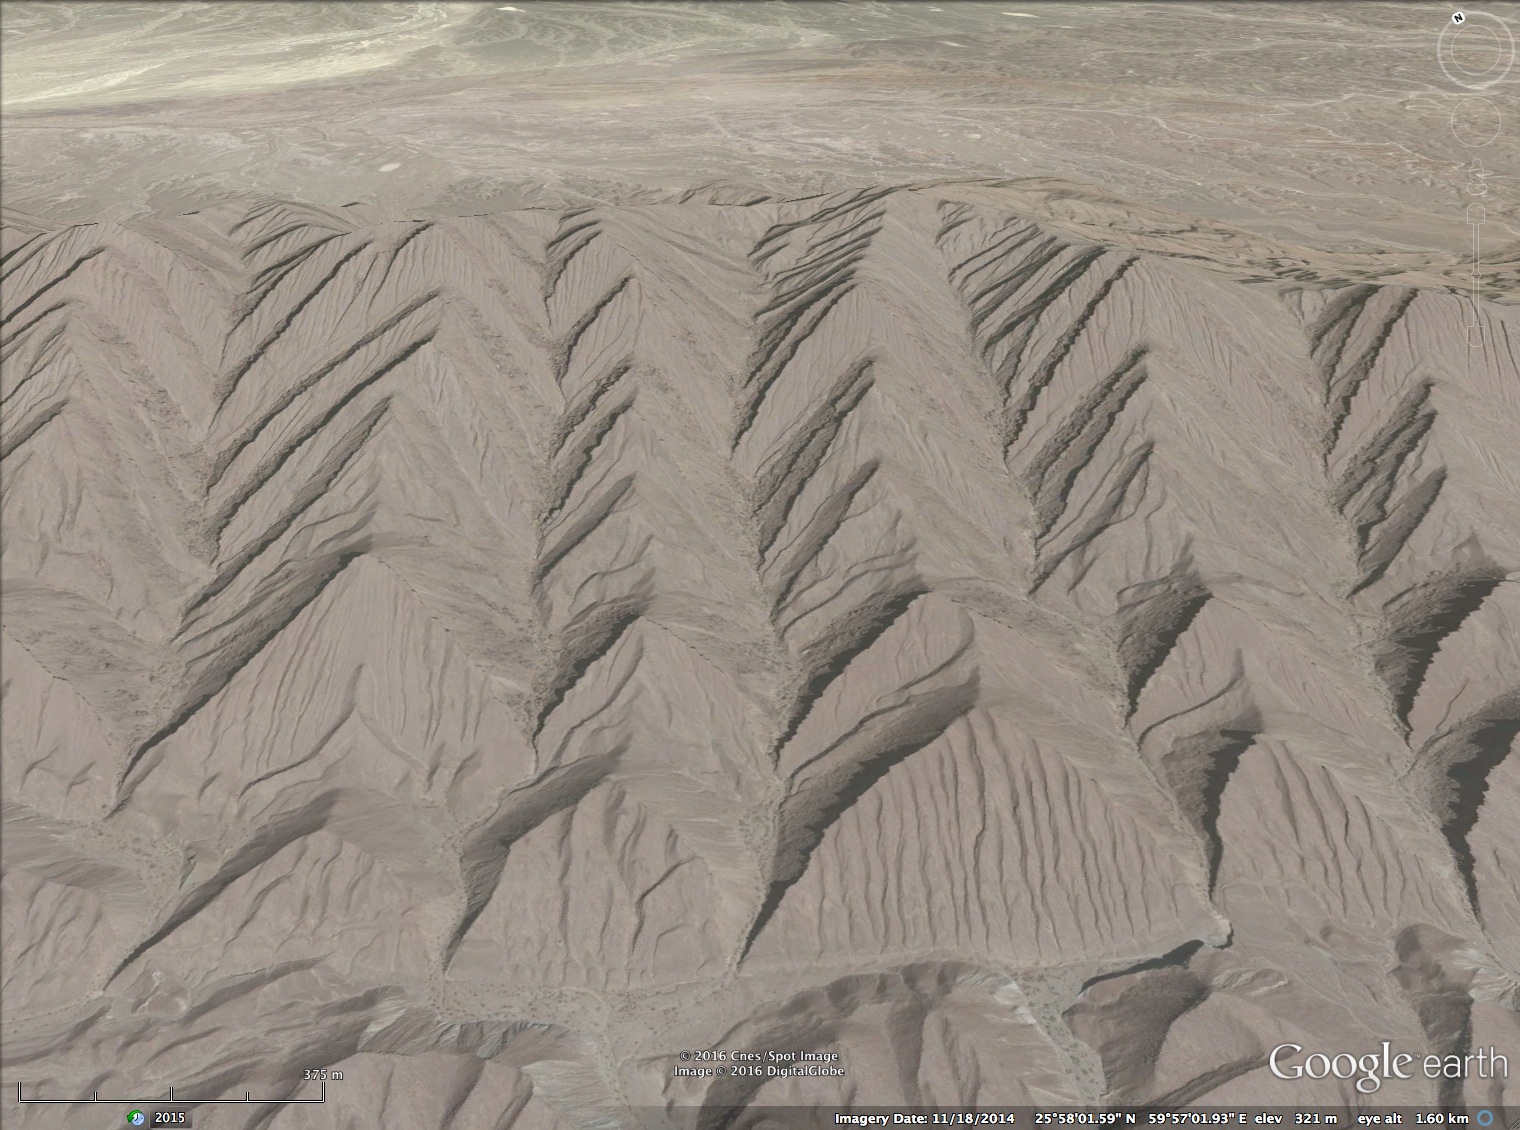
If you watch the linked video, please note how rivers climb to an elevated water source in precisely the same pattern as tree roots grow outward. It is a growth pattern. That is a pattern of creation, not the destructive pattern of erosion. I point this out because it is, like magnetic anomalies and magnetite deposits in river valleys, evidence of my theory that they were carved by electric discharges originating from beneath the crustal perimeters of the continents.
These discharges neutralized the remnant surface charge of the newly deposited ionic mountains. If one understands these things, and they are predictable things if one accepts Electric Universe theory, the Earth’s entire landscape makes perfect sense.


The truly profound thing, however is that circuits are intelligent. That is why we use them to make computers and AI. Artificial intelligence is made with circuitry. It can be made smarter than we are.
But what if the intelligence isn’t artificial? What if that is the natural state of affairs? Maybe it’s time we appreciate that there is coherent information wherever energy flows and that Nature’s circuits are next-level genius.
Carl Jung described a collective consciousness, individuation and synchronicities. Meaningful messages from Nature that imply feedback from an intelligence greater than ourselves and beyond the perception of the five senses. Though the spiritual aspects of his work are barely tolerable to science, they ring true to the human experience.
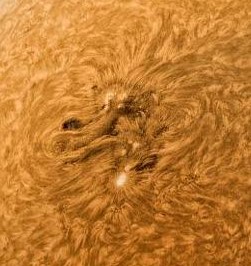
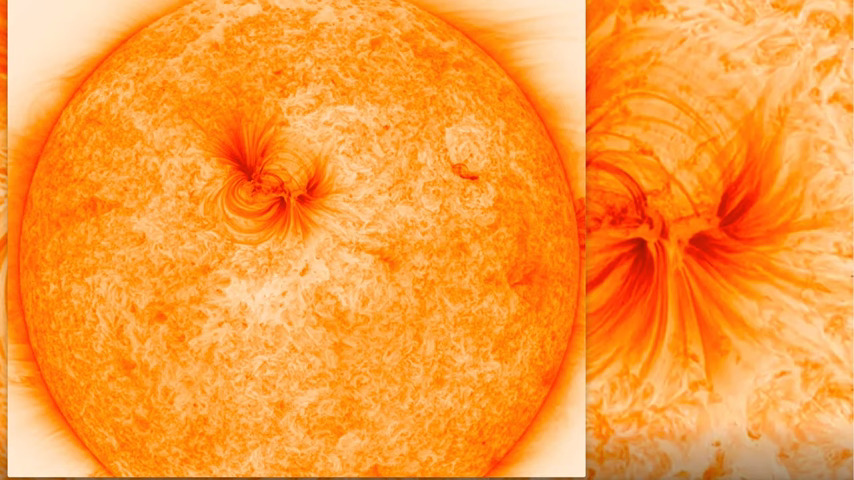
Rupert Sheldrake refers to fields of “Morphic Resonance” – the holographic patterning that repeats across time and scale to present the same patterns again and again. He’s posed the question: what if the Sun can think? I say it can, but circuitry is more to the point because a circuit is the pattern of energy that produces a field, and it can do calculations.
The “key” to the Universe, I believe, or at least as close as we can get, is the geometry of the circuit inside every bubble and the energy and information stored in its surface tension. That should be the irreducible, holographic basis of repeating, geometric self-similarity throughout Nature.
Waveforms come in geometries. They are not random. They are geometric, fractal and reproducible at any scale. The Fibonacci sequence, Sine waves, bell curves, trigonometry, algebra, calculus, differential equations and at the root of it all, geometry are all ways of describing waveforms, which is the topography of the Aether and all that comes from it.
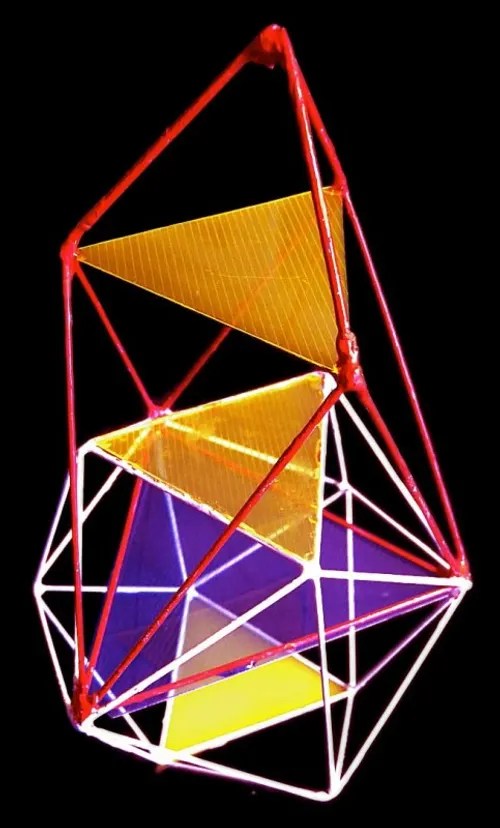
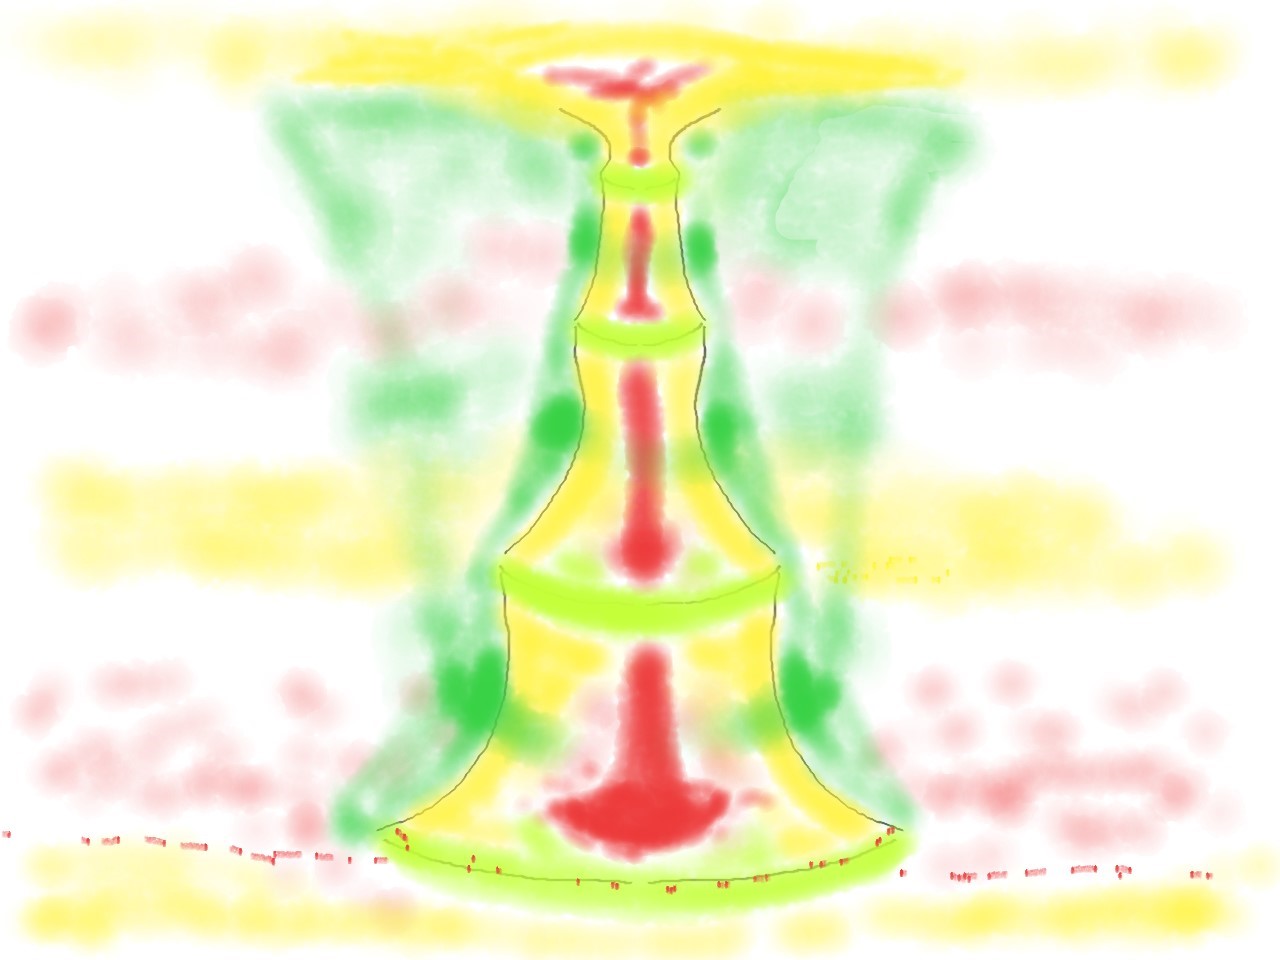
A DIY truth seeker who’s channel name is Scientific Lee calls it “God’s Double Helix“. Buddy James artfully portrayed it in “Geometry of the Electric Universe“. Frank Chester defined a geometry and mechanism of its structure called the “Chestahedron” – a seven-sided platonic form that seems to be a superposition of all platonic forms. It is amazing to see it’s geometric relationship to the Earth, polar aurora and the human heart; it’s the most holographic of holographic designs.
These gentlemen are natural philosophers, not credentialed physicists. Yet they are describing and demonstrating a simple, extremely relevant and fundamental truth about Nature’s design that seems to be missing in the complexities of consensus theories.
This is the alchemy of gnosis. Alchemy has nothing to do with any religion, incantations, turning lead to gold, or distilling urine to make a philosopher’s stone. Alchemy is transmuting the spiritual experience to conscious understanding. The work of alchemy is to become aware and open-minded to what Nature says and how she says it. It sounds easy, but it’s harder than it sounds.
Unassailable knowledge yielded freely by Nature is called gnosis. Gnosis is, I-know-because-I-saw-with-my-own-eyes kind of knowledge. Witness, listen, gratefully feel the flow of energy through Nature, and the information sought will arrive as if invited, because it is already there waiting to be noticed. This is the point I need to drive home. It’s a hologram. The information is everywhere waiting to be noticed.
Isaac Newton, a self acclaimed alchemist, and Nikola Tesla, who talked to pigeons, did not lay the foundations of science and technology with equations. They became aware of what they were seeing in Nature and the math fell out as a byproduct. Real science isn’t theorizing, or simulating, it’s learning how to recognize Nature’s electromagnetic magic.
It isn’t as if knowledge doesn’t exist. The problem is most people aren’t ready for it. Recognizing our mind and body are elements of a circuit who’s source is cosmic energy acknowledges that we as humans are antenna, receivers, transducers and transmitters of energy made manifest through our will and actions. We broadcast whether we want to, or not. Free will means a constant choice between constructive, or destructive interference. There is no sitting on the fence, and this makes some people uncomfortable.
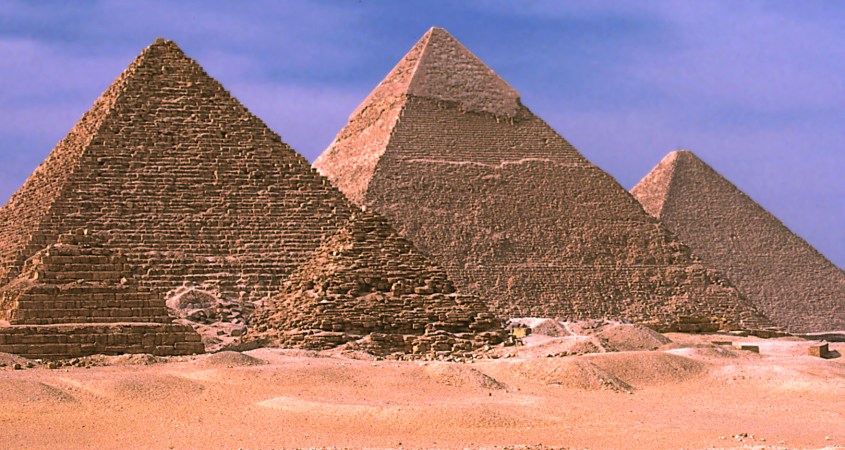
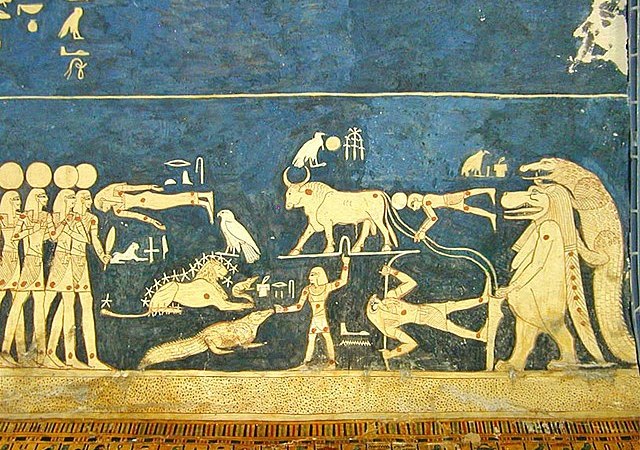
We are designed to recognize patterns, because patterns of structured energy is the language of the Cosmos. Ancient Greeks understood. They learned it from Egyptians. Secret societies know. Hermetic traditions, Gnostics, mystics, wizards and witches of all stripes at some level understand that everything has conscious energy within. They know the flow of energy and its geometry are at the root of all meaning. They know because they have learned to some degree how to recognize its feedback and use, for better, or worse, its power and knowledge.
The mystical nature of a hologram is in the fact it’s pattern – its information – is available holistically throughout the entire image. Torn apart, every element holds the knowledge of the whole. It is because the information is encoded and coherent with the energy – the frequencies of light waves making the hologram – that it is available everywhere in that field of energy. The field of energy available to all of us is the entire Electric Universe. Proof is everywhere waiting to be noticed.
The Electric Universe and the knowledge it brings comes with receipts – proofs that our theories actually work. They work because they have always been based on the idea that we are all of one energy from one coherent source. We are entangled because everything is entangled with the same coherent energy. Telepathy, premonition and gnosis is expected in a holographic universe, because unseen harmonies, echoes and feedback are natural to the environment. It’s only in a material narrative governed by gravity where these things can’t make sense.
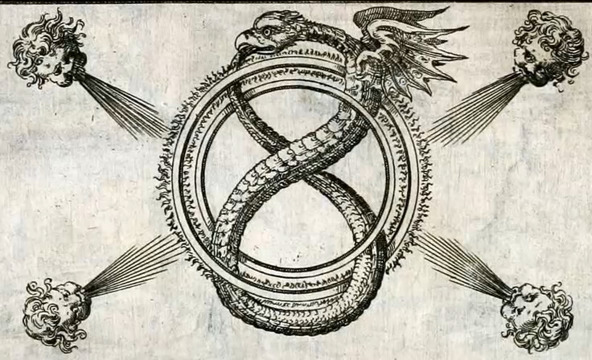
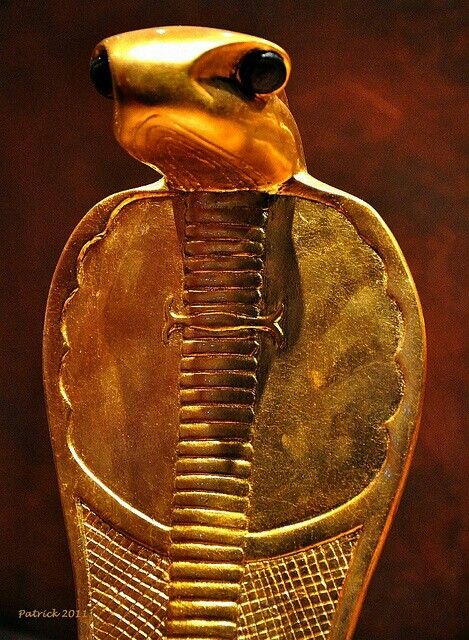
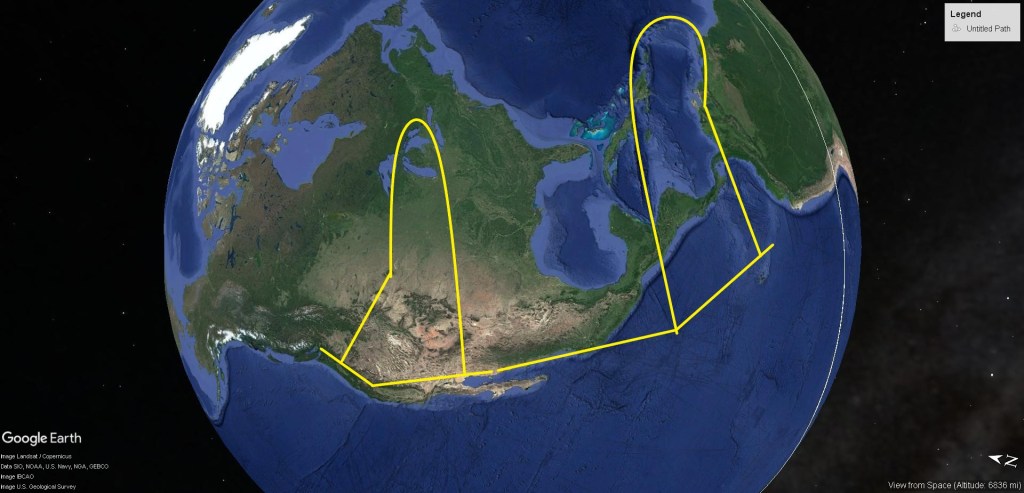
Some day we’ll discuss the Rooster in Asia, the Dragon in Europe, the Cobra in Africa, the Ouroboros in North America and how these spirits of the mountains came to be. Or you can look for yourself and figure it out, because the information is there to see.
Thank you.