
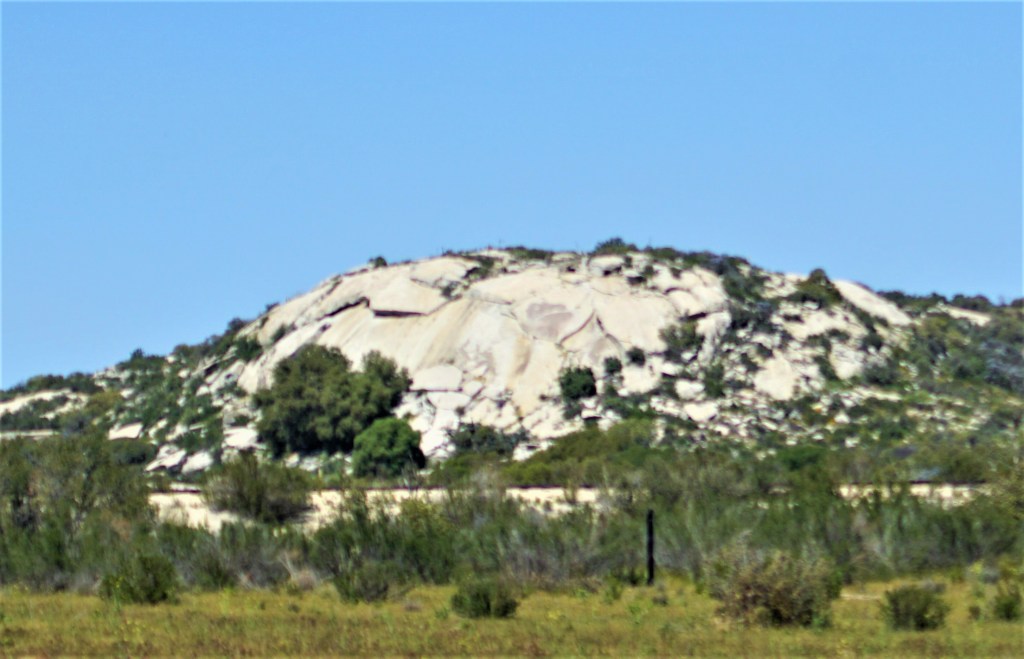
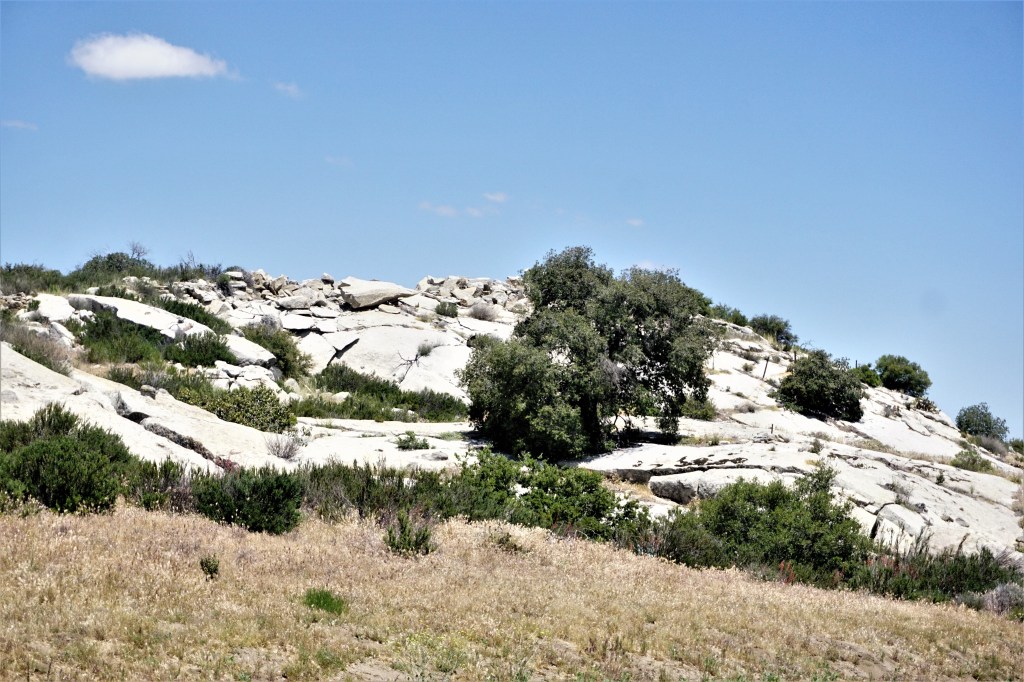
Between the Borrego Desert and the pine covered peaks of Cleveland National Forest in eastern San Diego county, California, there is a domain of solid granite called the In-Ko-Pah mountains. The In-Ko-Pah’s have nary a tree; only coarse, manzanita chaparral that springs from chinks in the rock, like the hair of an armadillo. It’s a barren, broken land, forsaken to brooding hoodoos, rodents, snakes and decomposing granite.

Place names give it’s mood: “Valley of the Moon”, Devil’s Canyon, the optimistic “Boulder Park”, and “Coyote’s Flying Saucer Retrieval and Repair Service”. Most notable is the “Desert View Tower” in In-Ko-Pah canyon. The tower is made of the native granite, and stands Tolkenesque, commanding a view of the wizard’s cauldron around it.
As a child I remember the tower had a coffee shop. We never stopped, because “…we’re almost there”… there being still two hours away. I wistfully watched it’s golden glow, suffused with coffee and sweet-roll smells, pass from the backseat of a ’50’s Cadillac, a ’60’s Lincoln and two ’70’s Ford LTD’s. It presented a glowing warmth for the traveler, standing high above the road in this stark, alien landscape.
As it happens, I’m living here now. In a rural, mountain community called Potrero, which lies in this ‘cauldron of granite’ region, where I have taken the opportunity to look at the rocks.
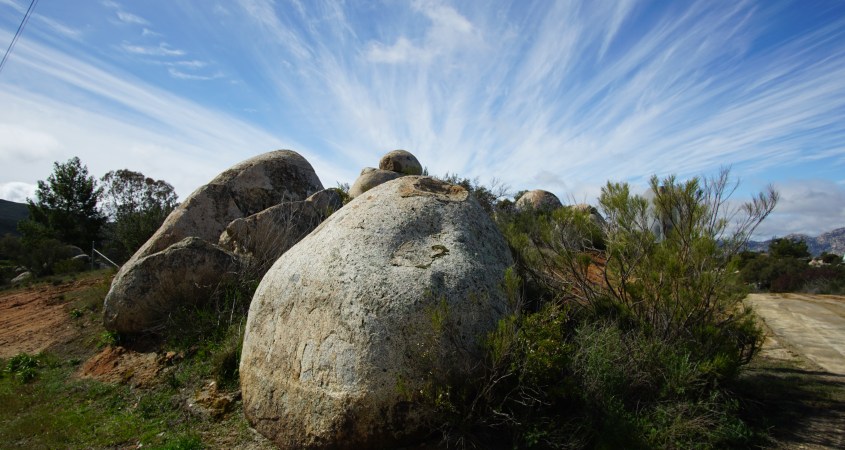
What I conclude from observations is that these granite boulders are bubbles of boiled sand. Not hollow bubbles, but solid drops of granite, formed as boils at the surface of a hot fluid matrix. ‘Cauldron of Granite’ is an accurate description, as the energy came from below, and by electrolysis and thermal convection, boiled through layers of sand to the surface, liquifying the sand in the process, like one would melt metals in a cauldron.
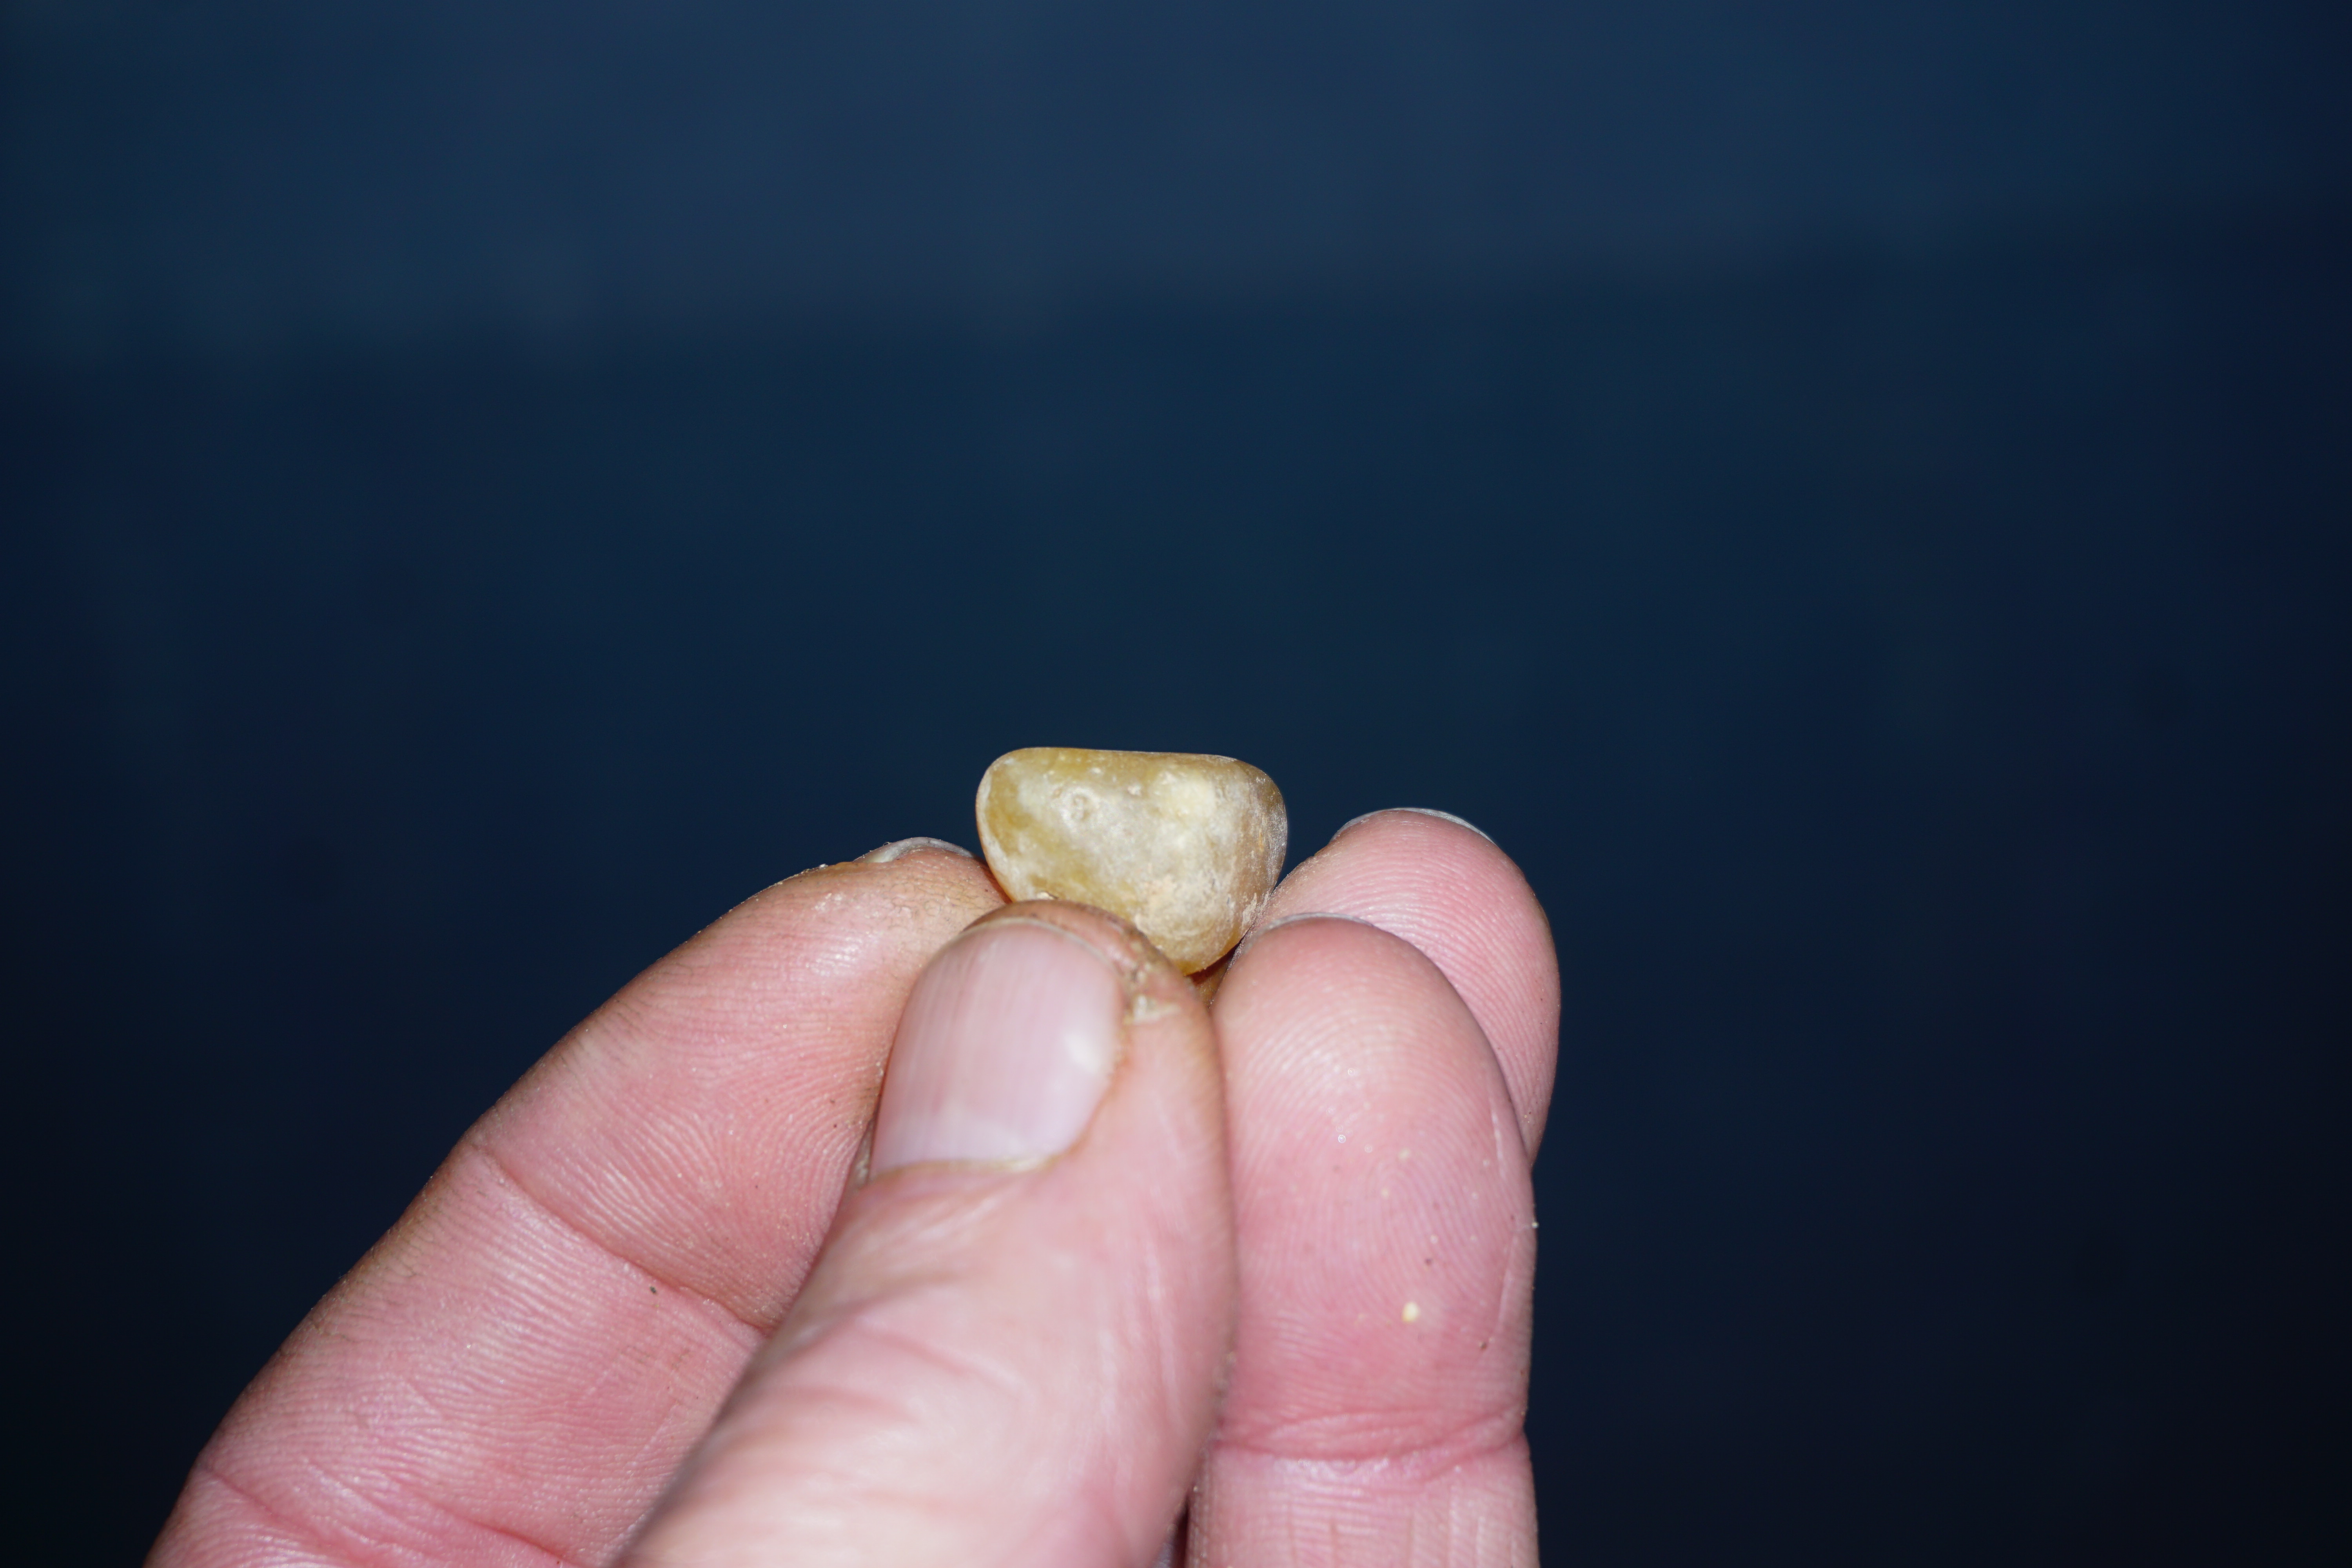
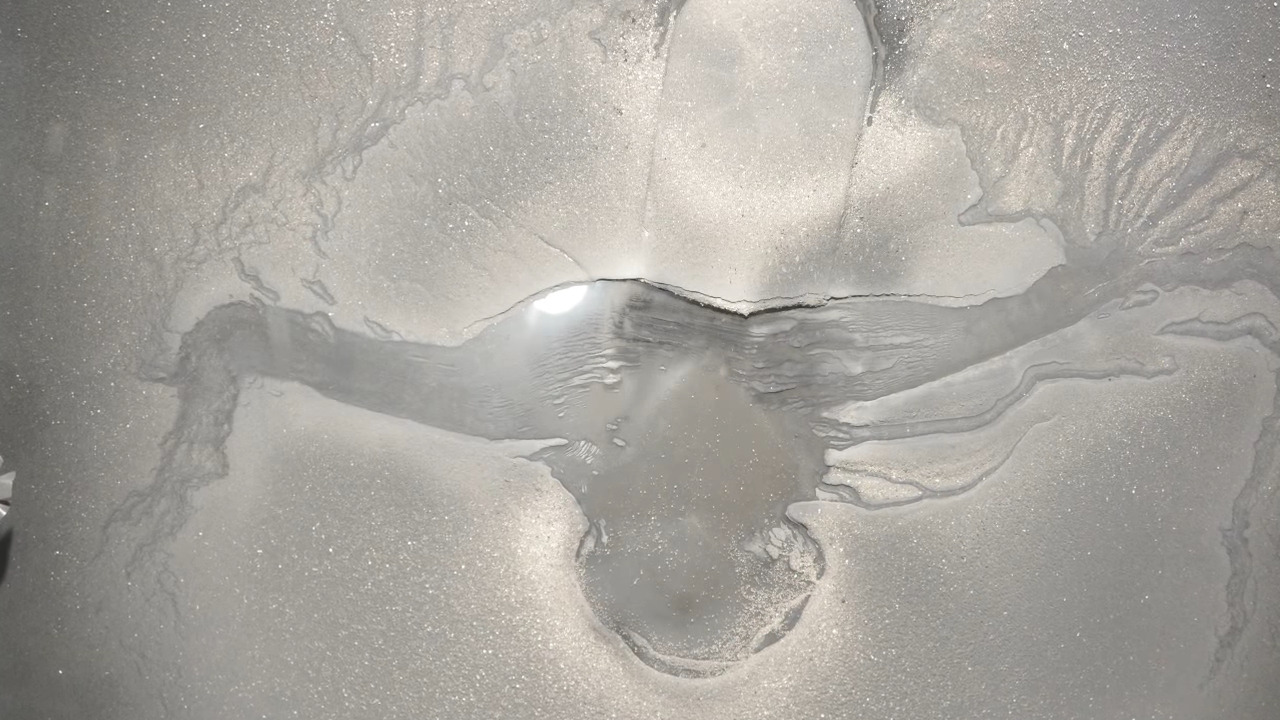
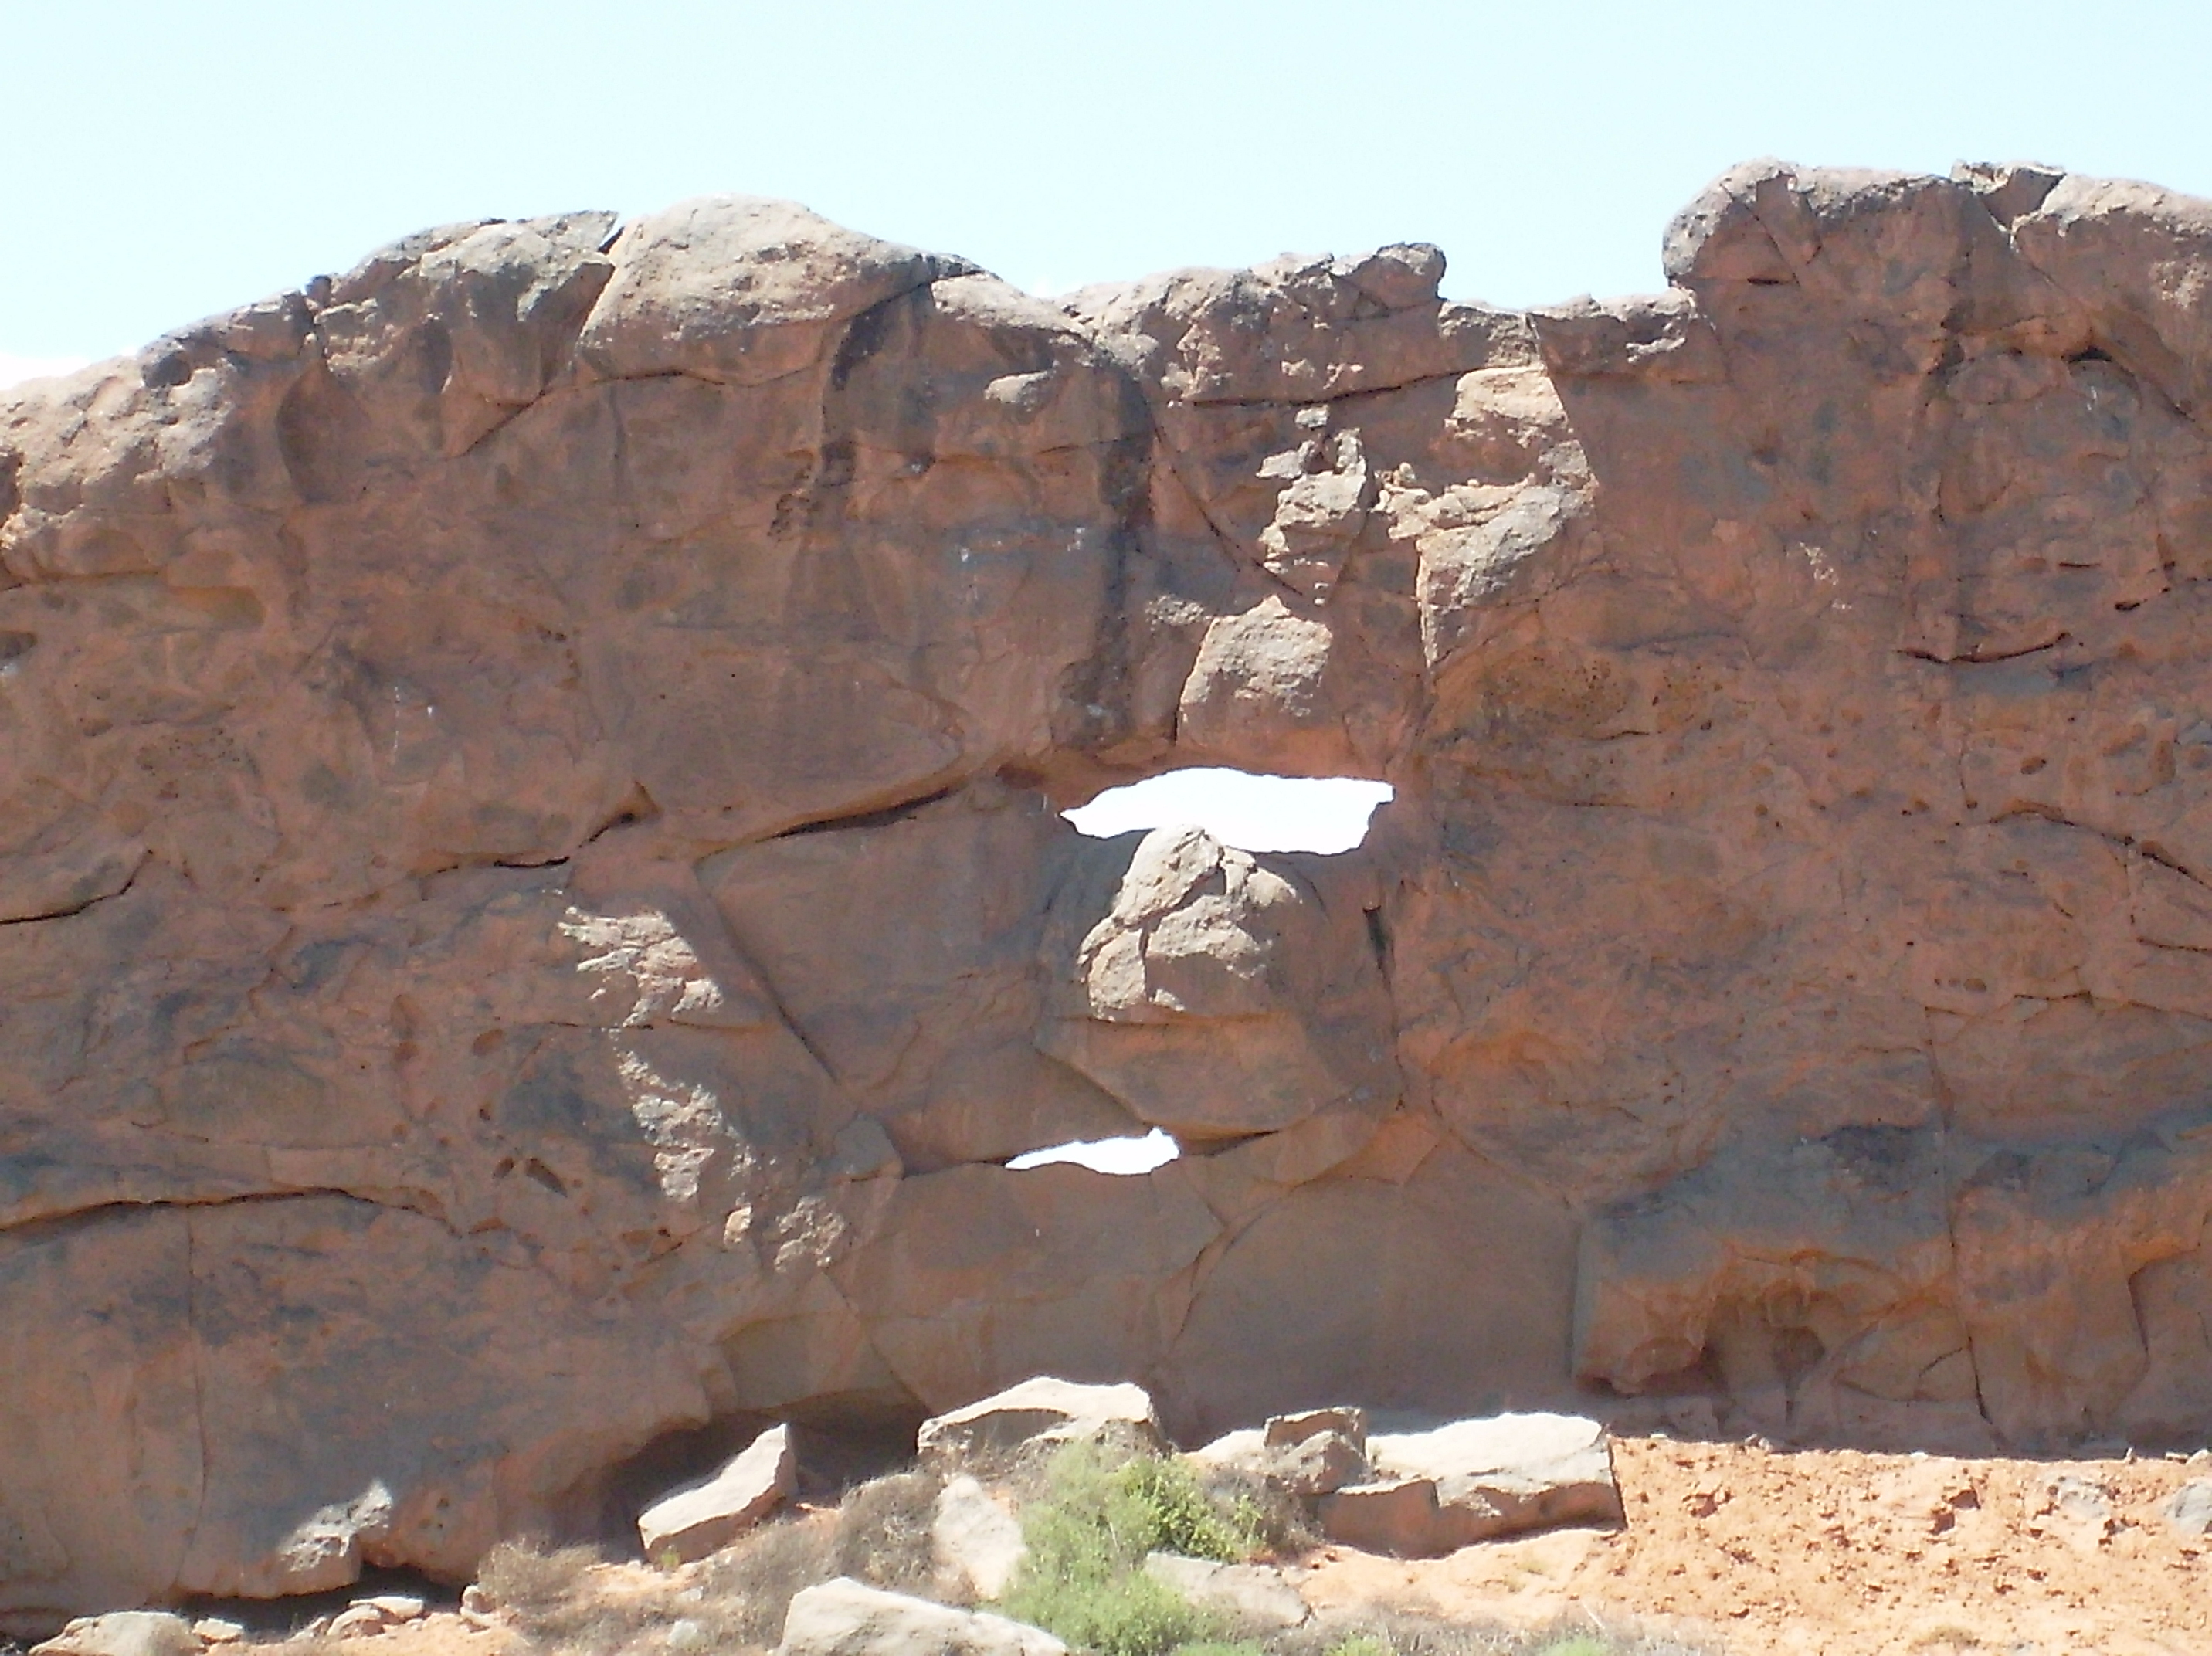
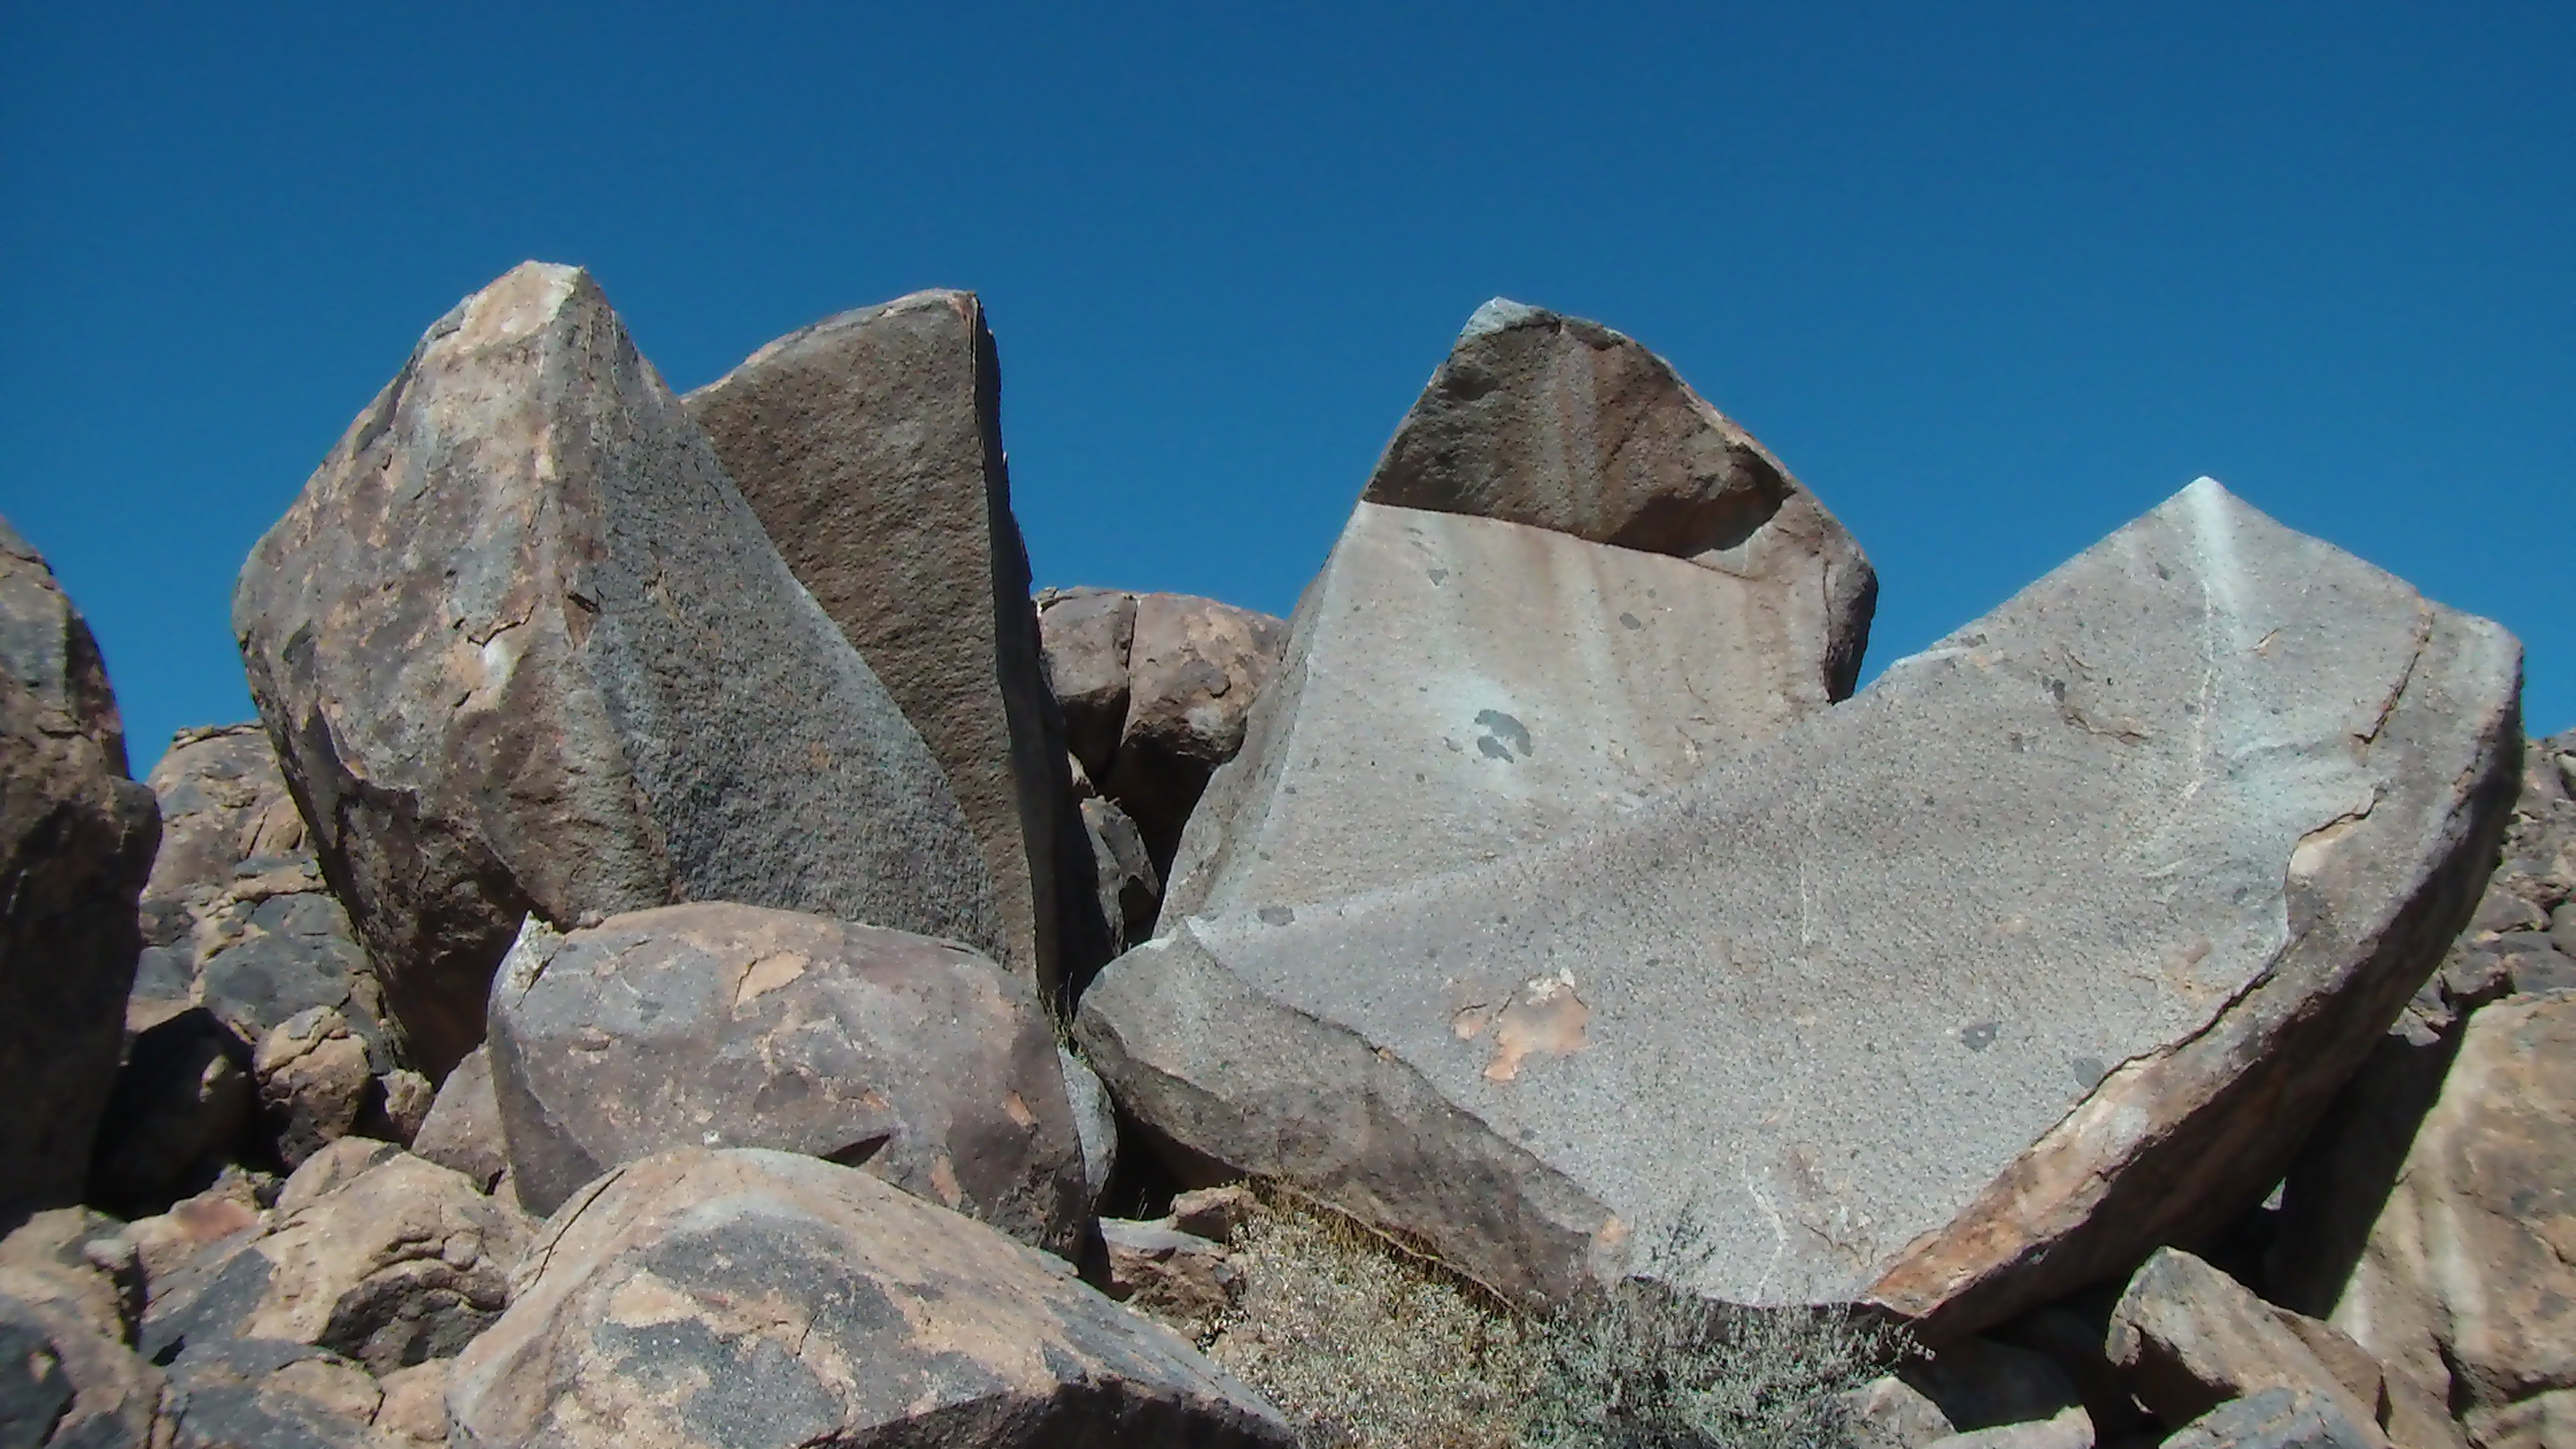
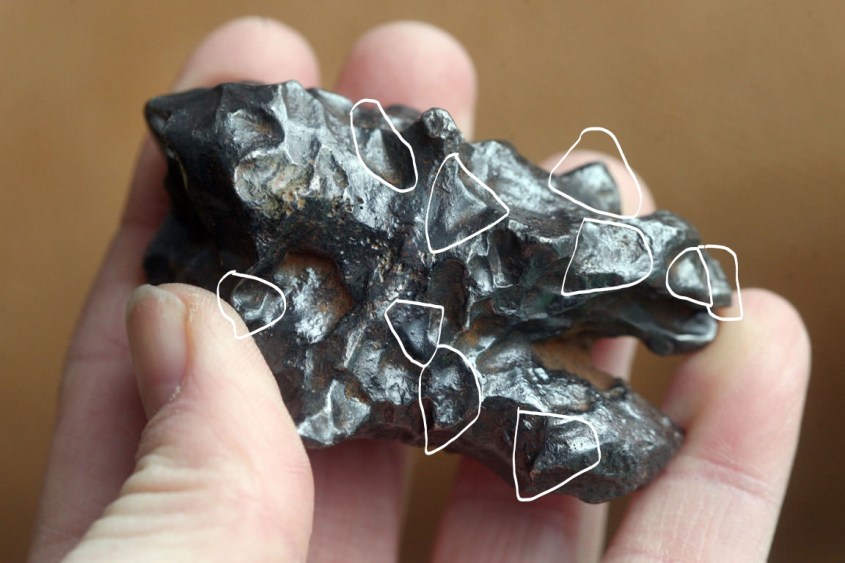
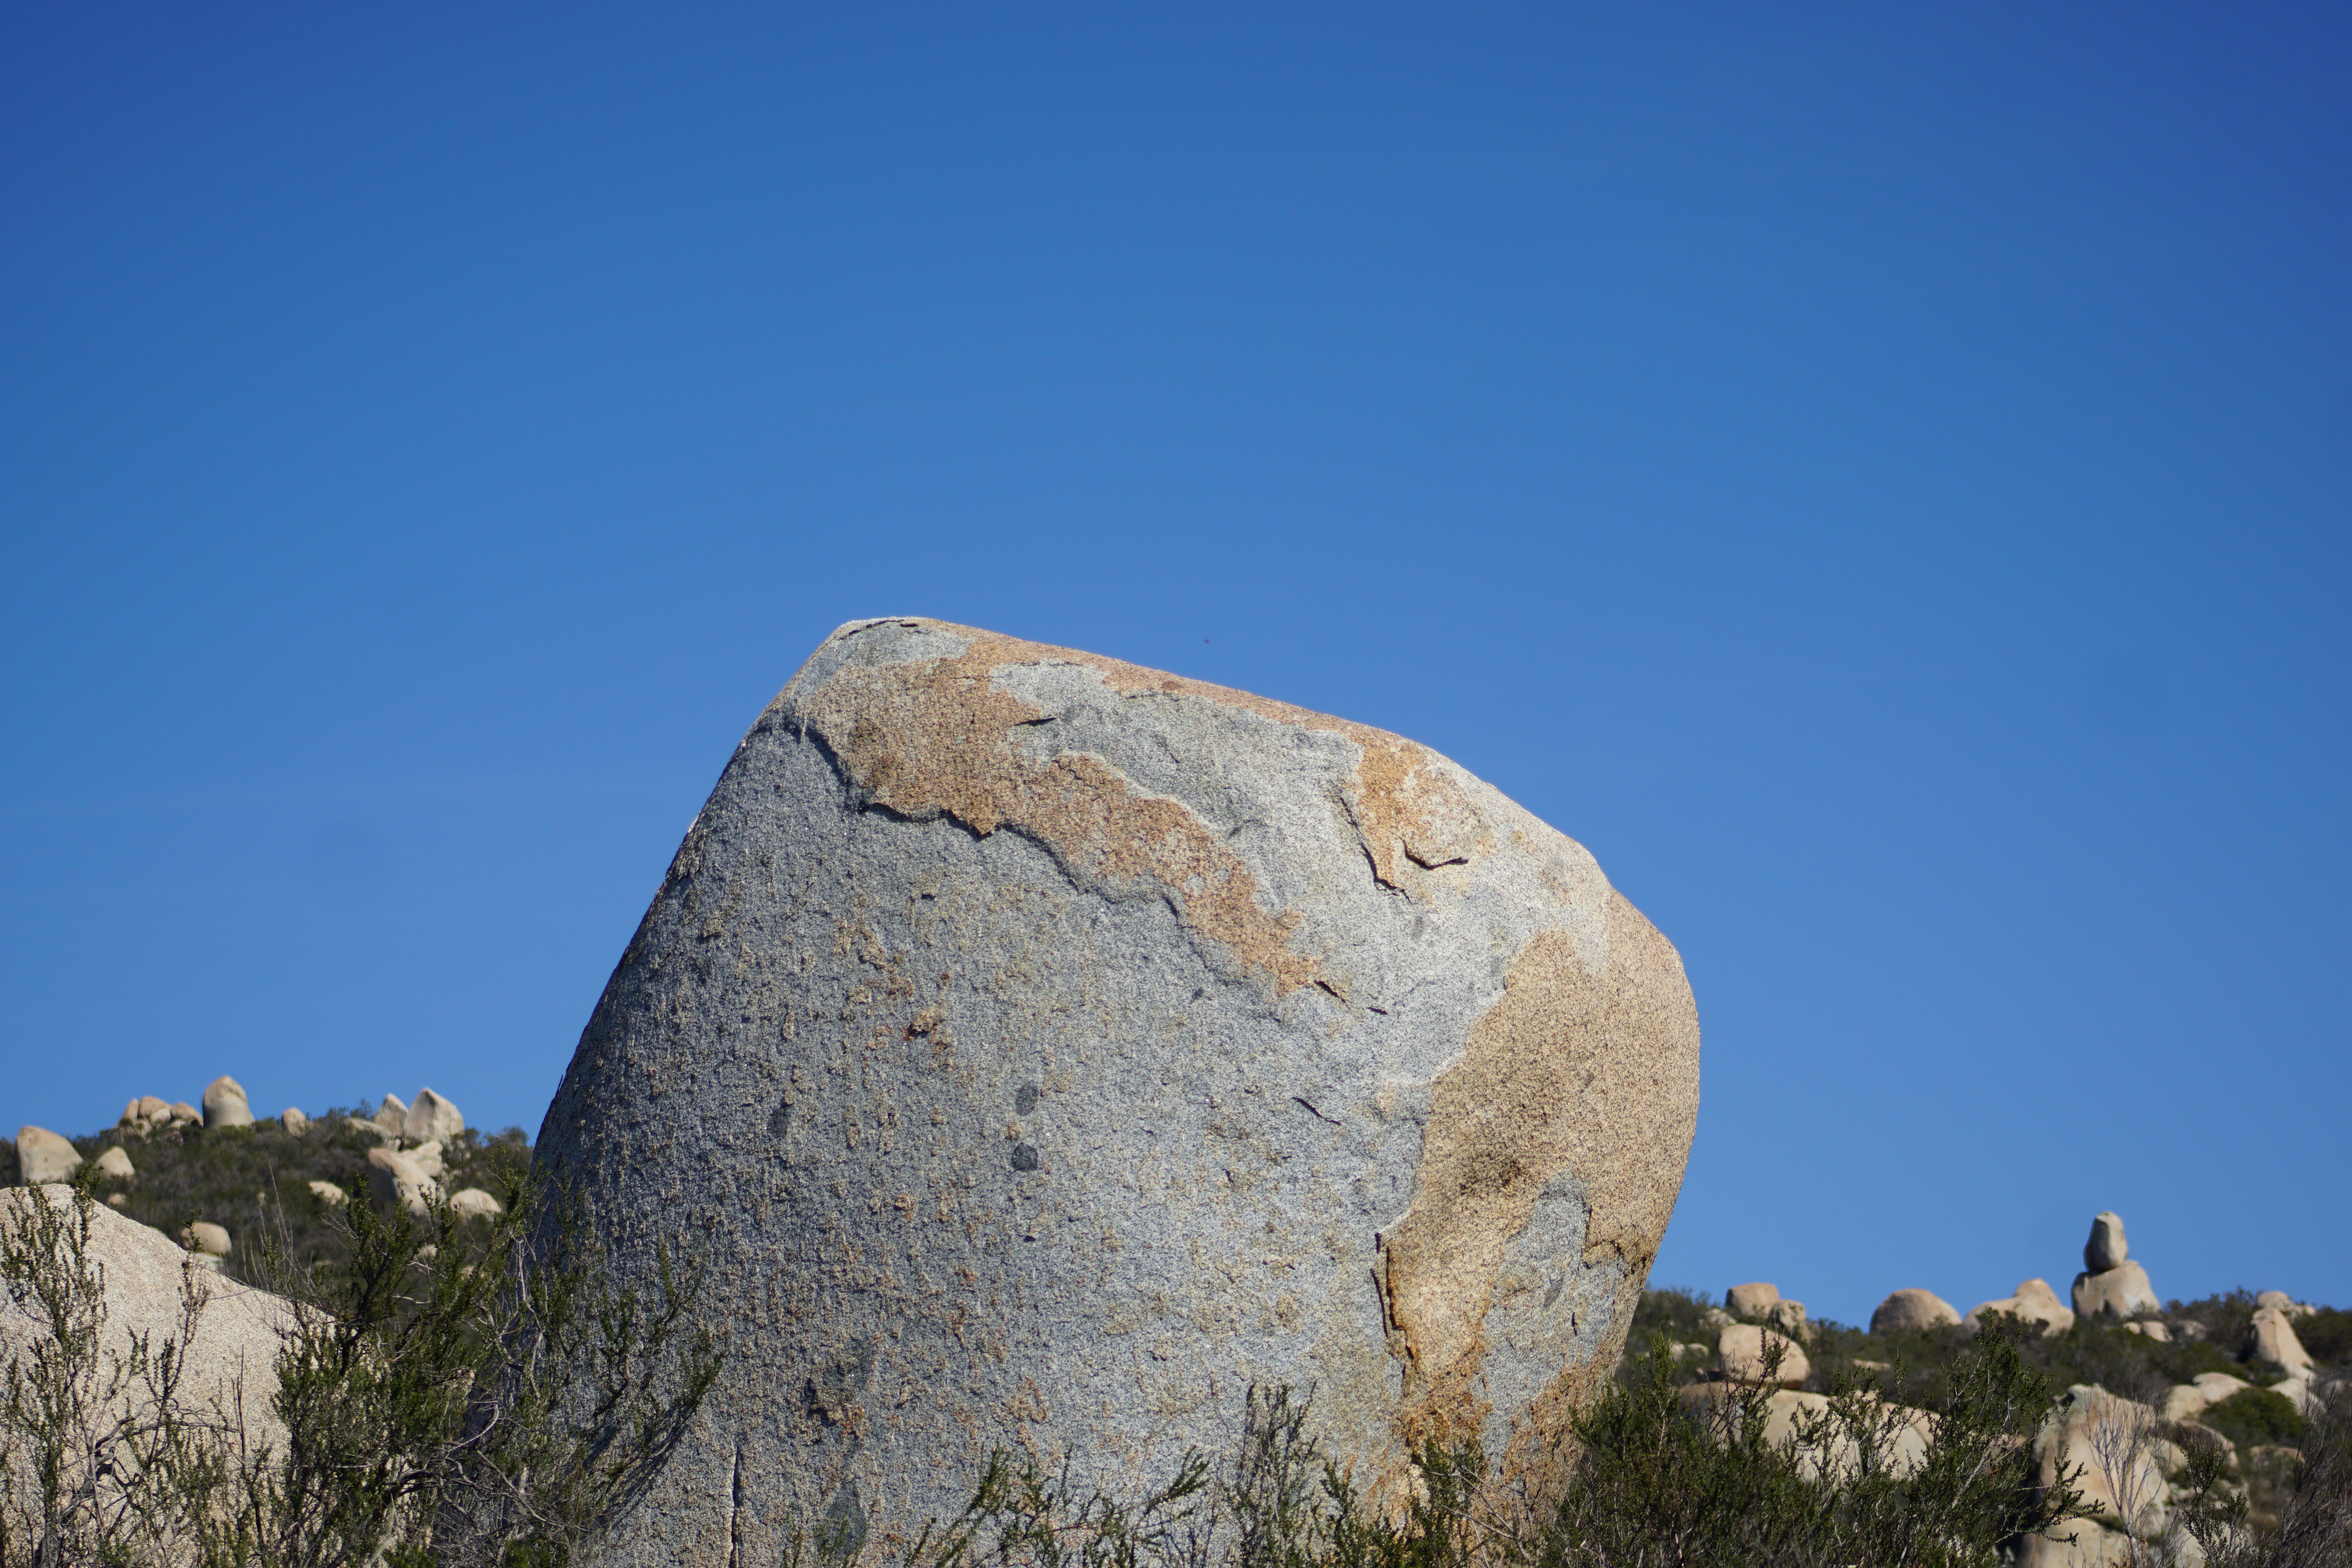
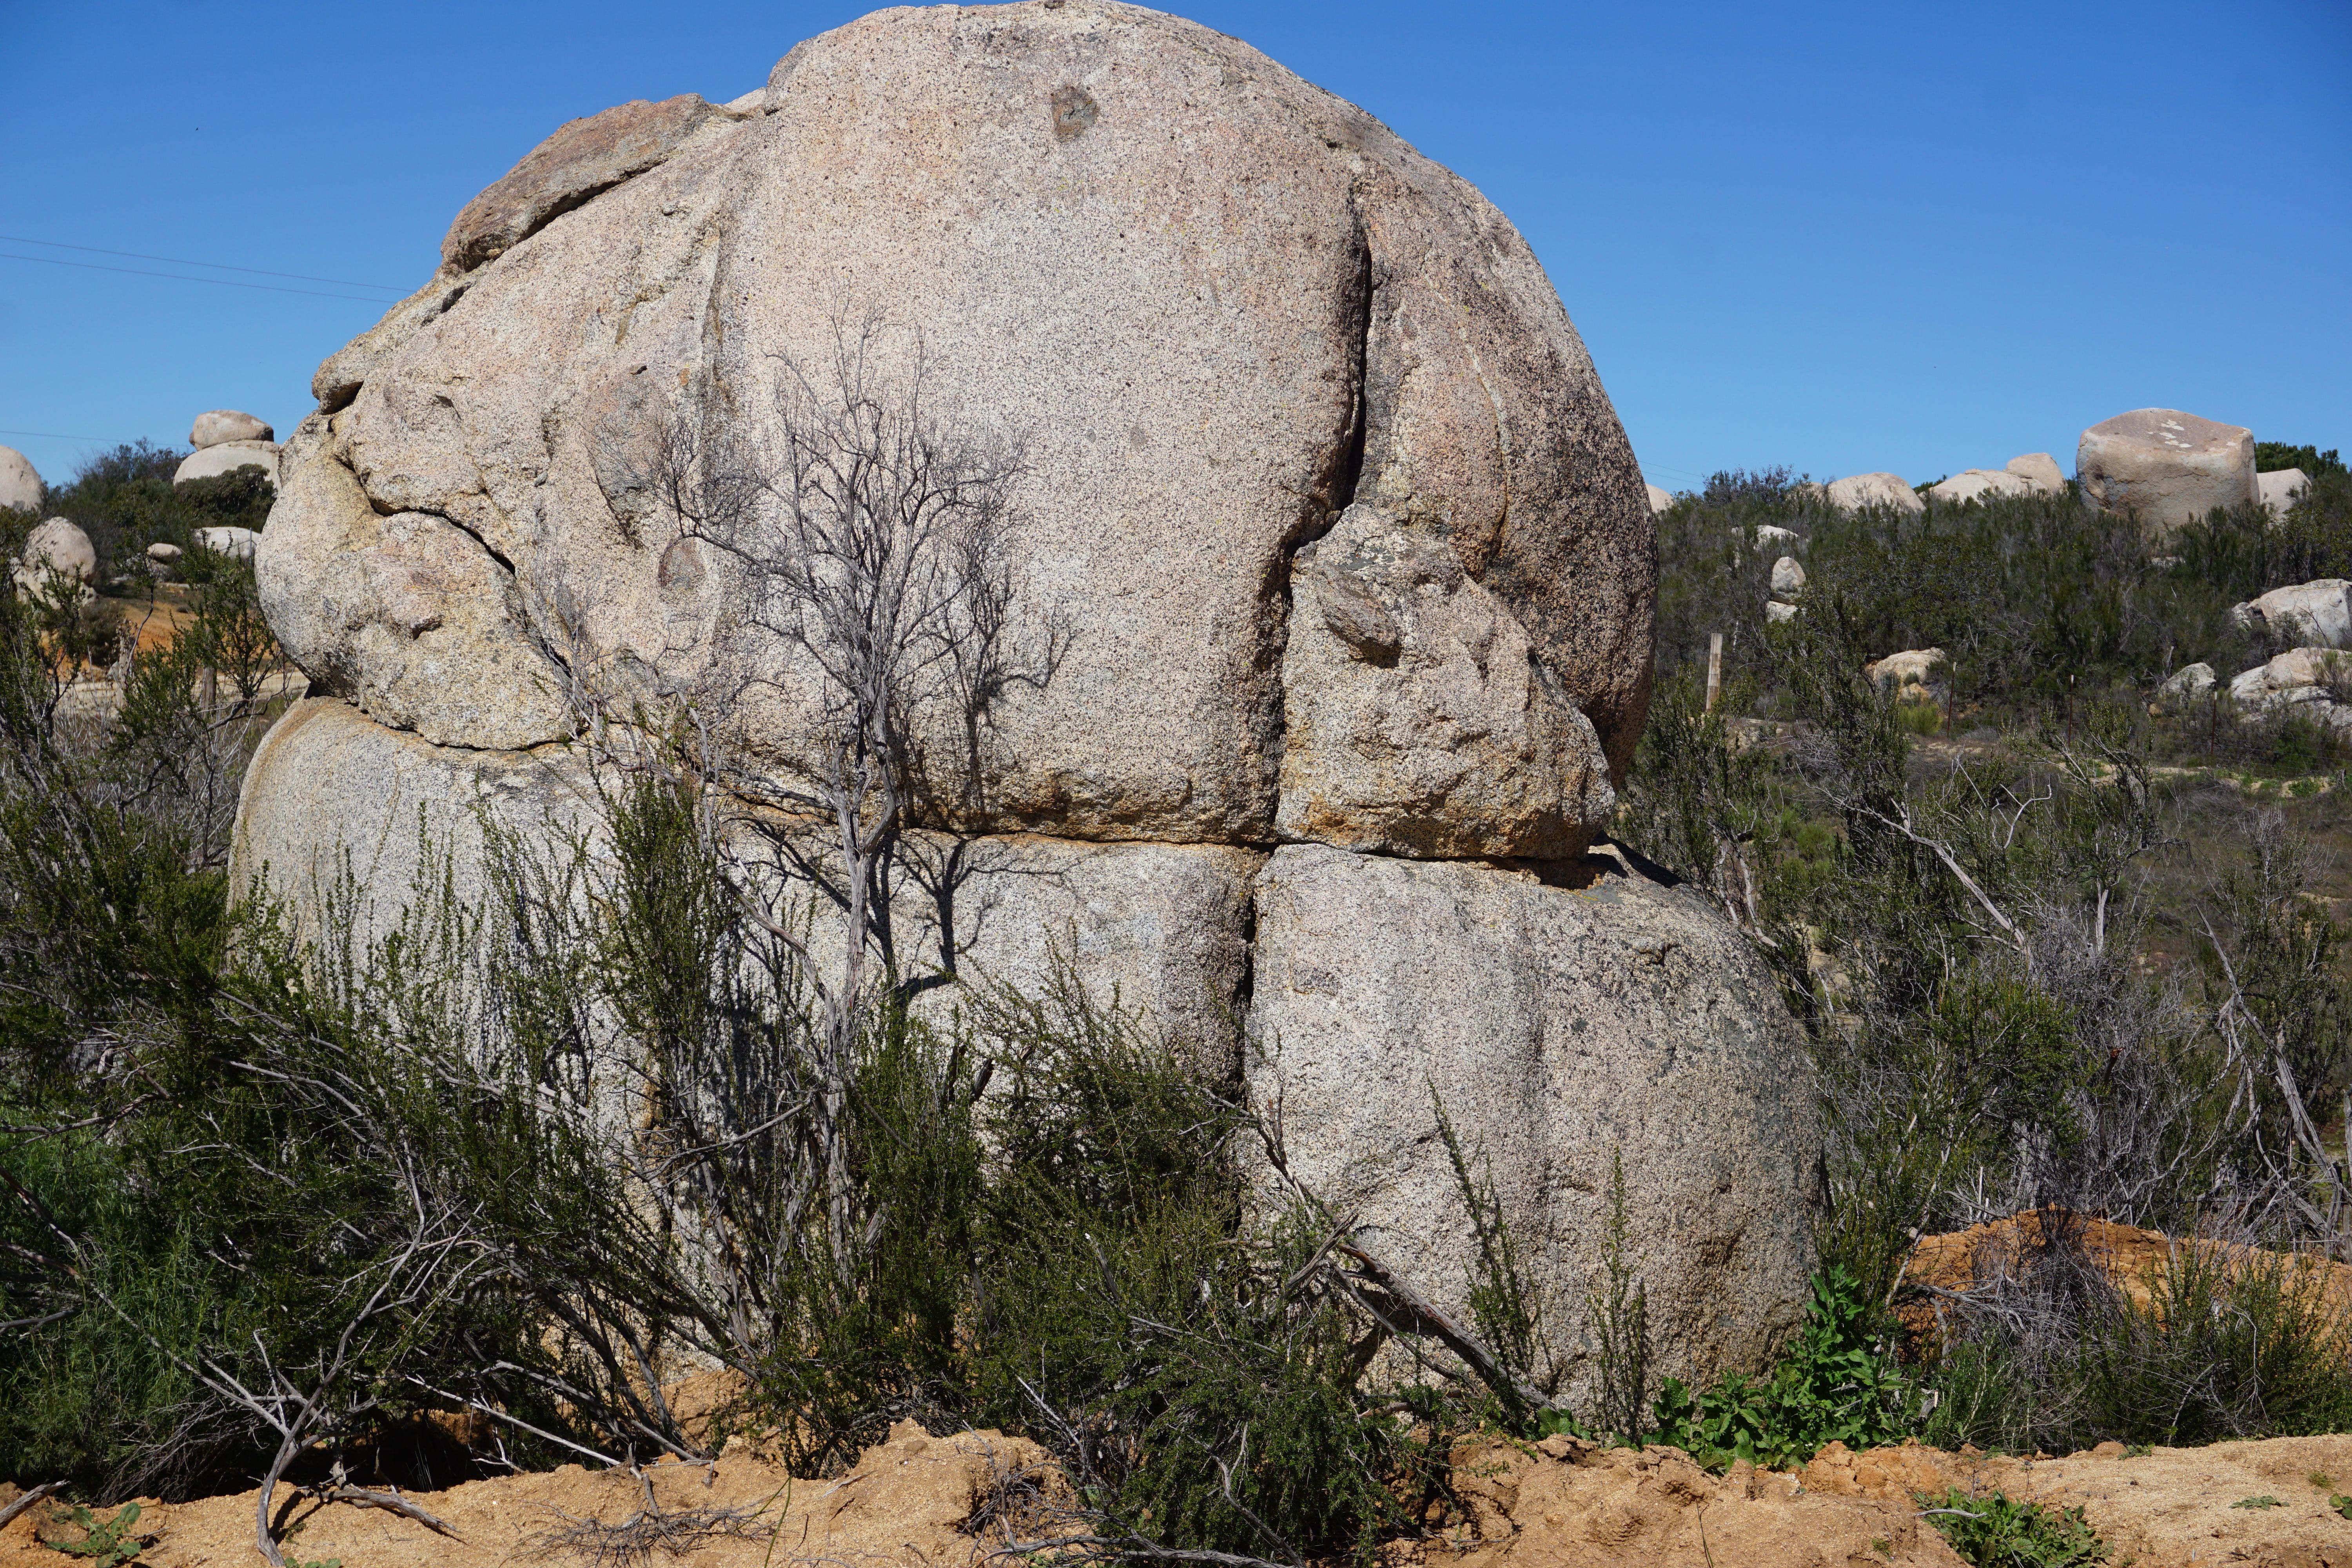
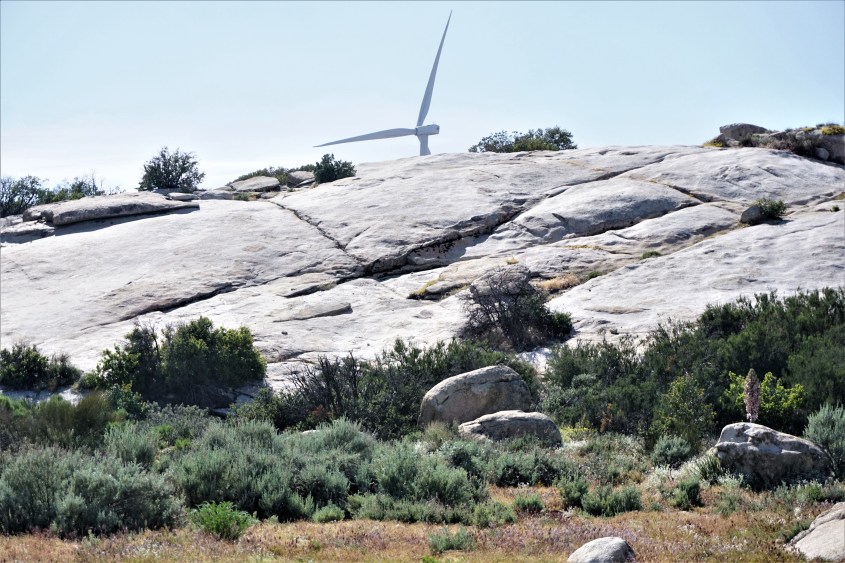
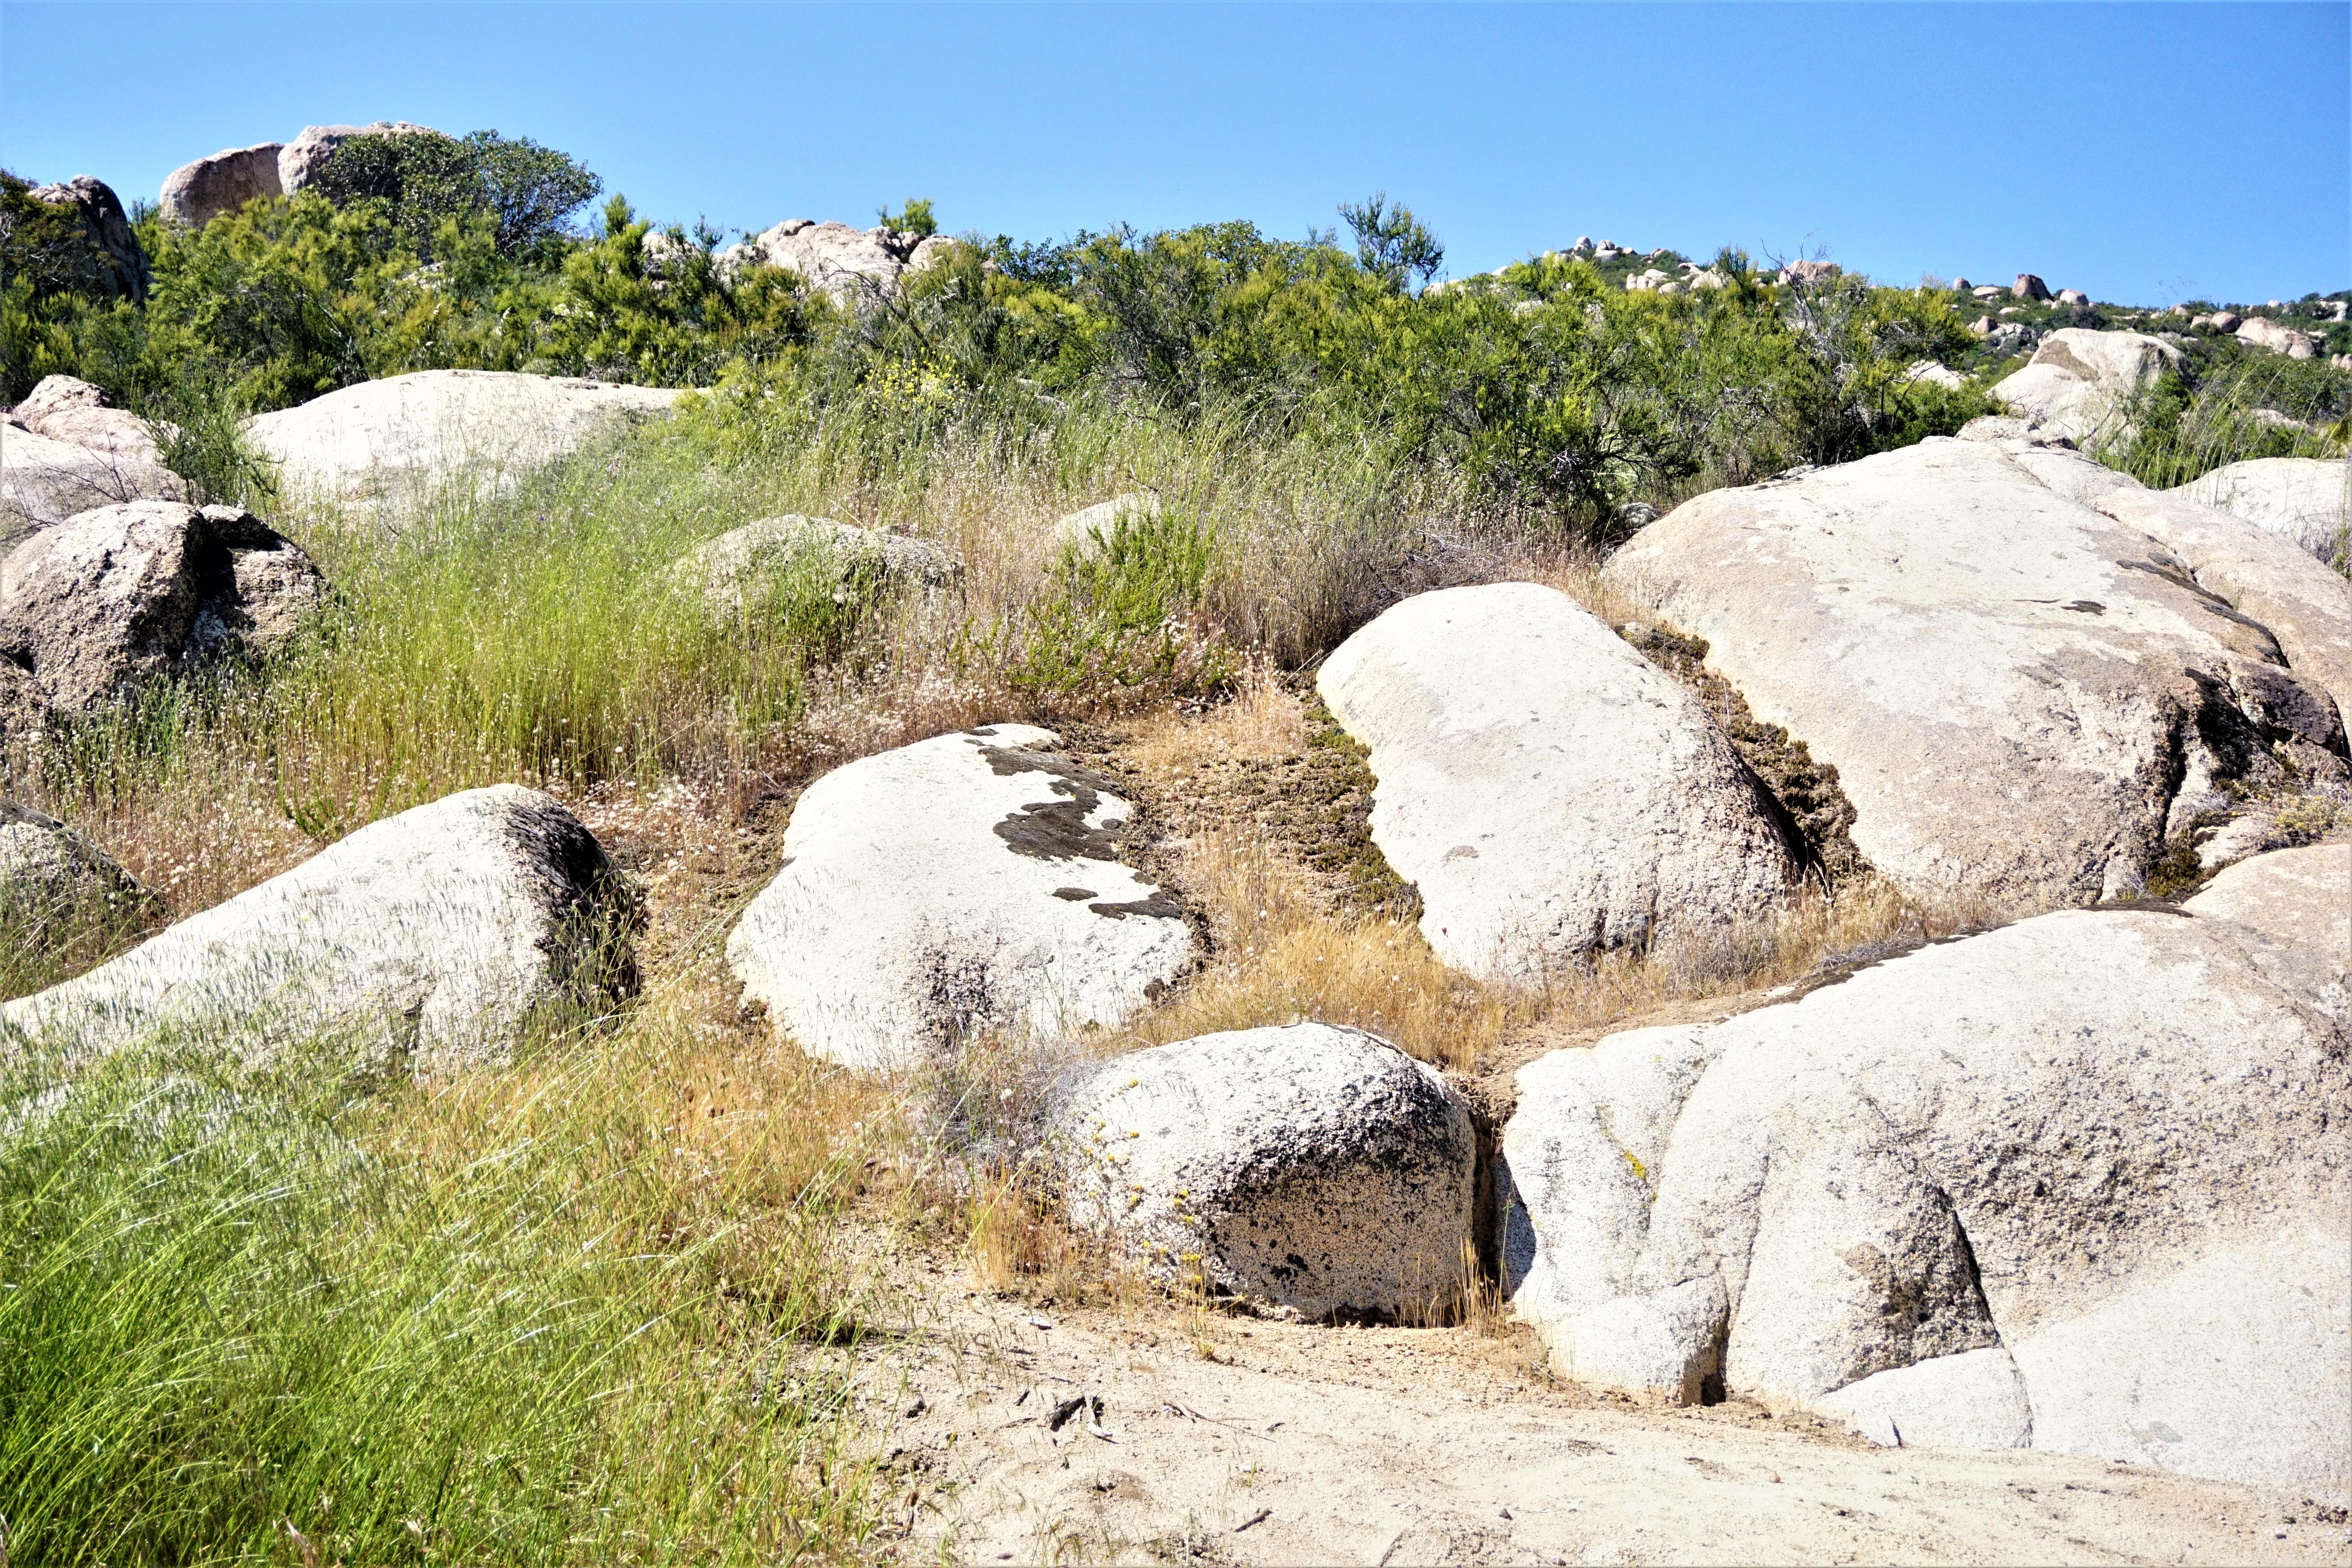
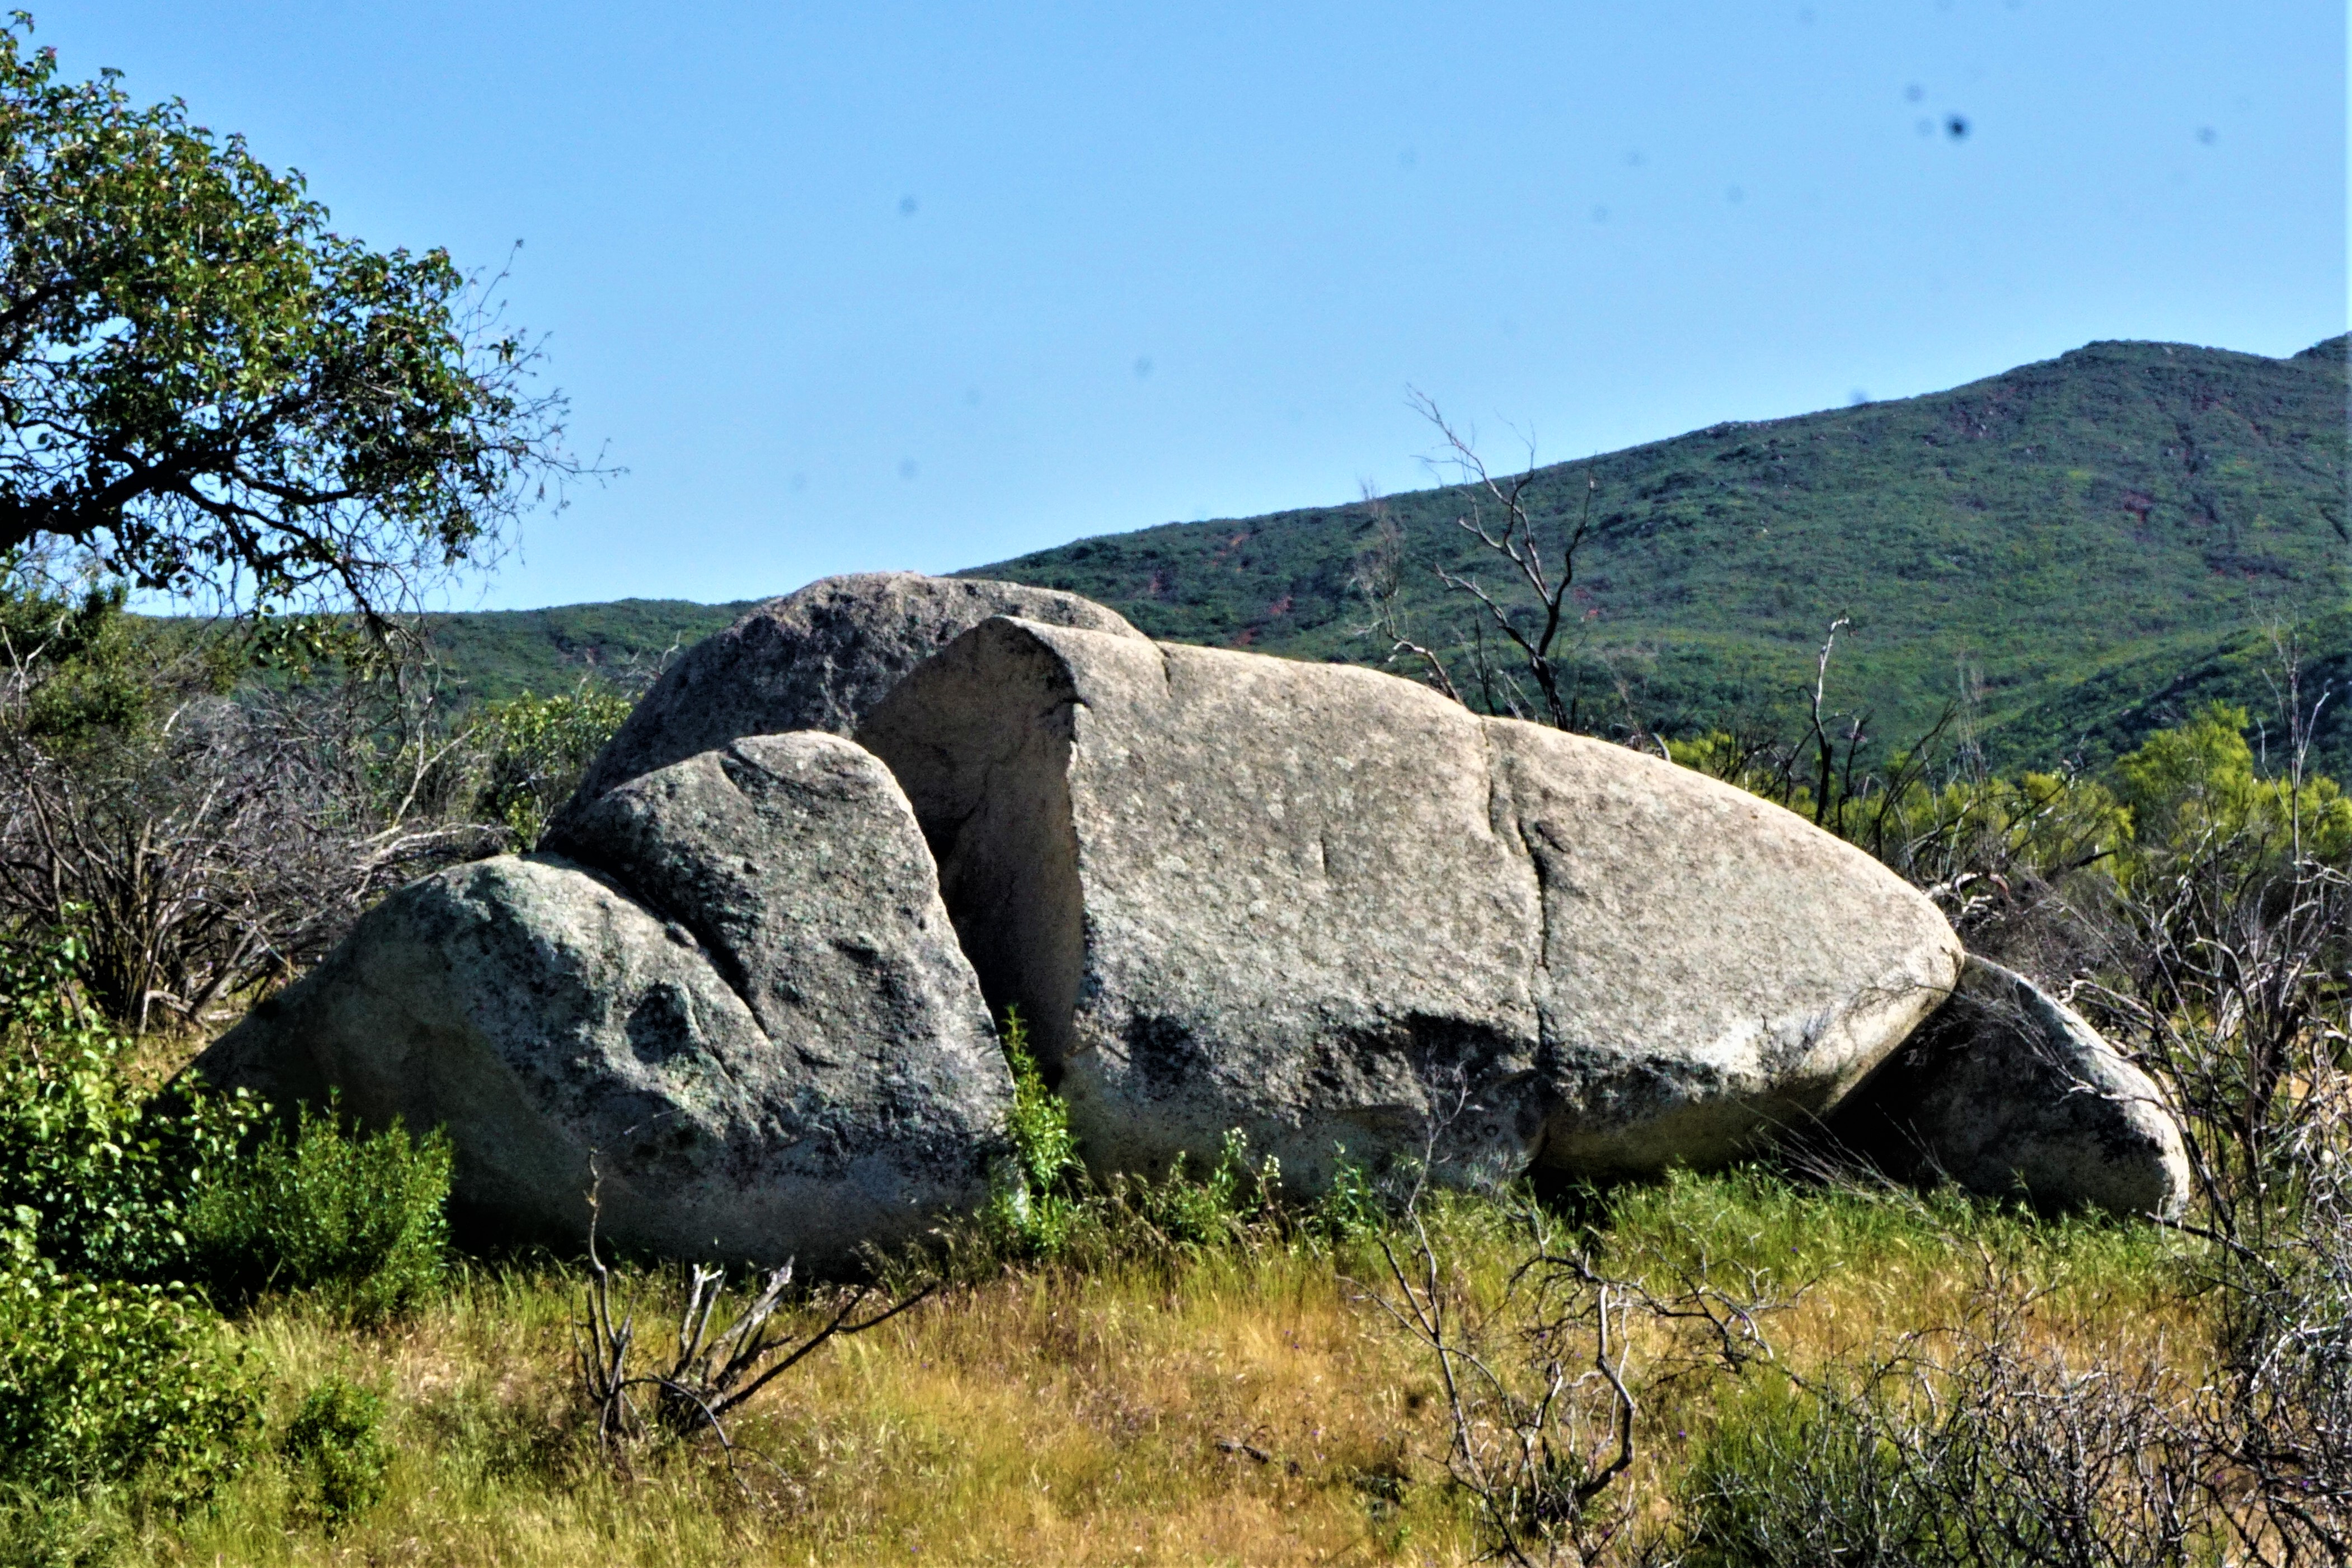
As exemplified in these photos, many boulders look like the kind of candy made with drops of molten sugar. A viscous, thick material that quickly cools to form a skin that holds its drop shape, while the inside remains hot and liquid. The shapes are like frozen beads of molten glass.
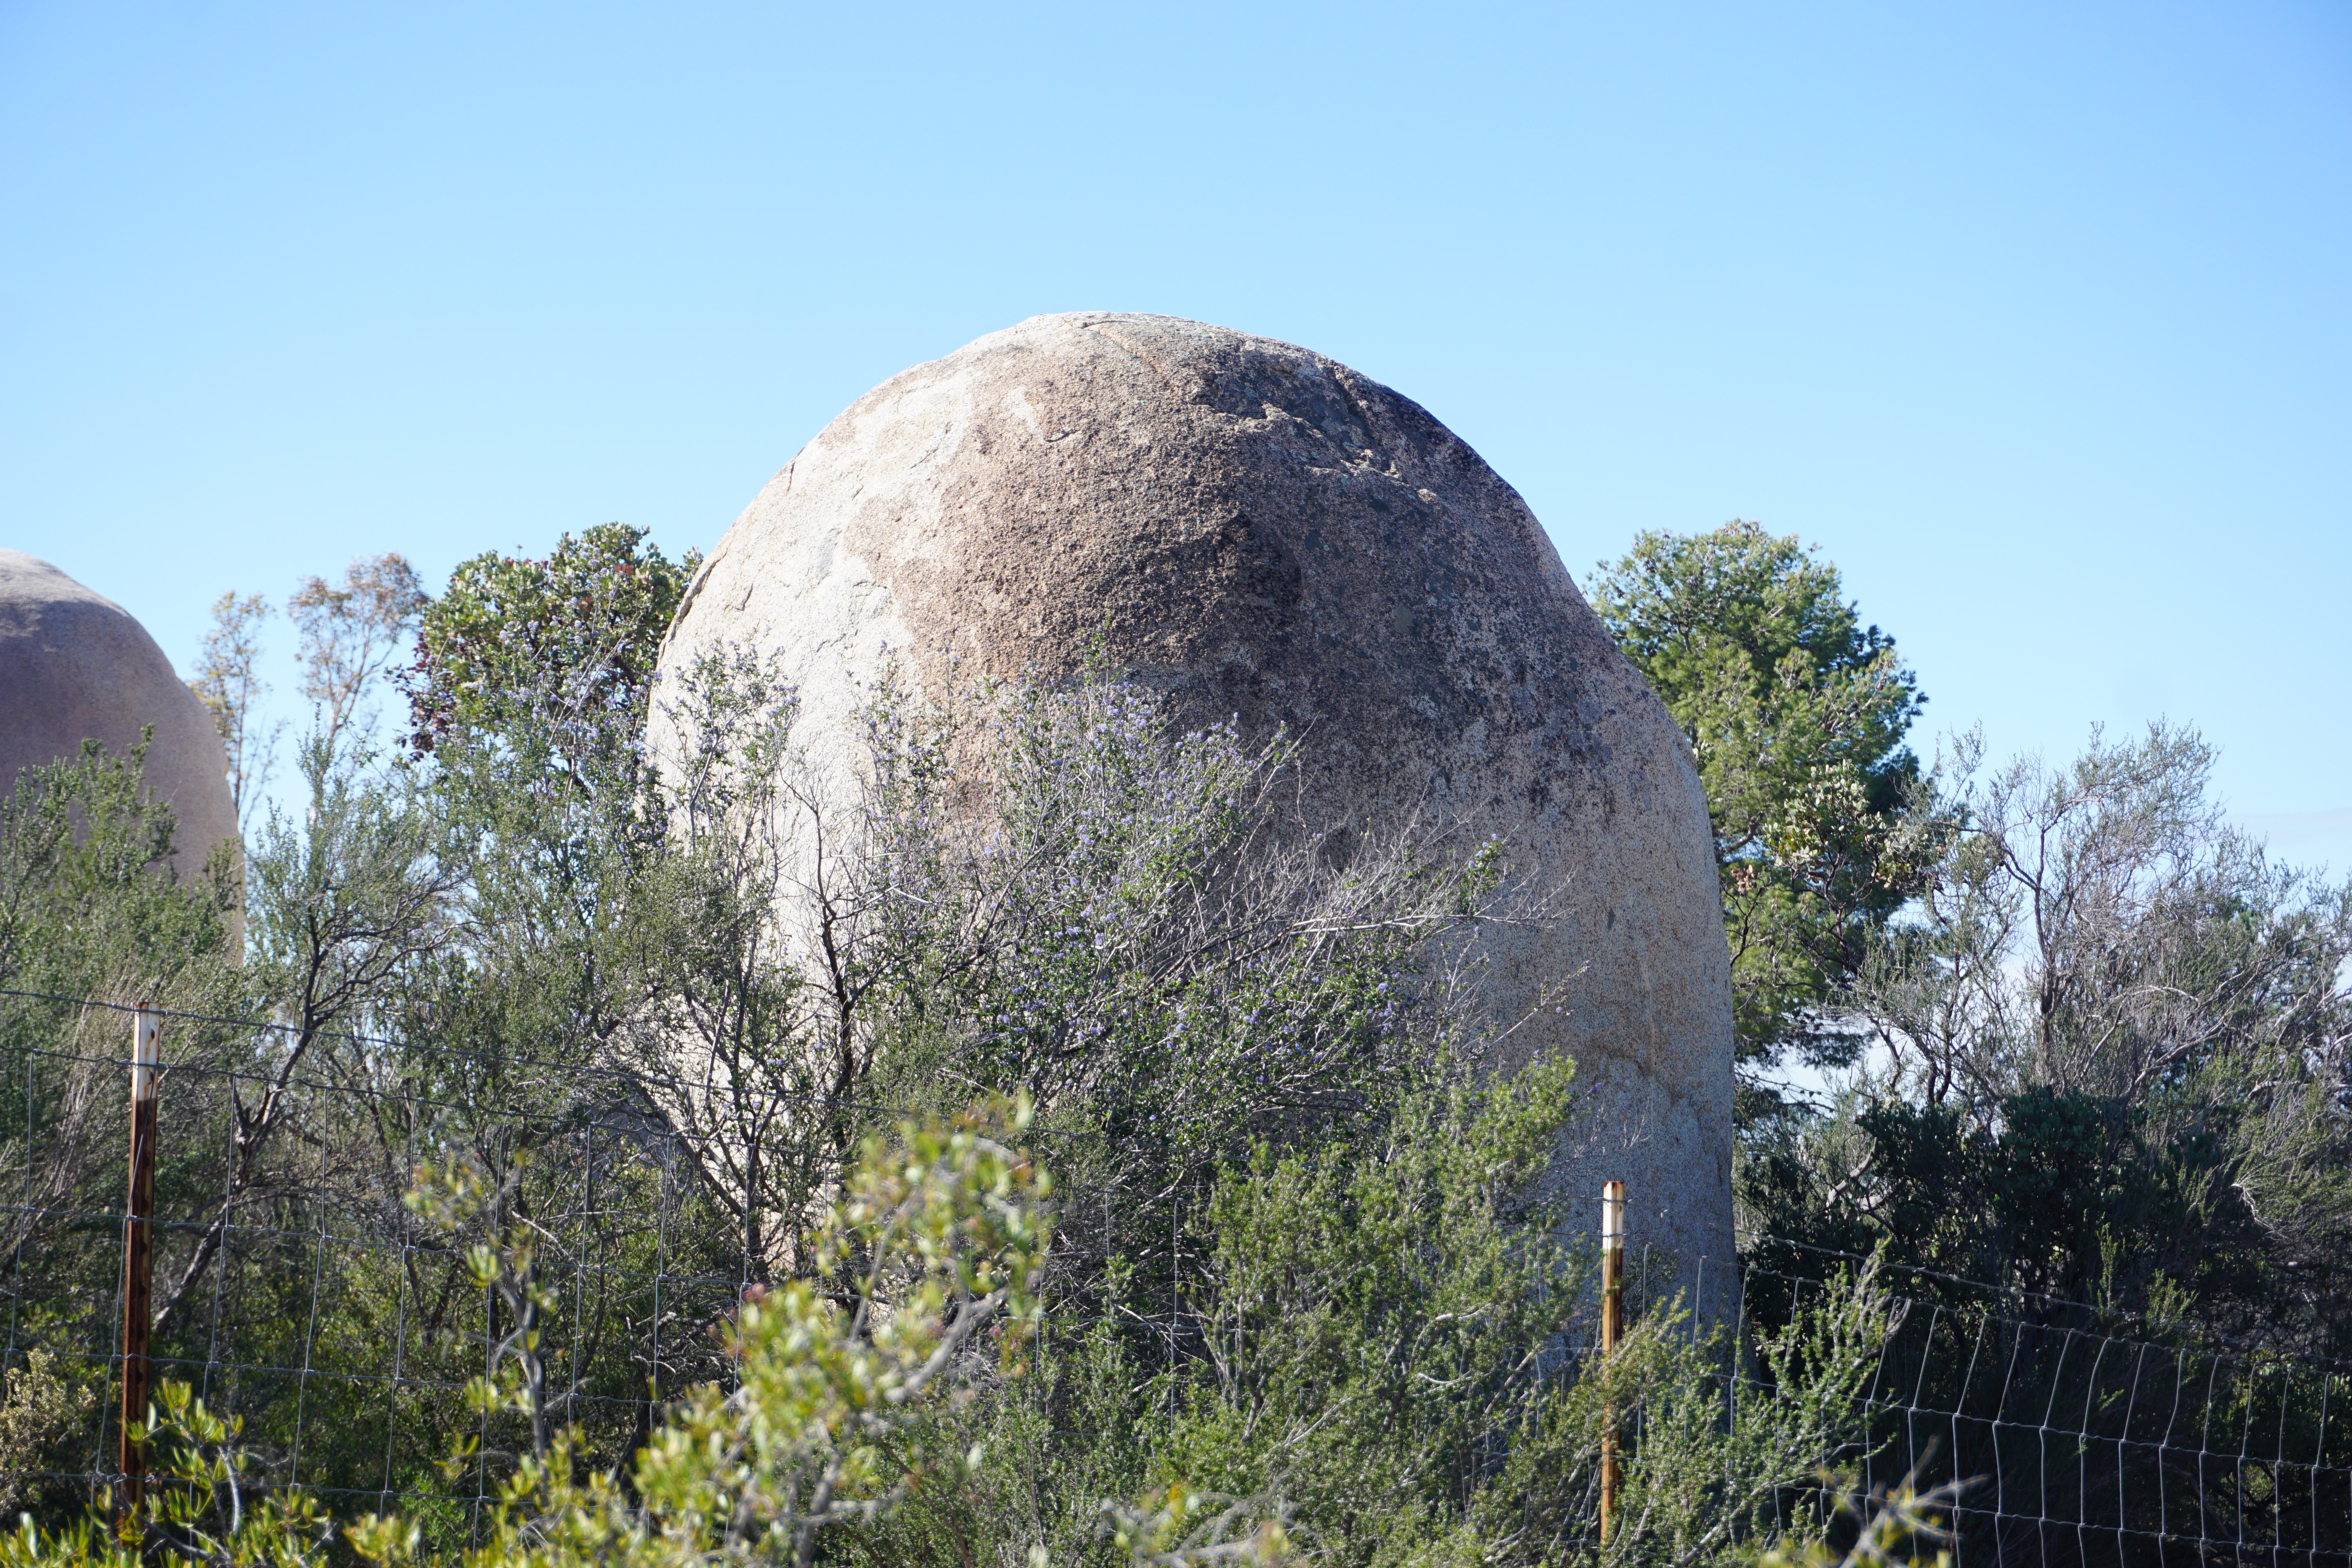


Bubbles and drops take a cellular form due to surface tension that forms a skin around the fluid, and a pressure/density differential across this membrane. The bulging, rounded shapes suggest these formed in atmospheric pressure, rather than deep underground, as consensus science tells us. There had to be a lower pressure and density surrounding these drops as they formed to allow the free-form shapes, bound only by surface tension in the skin.
We will observe multiple other points of evidence that these boulders are electrolyzed boils, including evidence of how the mountains were formed and how they became electrified to boil boulder fields. In this, Part 1 of a 2-part series, we’ll discuss the Boulders. Part 2 will discuss the Cauldron and what caused these mountains to boil.
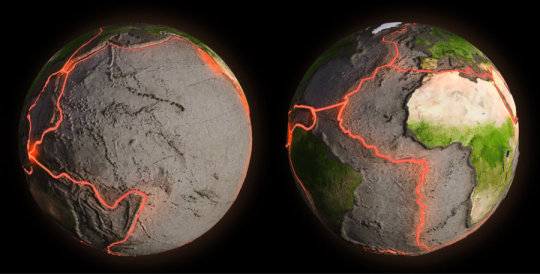
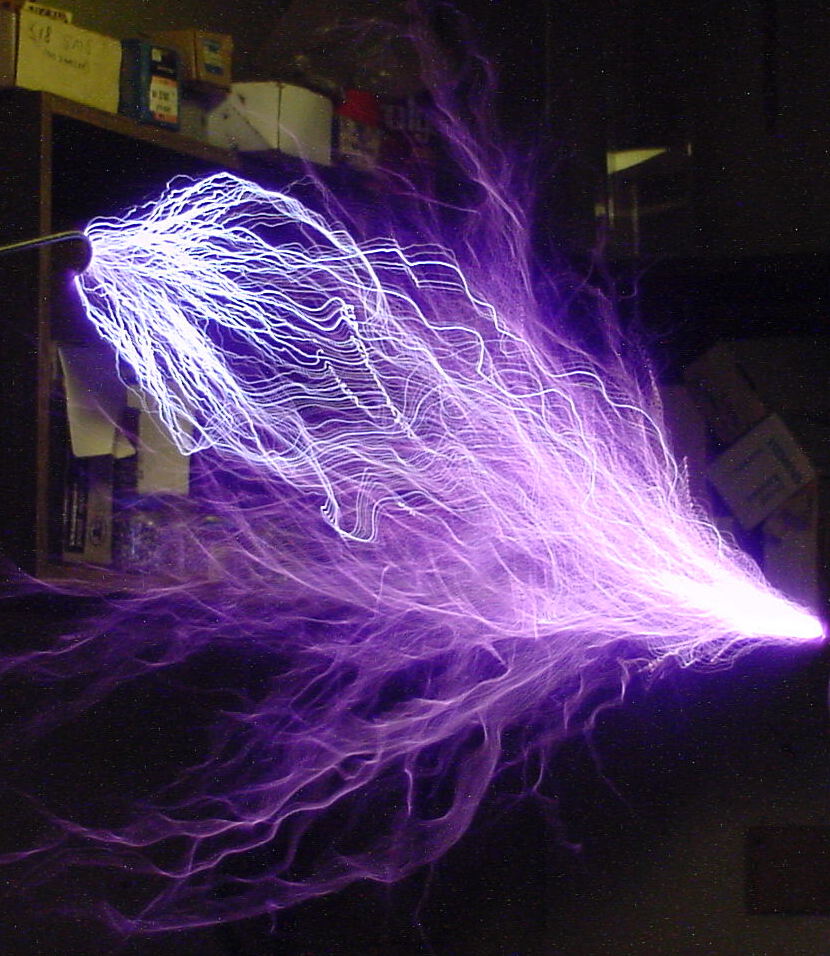
As we review the evidence and discuss the potential causes and processes, bear in mind the situational context of the Earth at the time. Earth was in upheaval due to some cosmic disturbance. The atmosphere and the ground, all through the crust, was charged. In some places, saturated zones eroded away, electronically machined by sputtering and arc discharge. Other areas had lower levels of saturation, where charge diffused through the ground and caused secondary and tertiary events at the surface that aren’t easily identified with something purely electrical. Thermodynamics, chemistry, fluid dynamics all conspire to increase the complexity of natures product. The granite cauldron is a display of such complexity.
The Boulders
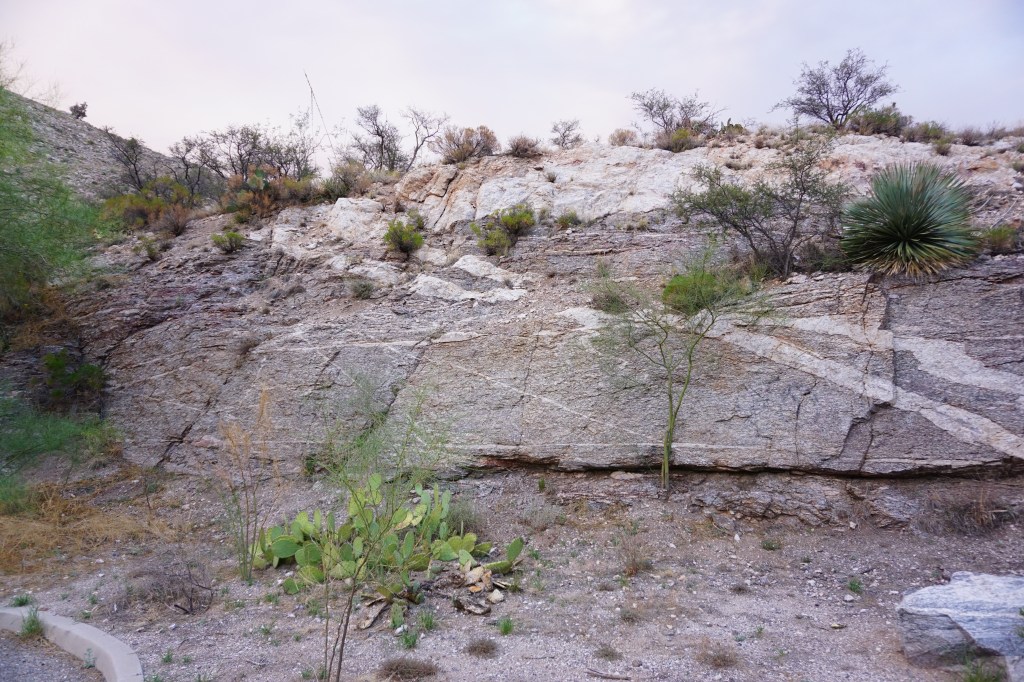
Examination of the rocks, and the region as a whole, leads me to conclude the granite was boiled as a consequence of electrolysis in an underlying aquifer, where oxygen and hydrogen became segregated and channeled through layers of sand and water. The oxygen channels reacted with elements in the layers of sand, creating blossoms of hot boiling silicon compounds that solidified in contact with the atmosphere; suddenly cooling, re-combining and re-crystallizing as granite, but still in the shape of fluid drops.
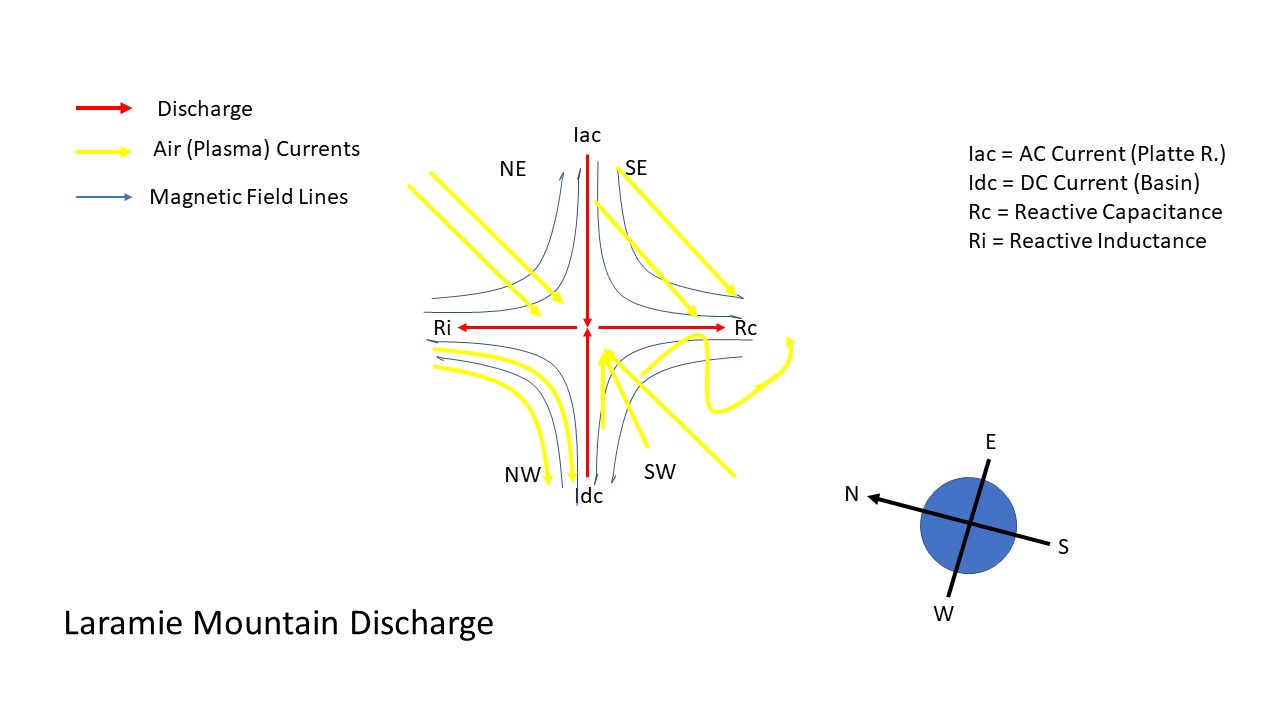
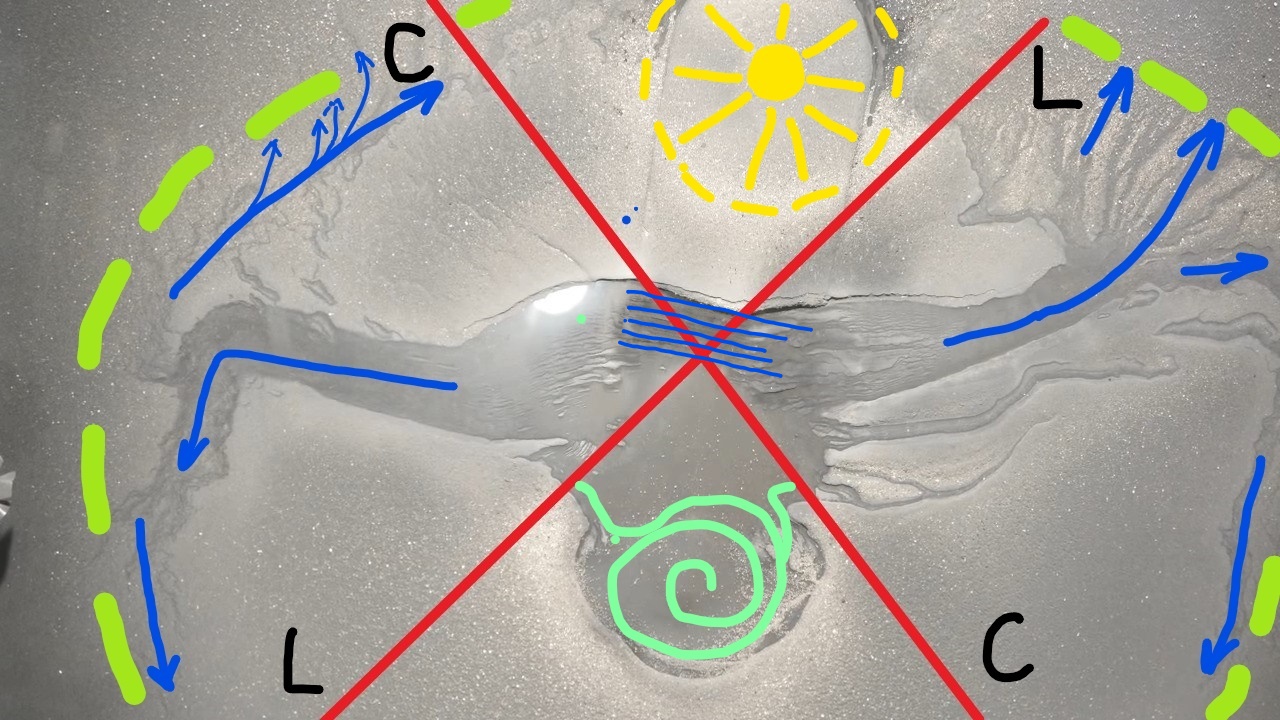
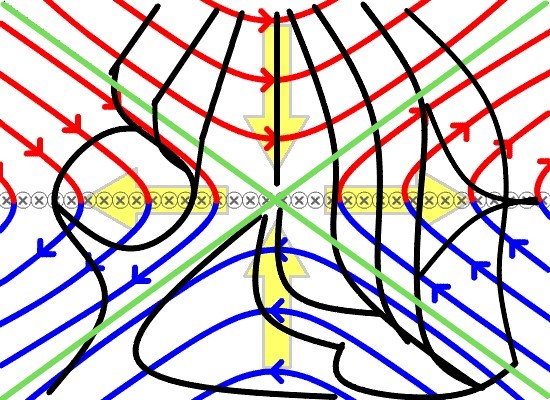
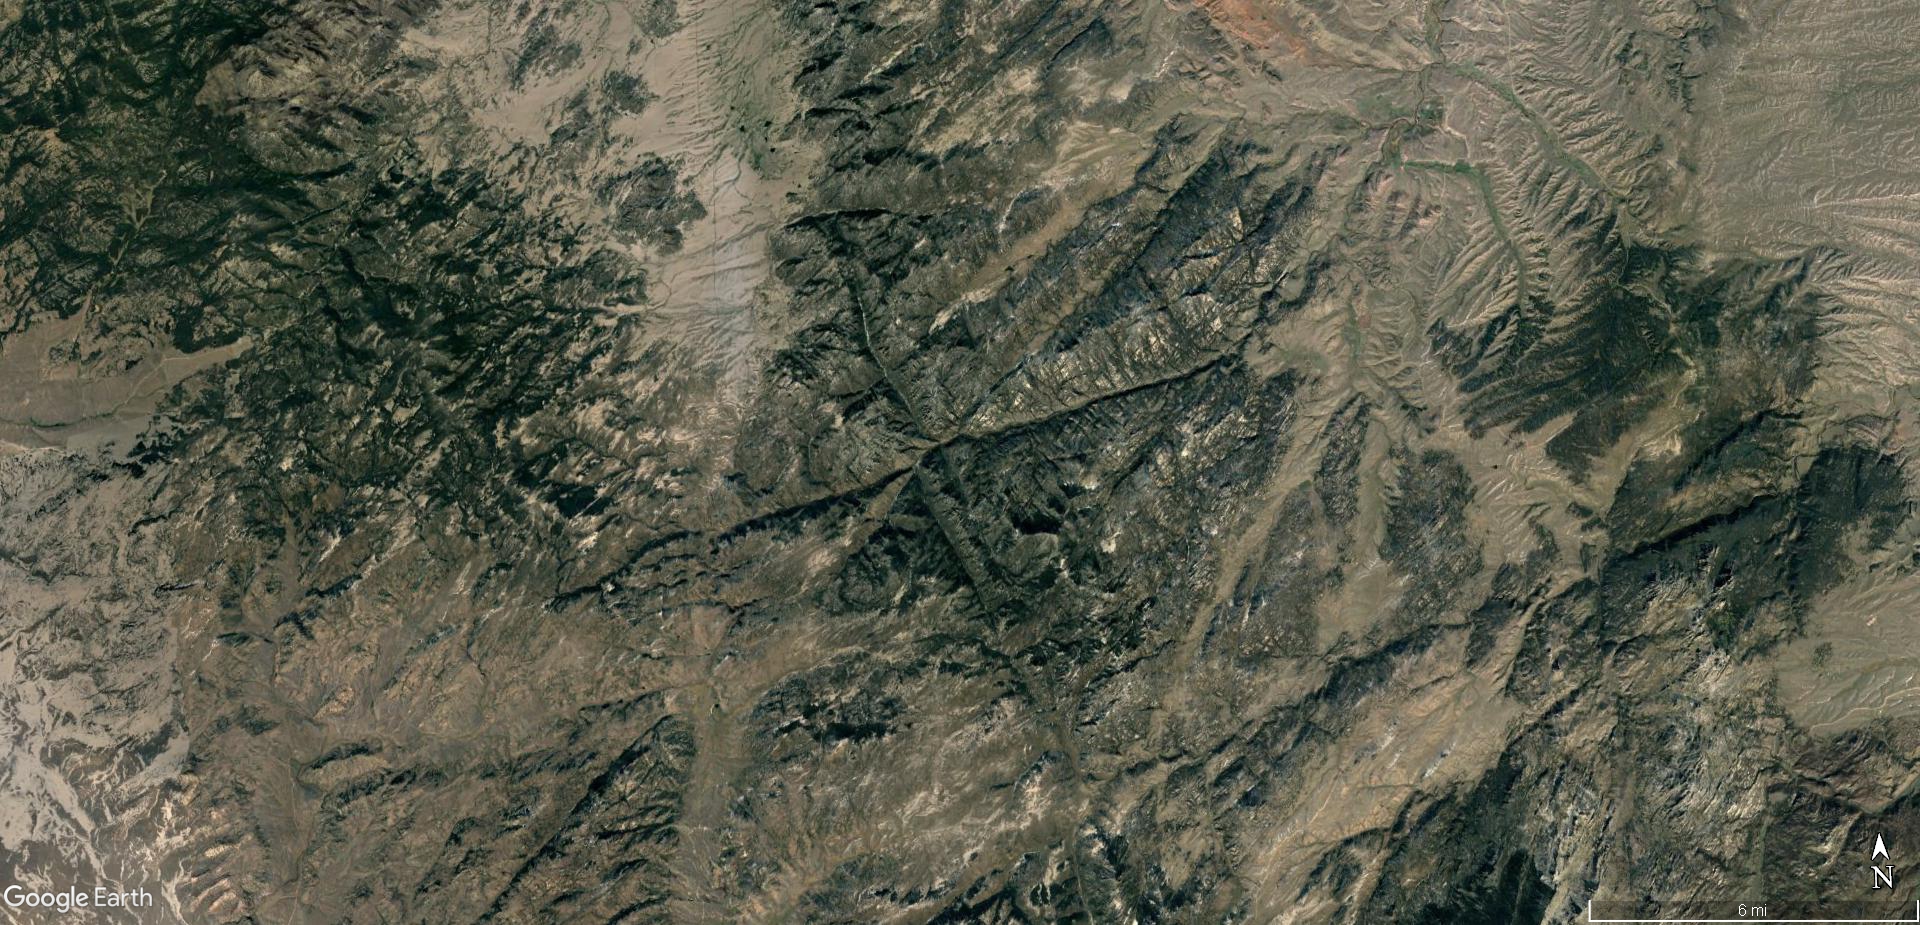
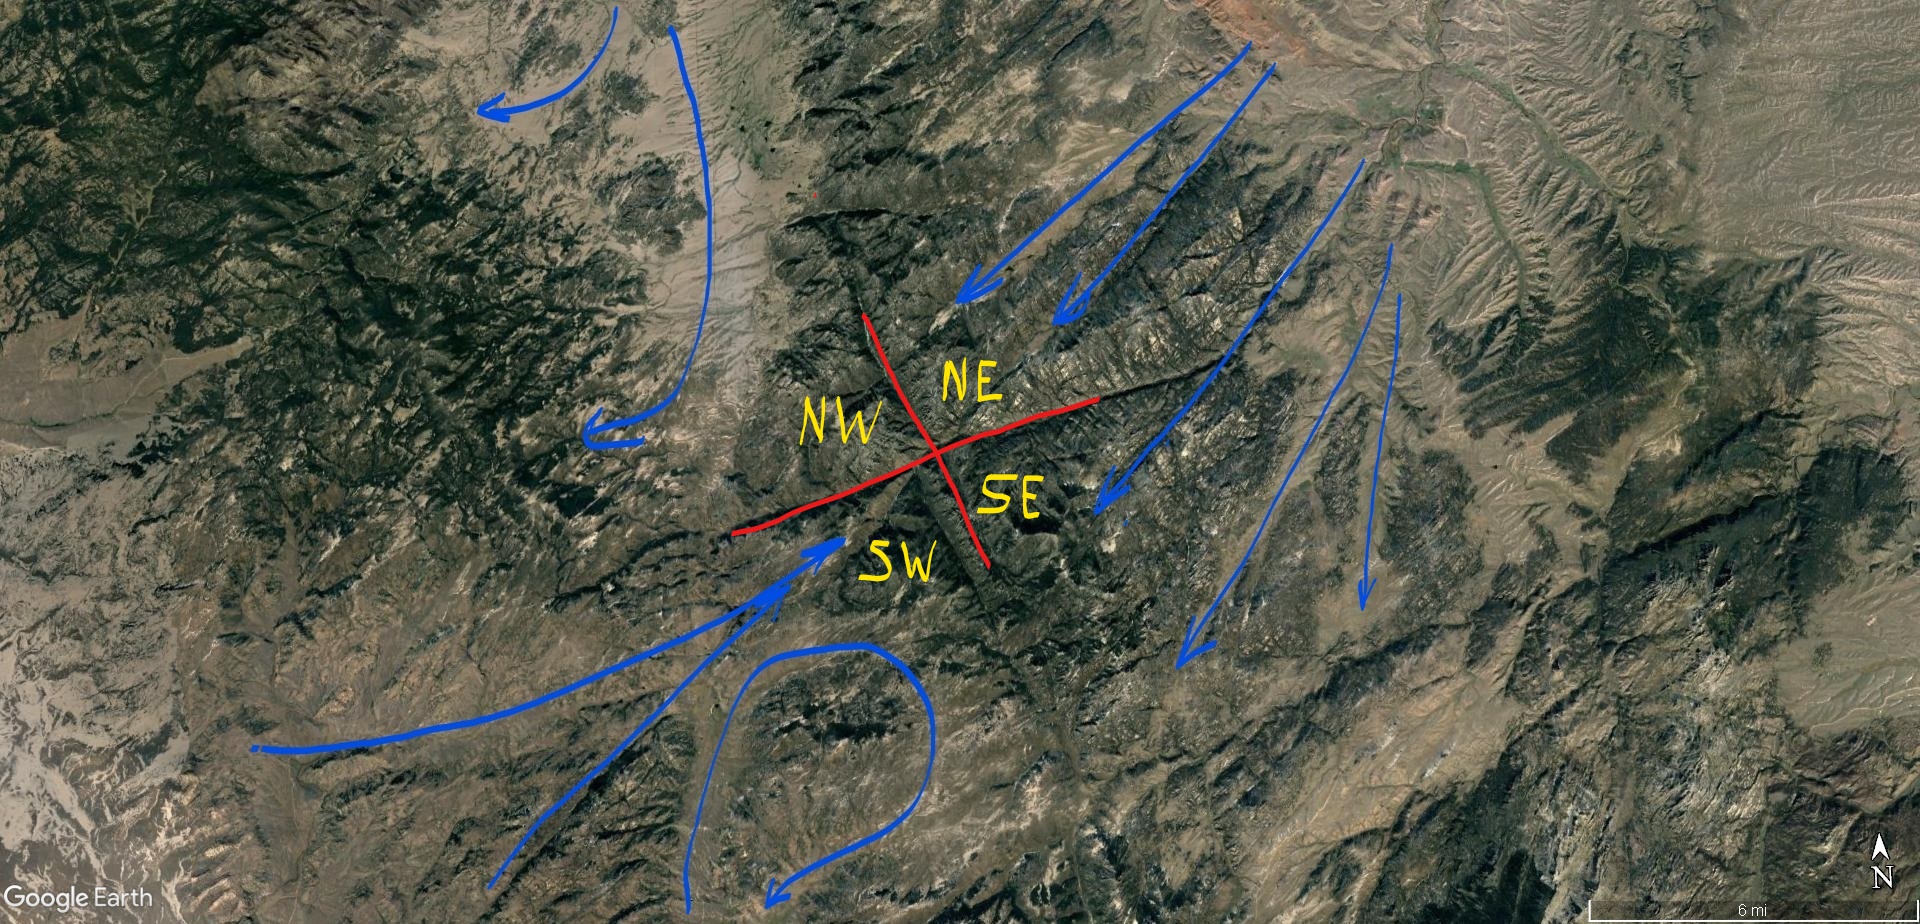
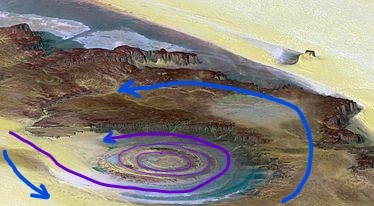
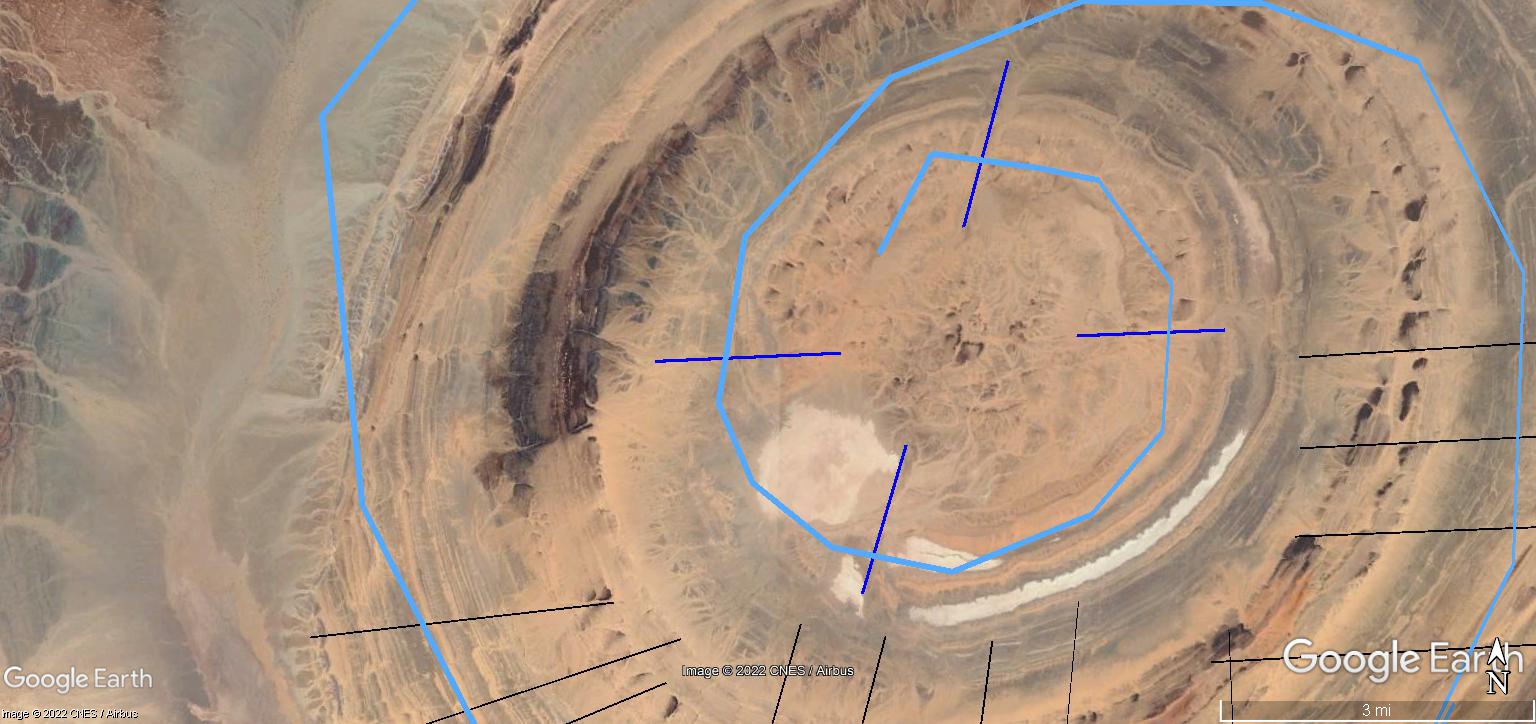
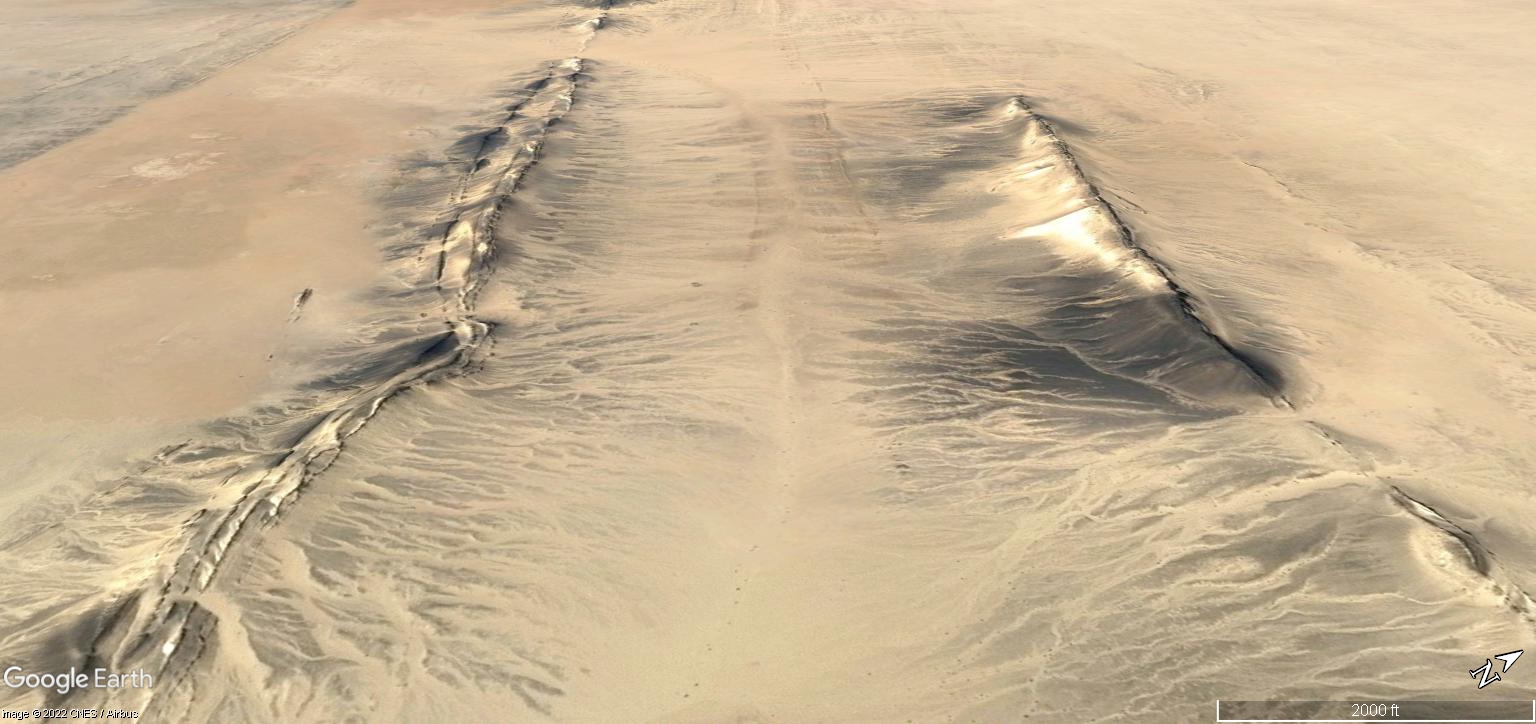
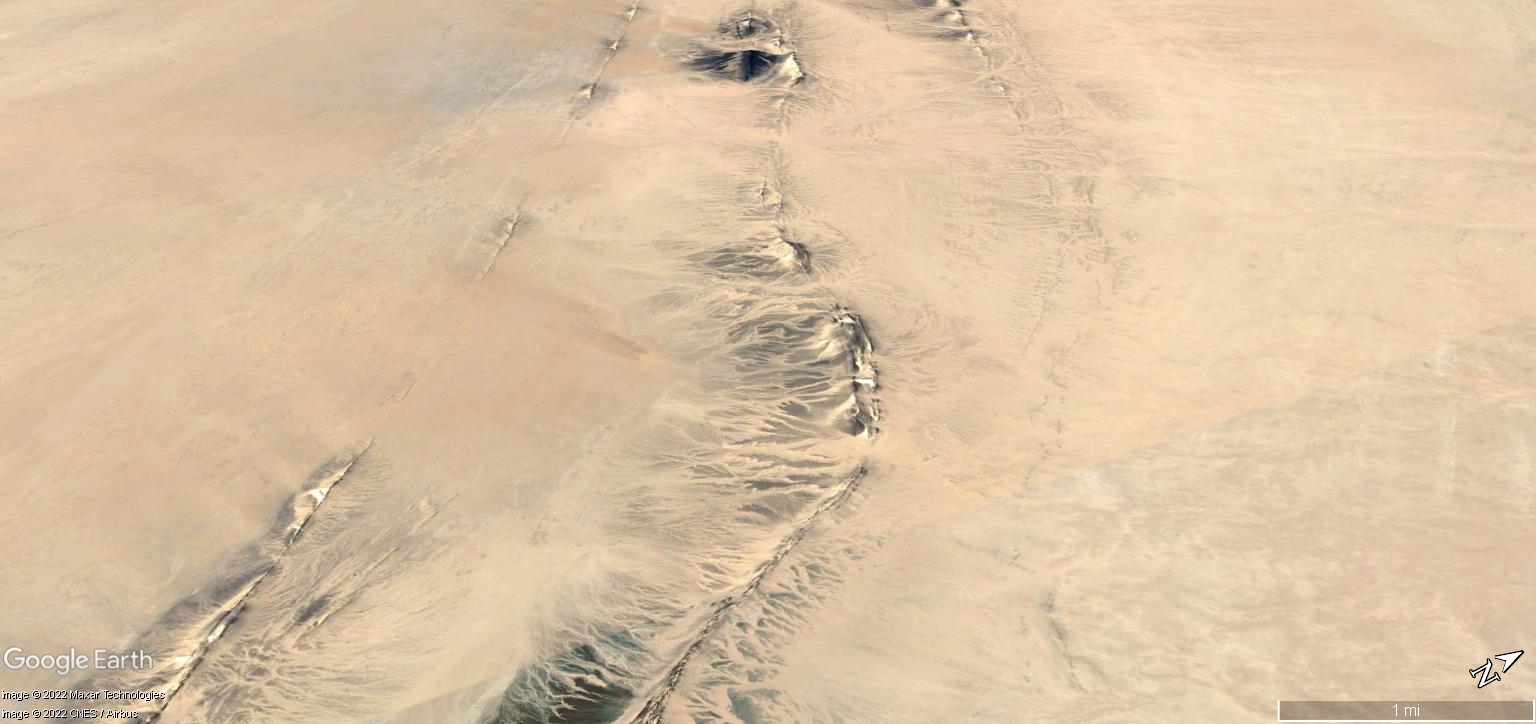
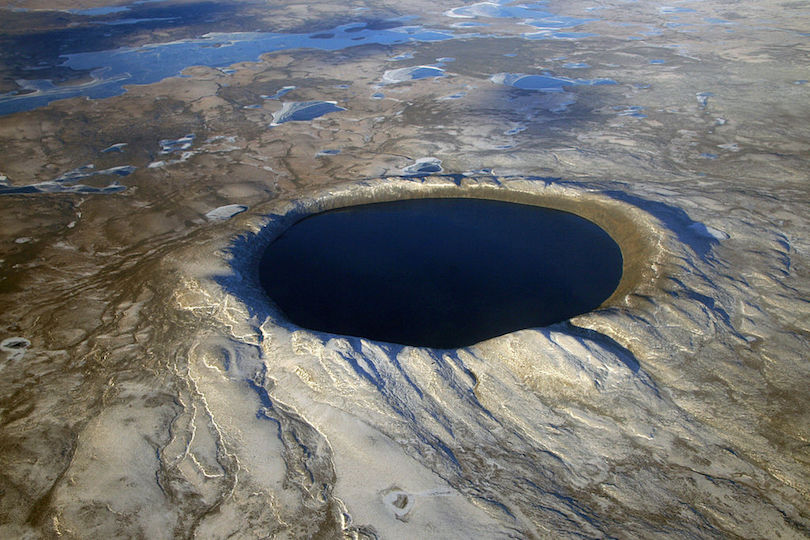
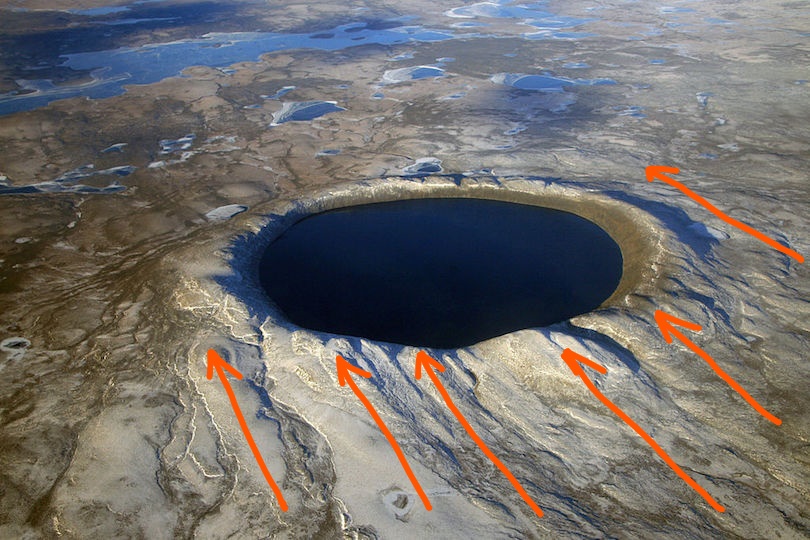
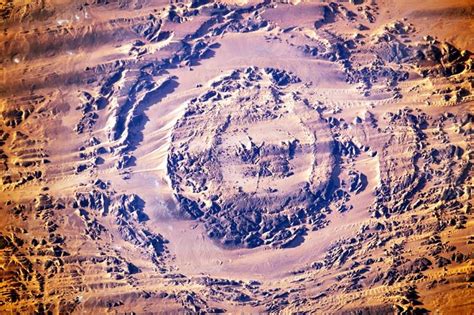
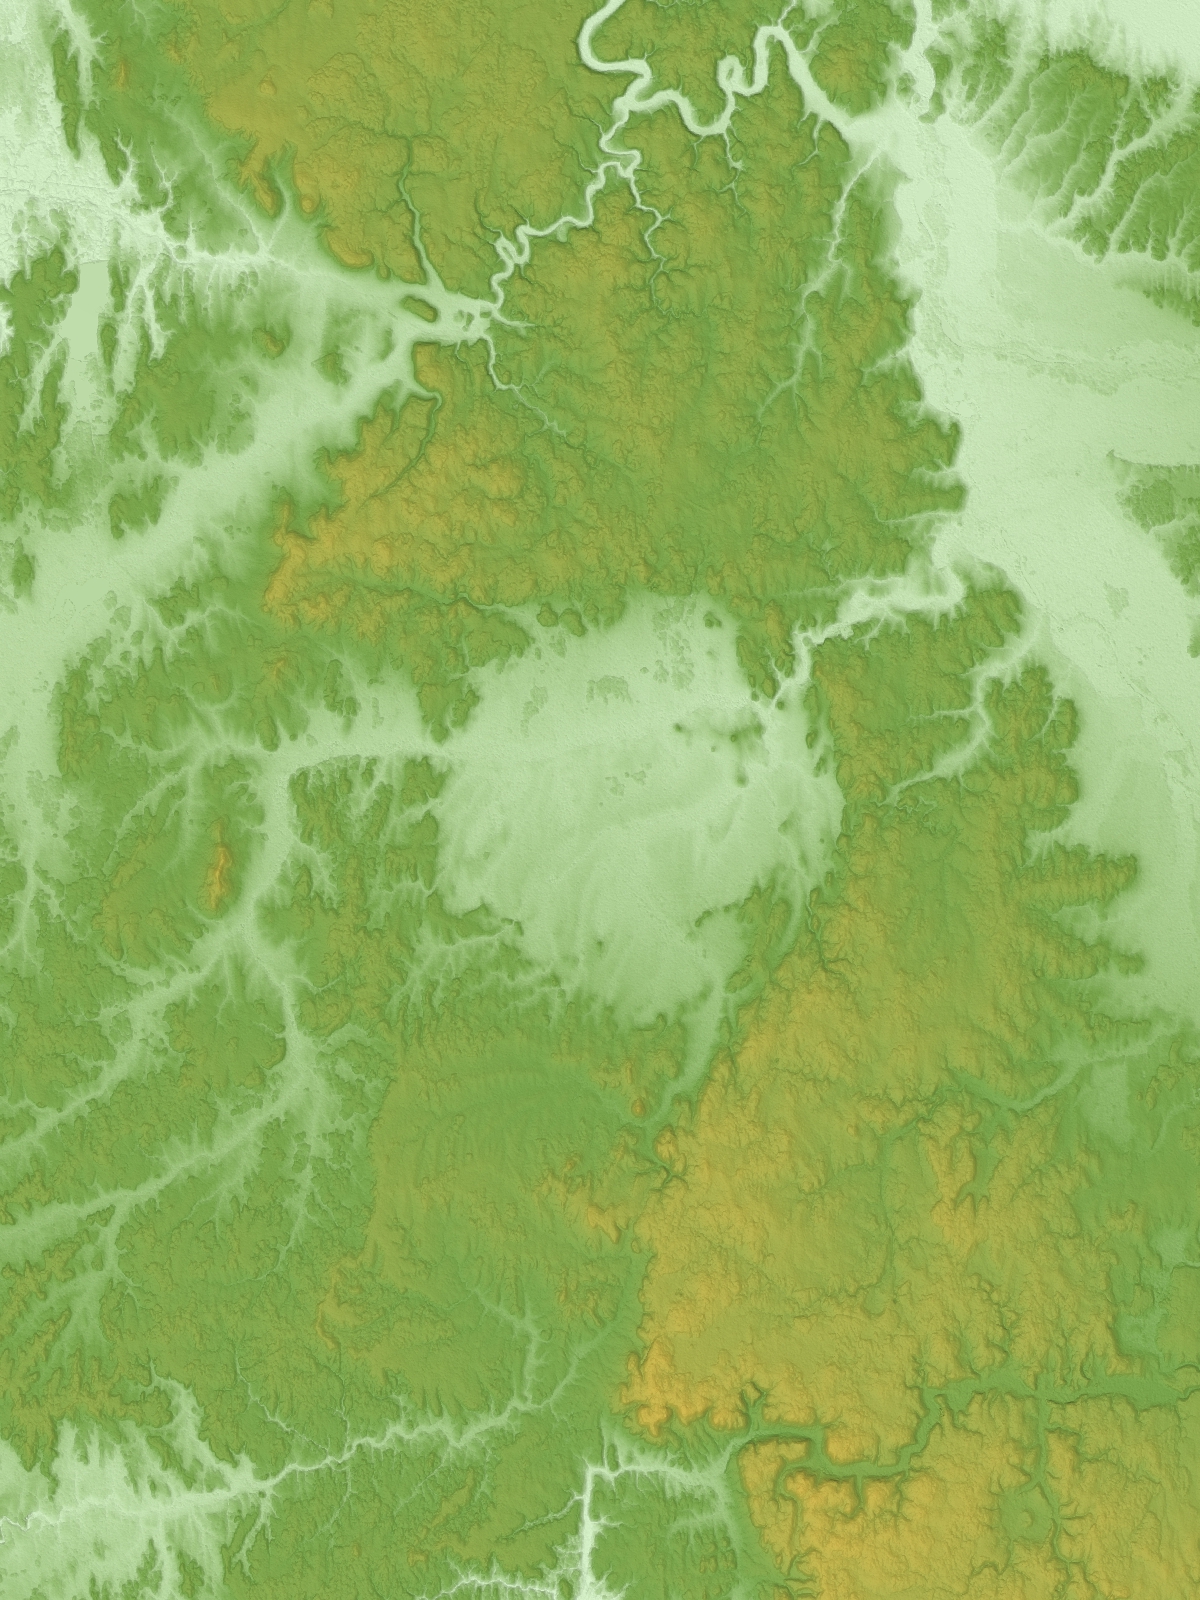
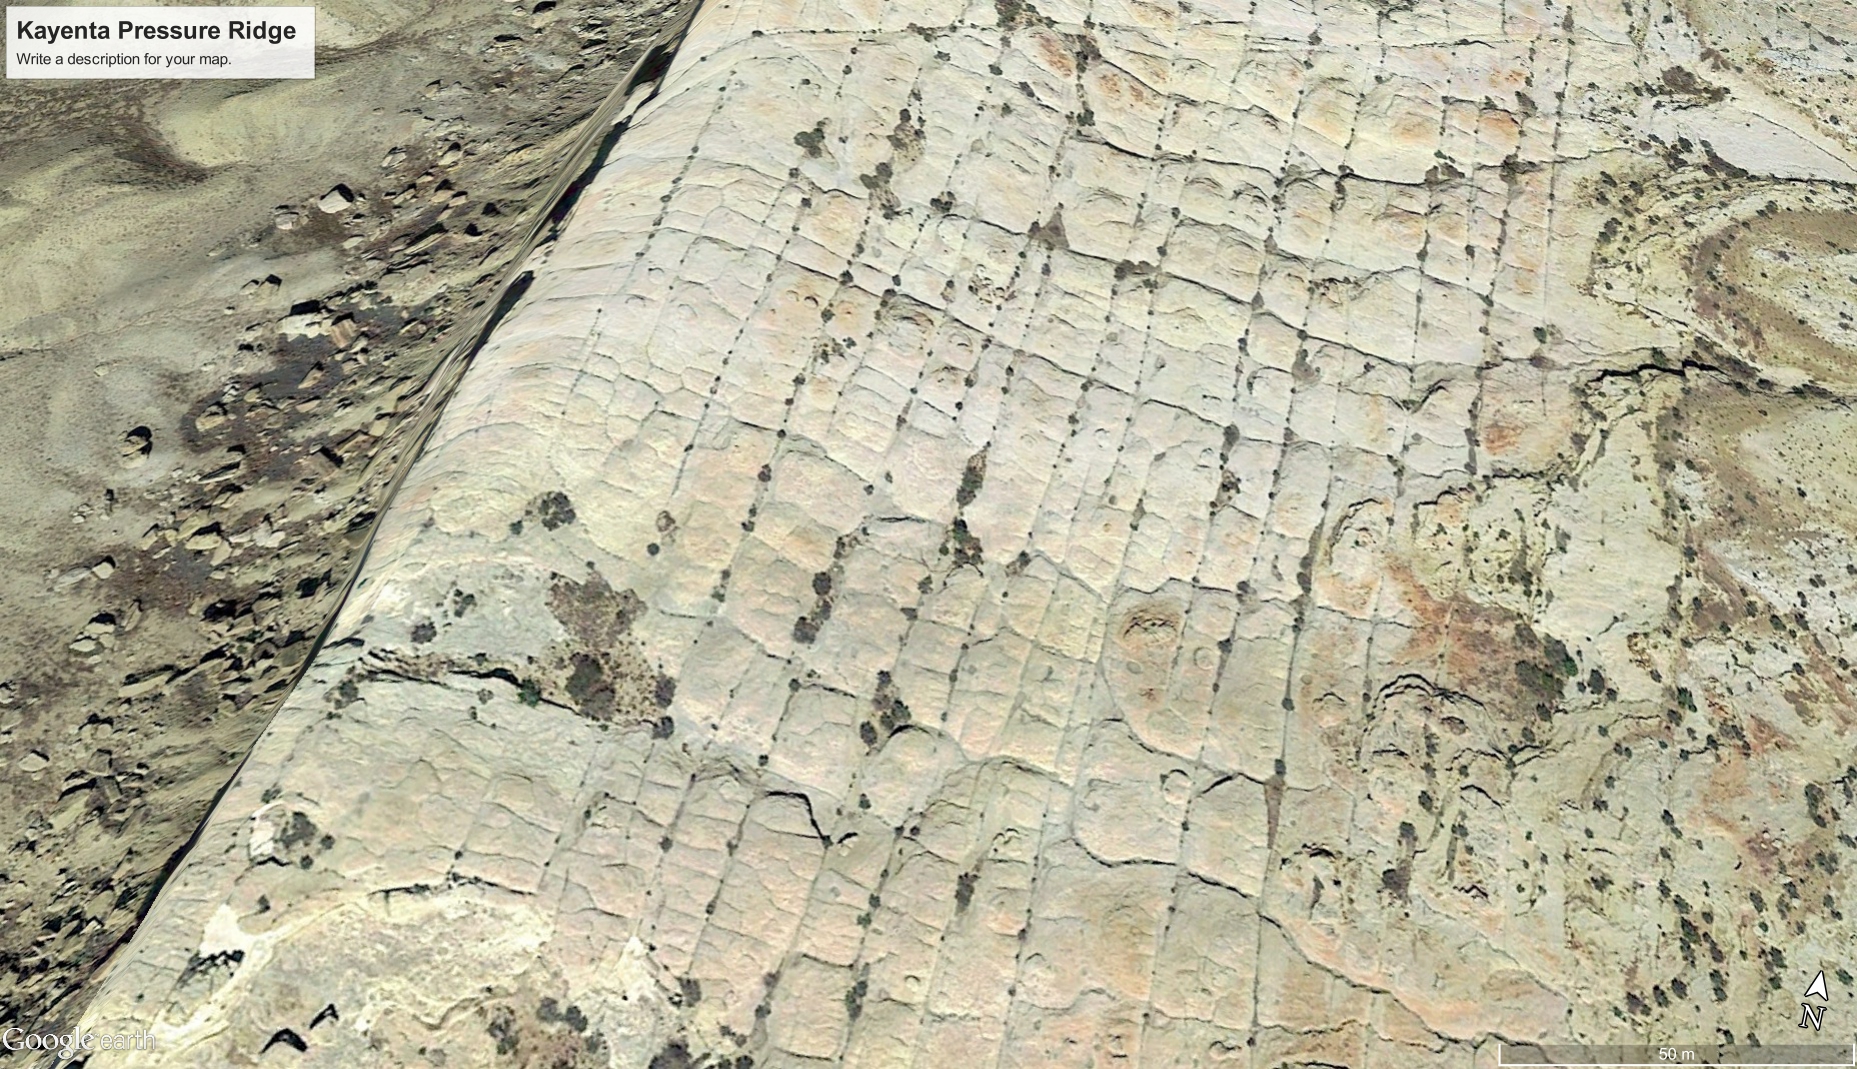
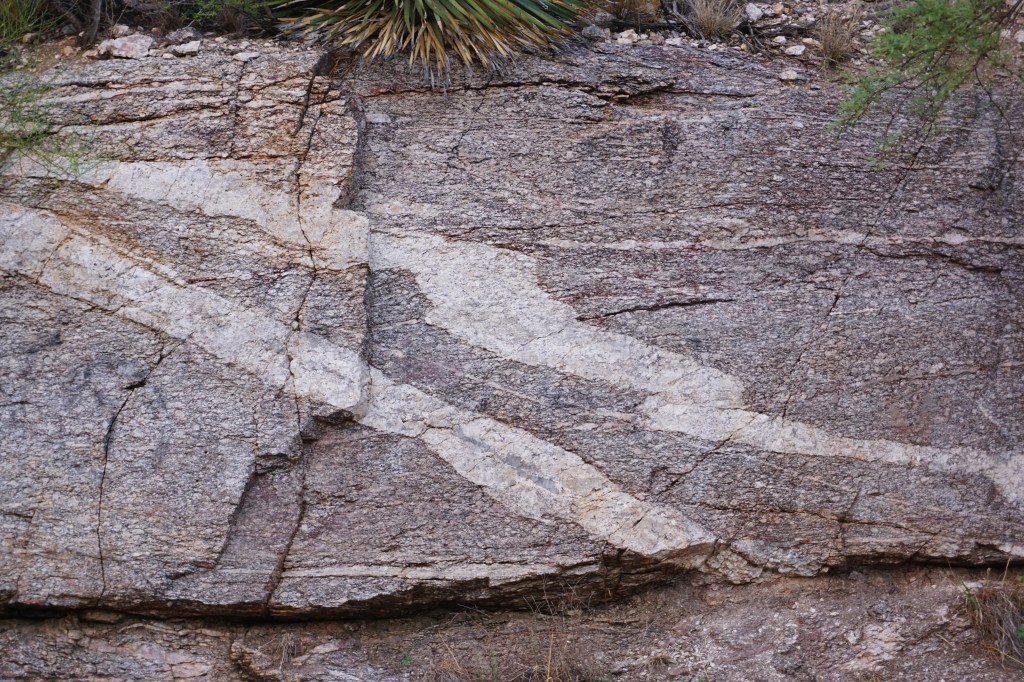
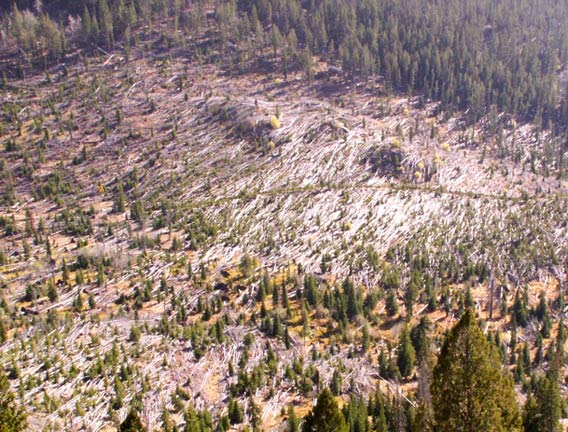
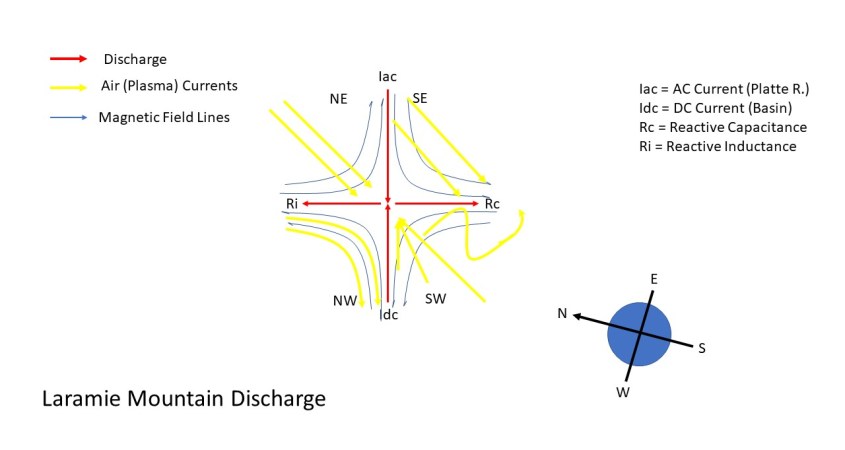
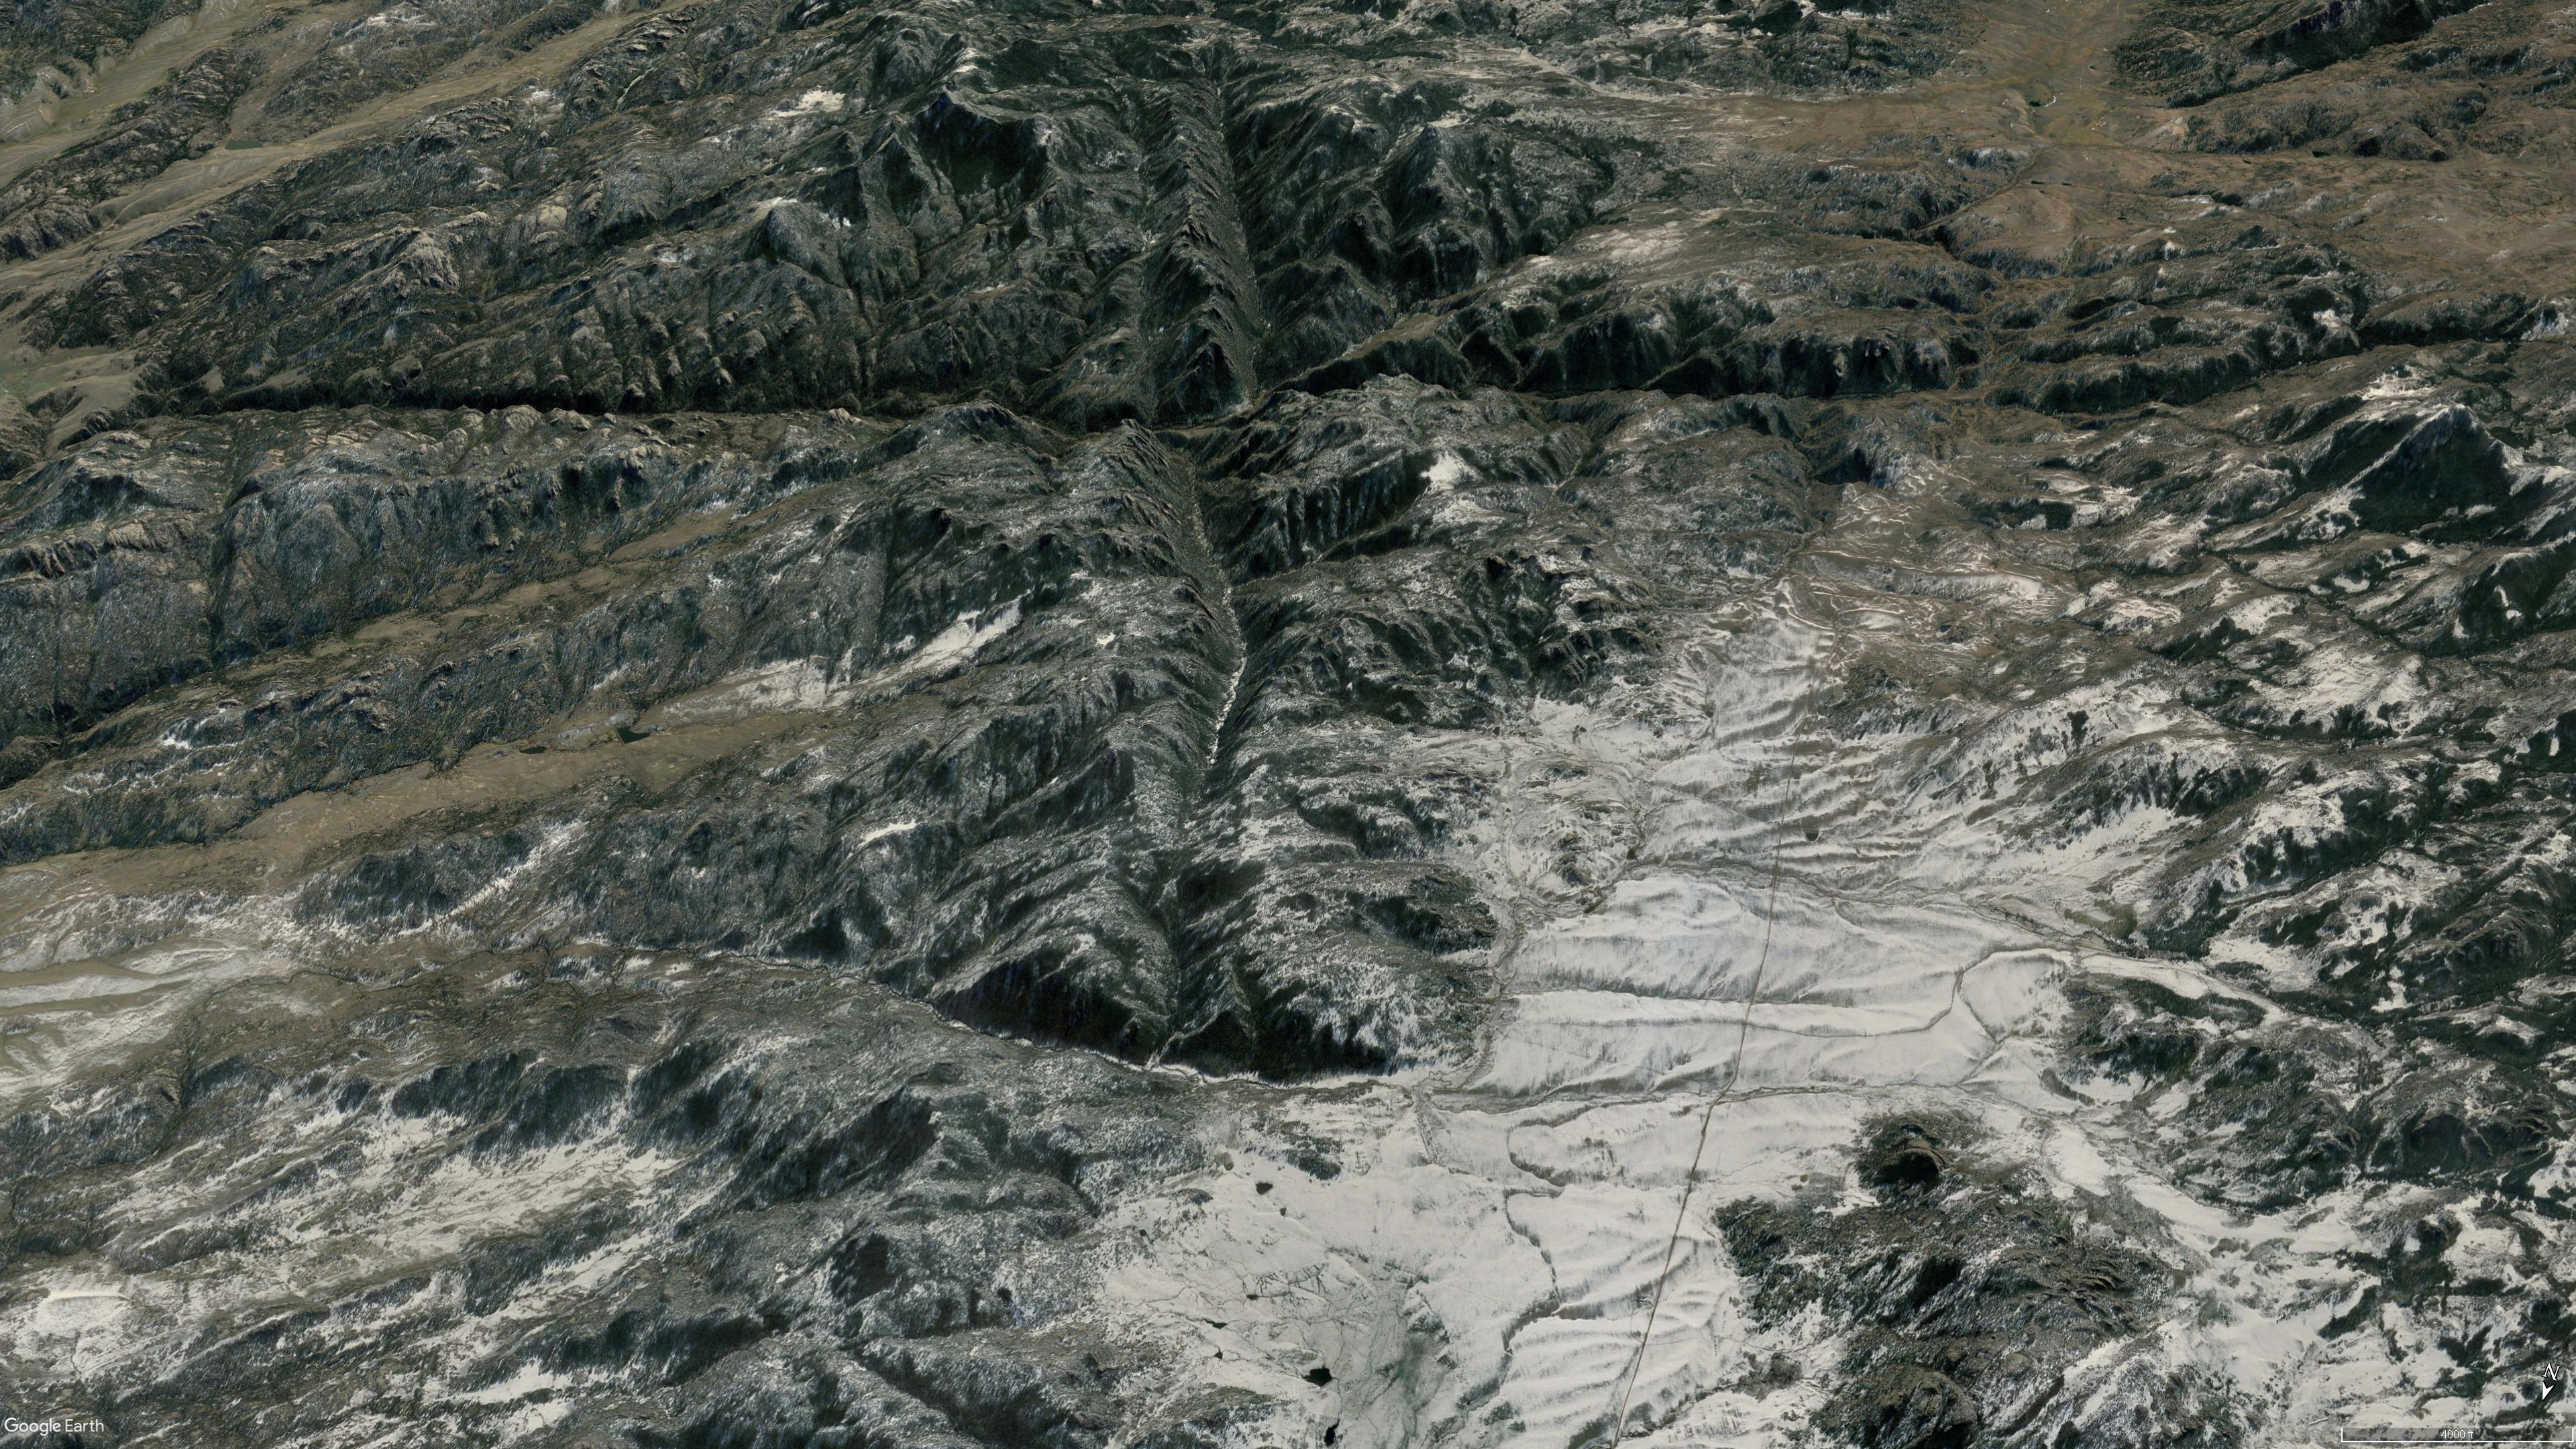
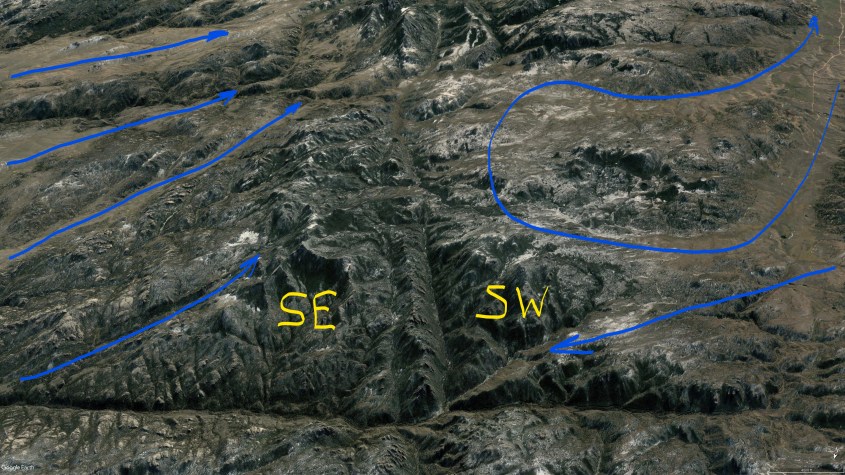
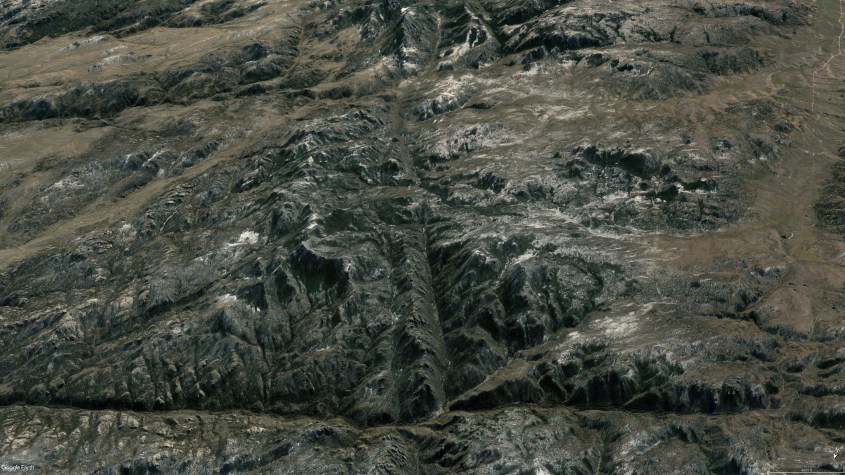
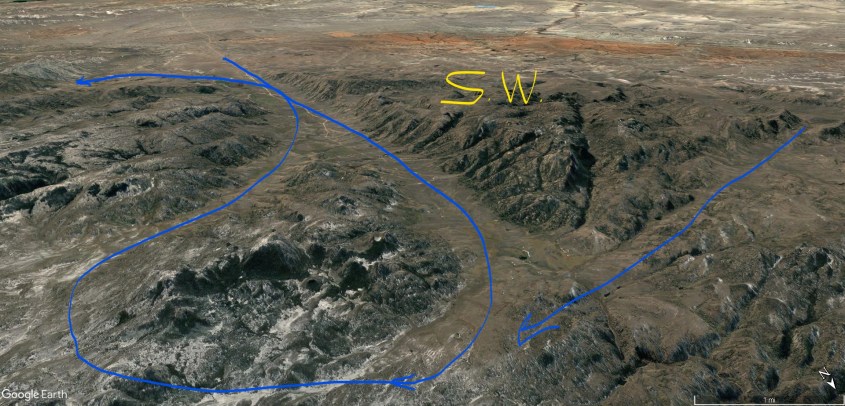
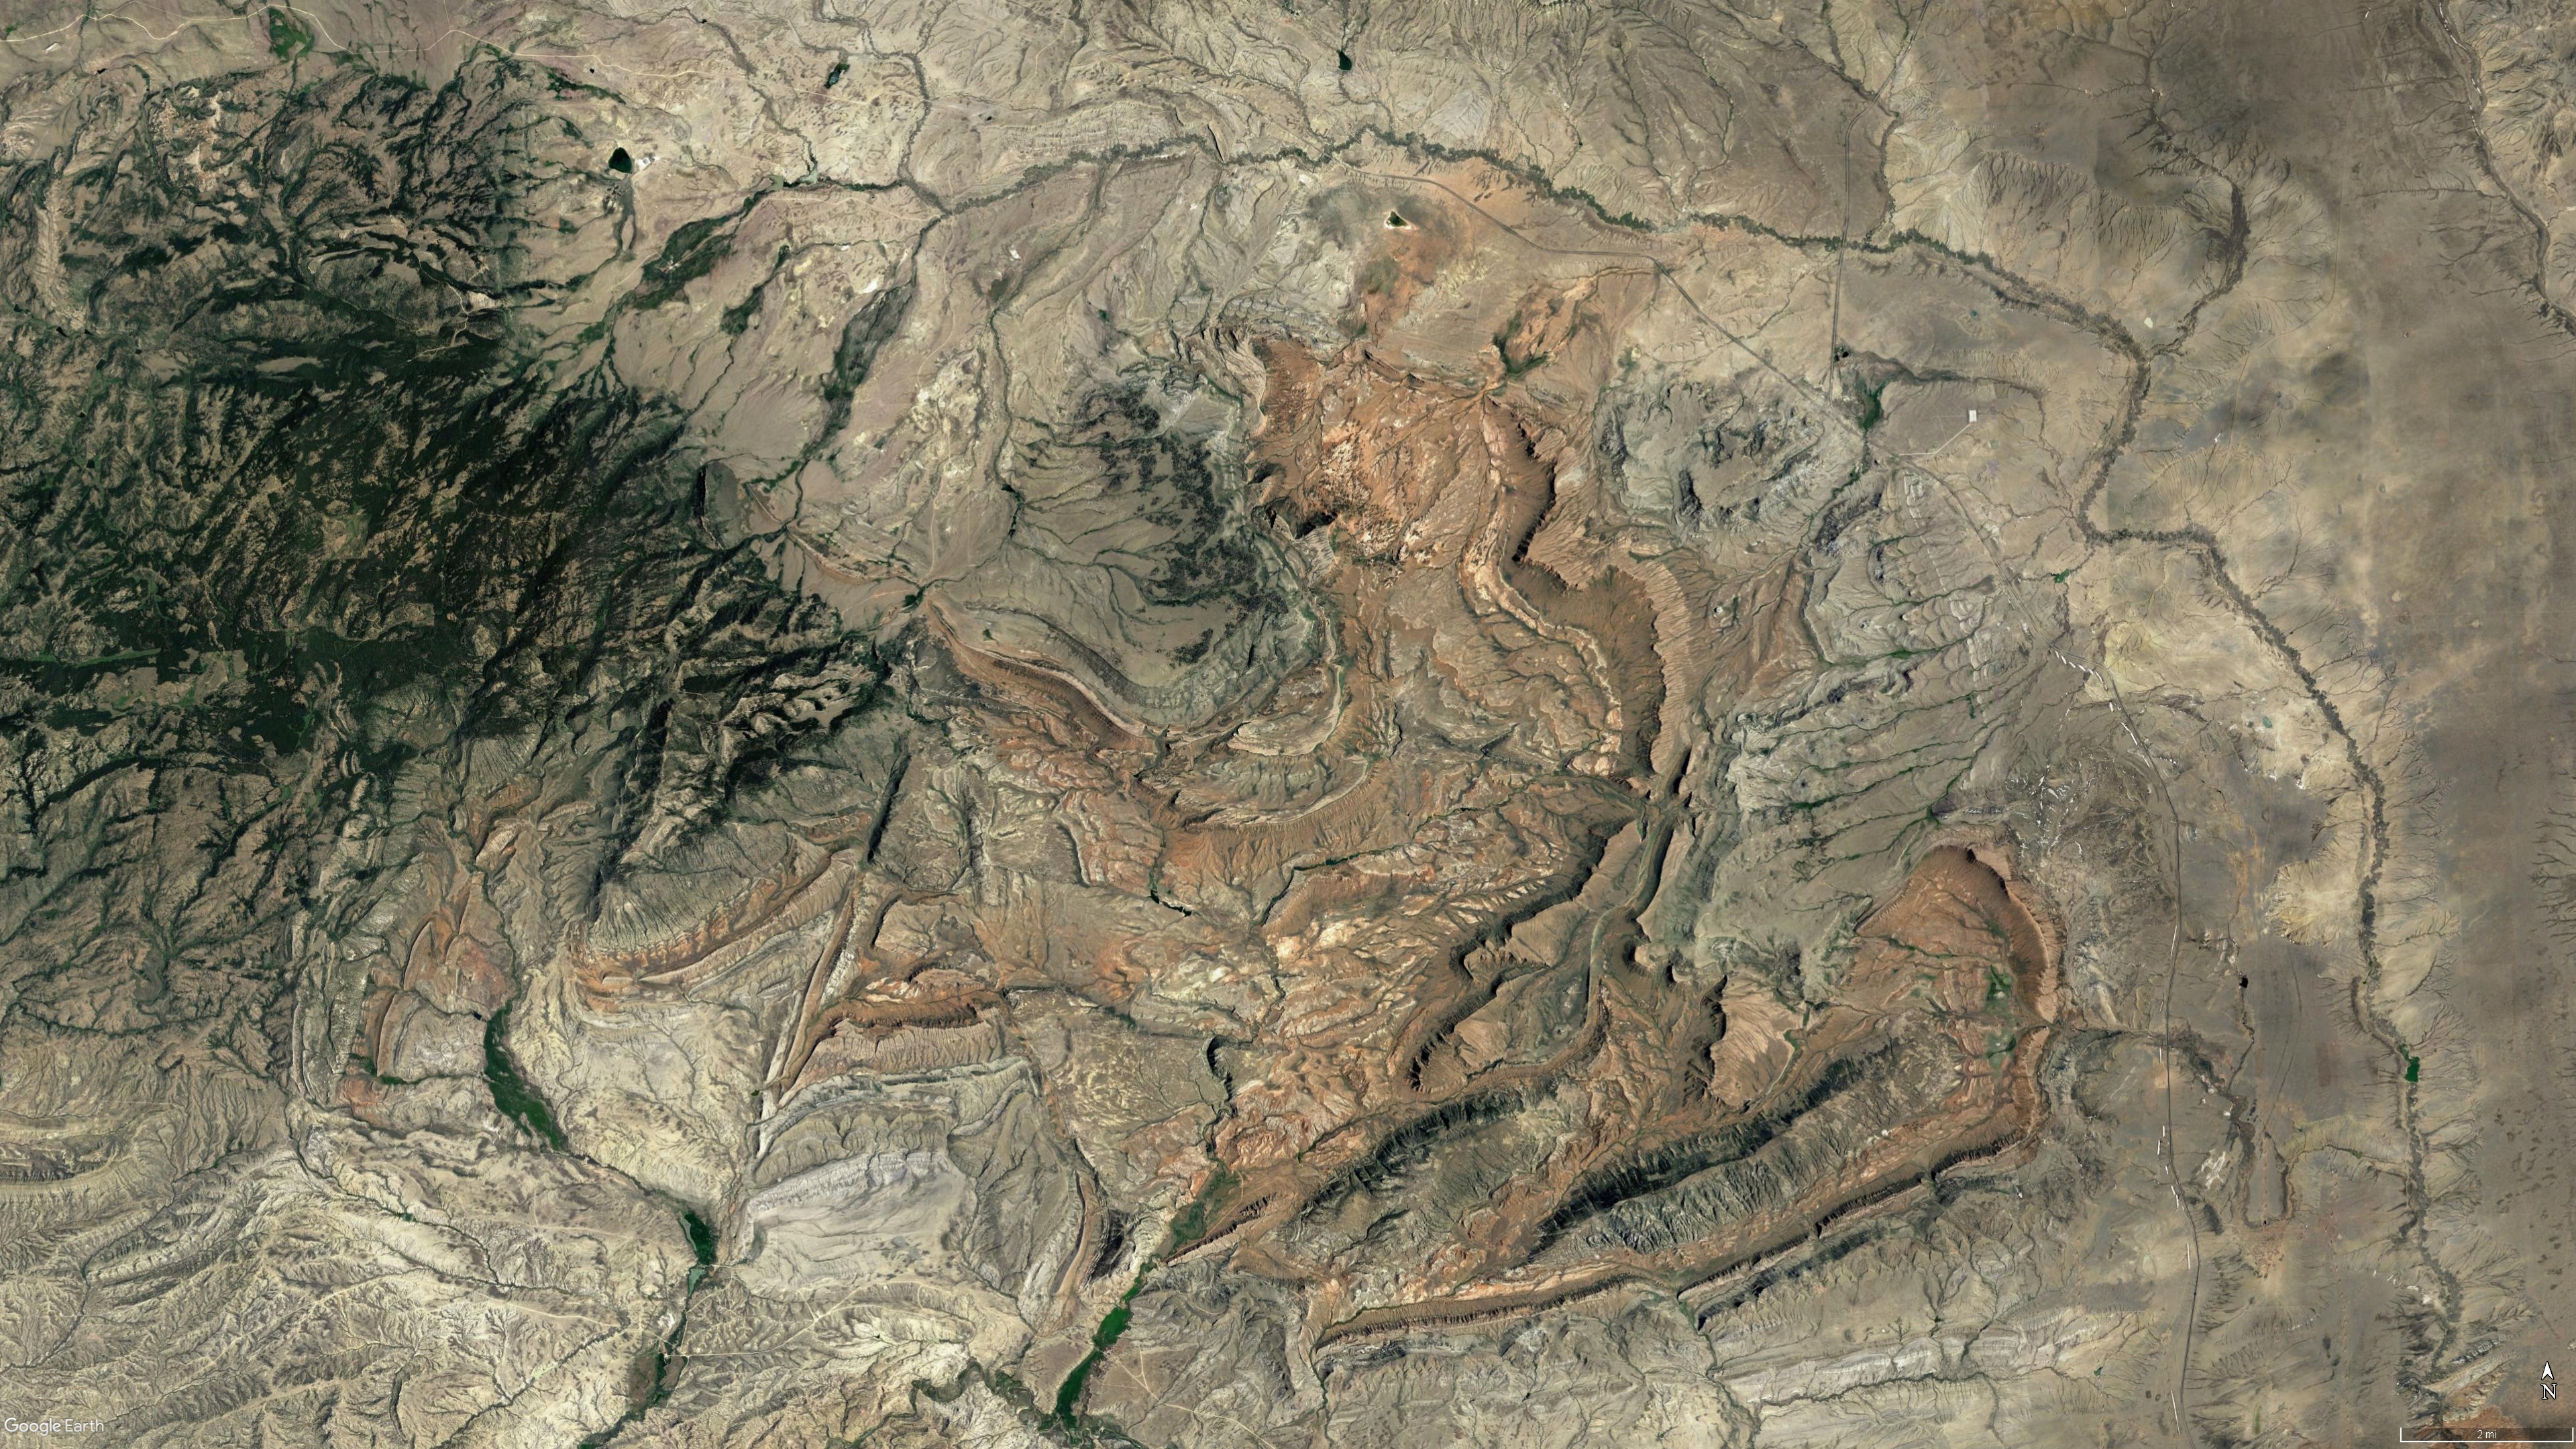
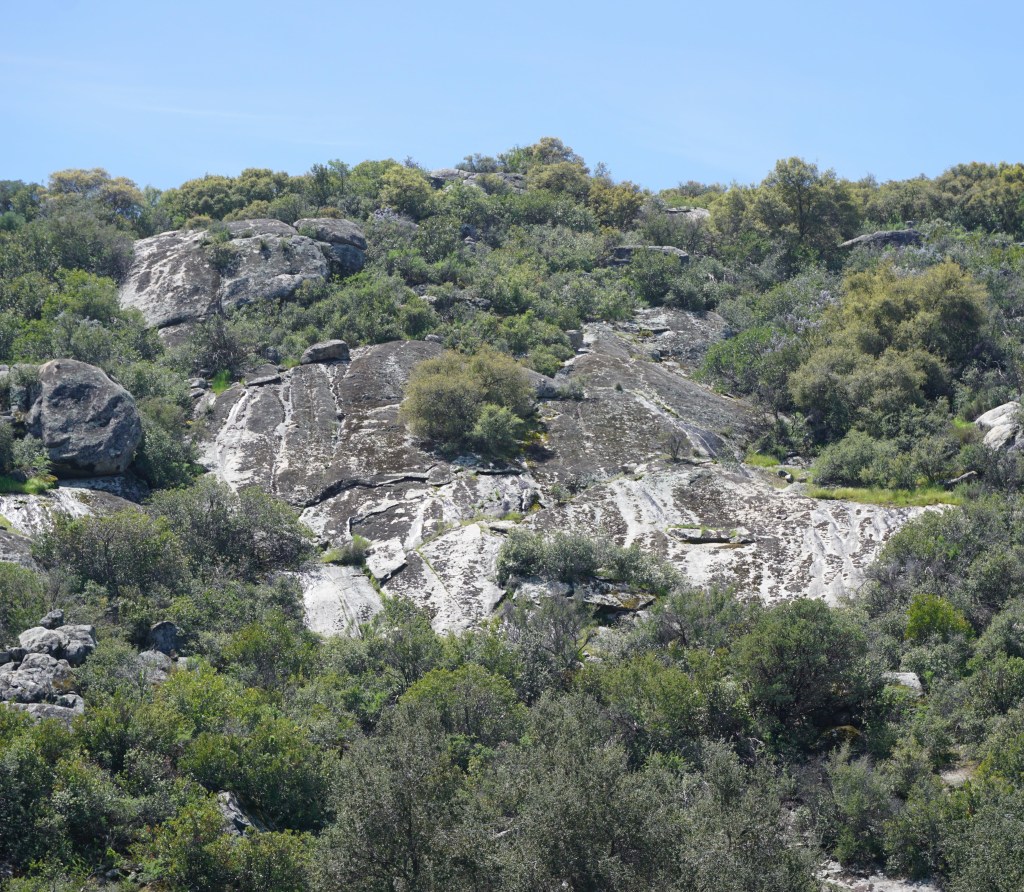
The evidence to back my theory is in the shape of the boulders, which precisely conform to the shape of fast cooling drops and clusters of drops. In fact, the boulders conform to shapes made of melted glass – silica dioxide – which is what these rocks are largely composed of. They do not conform to the expectations of conventional erosion. There is also evidence in the topography of the coastal mountains, which display the clear patterns of a large discharge of current from the Earth.
This differs from the consensus theory which has granite formed deep in the Earth as a volcanic flow that didn’t erupt to surface, but became trapped under extreme pressure and temperature for eons as it’s crystals grew. Then an accordion-like action of the Earth’s crust, triggered by subduction of the continents, caused these granites to be shoved 5000 feet above sea level where they have been lashed by wind, rain and freeze for millennia to produce the polished and rounded, but sometimes square granite boulders that we see.
At least the consensus and I agree there was extreme heat from within the Earth. My boiling drop-theory suggests things pretty much happened all at once due to a high voltage electrical impulse diffusing through a sandstone aquifer.
Boulder Foam
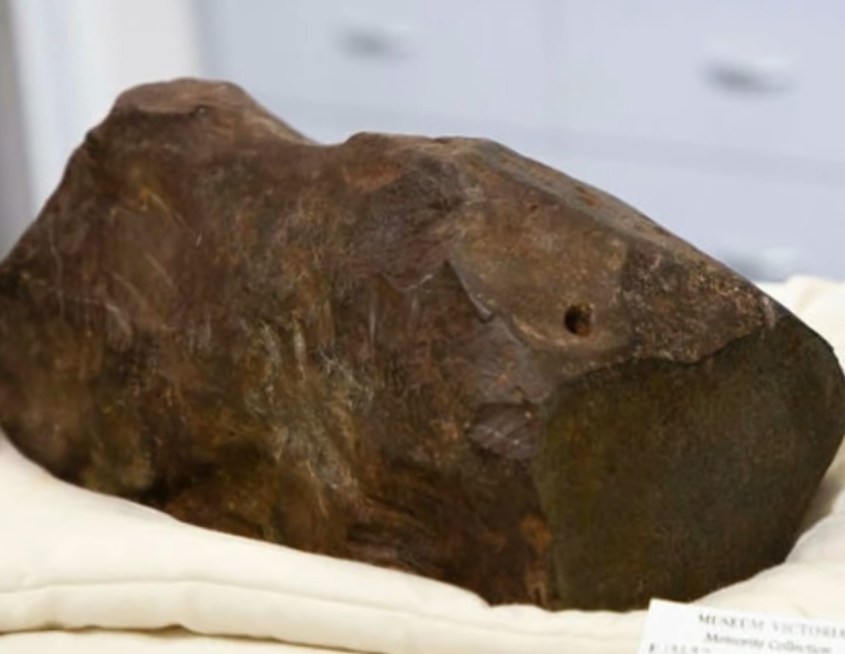
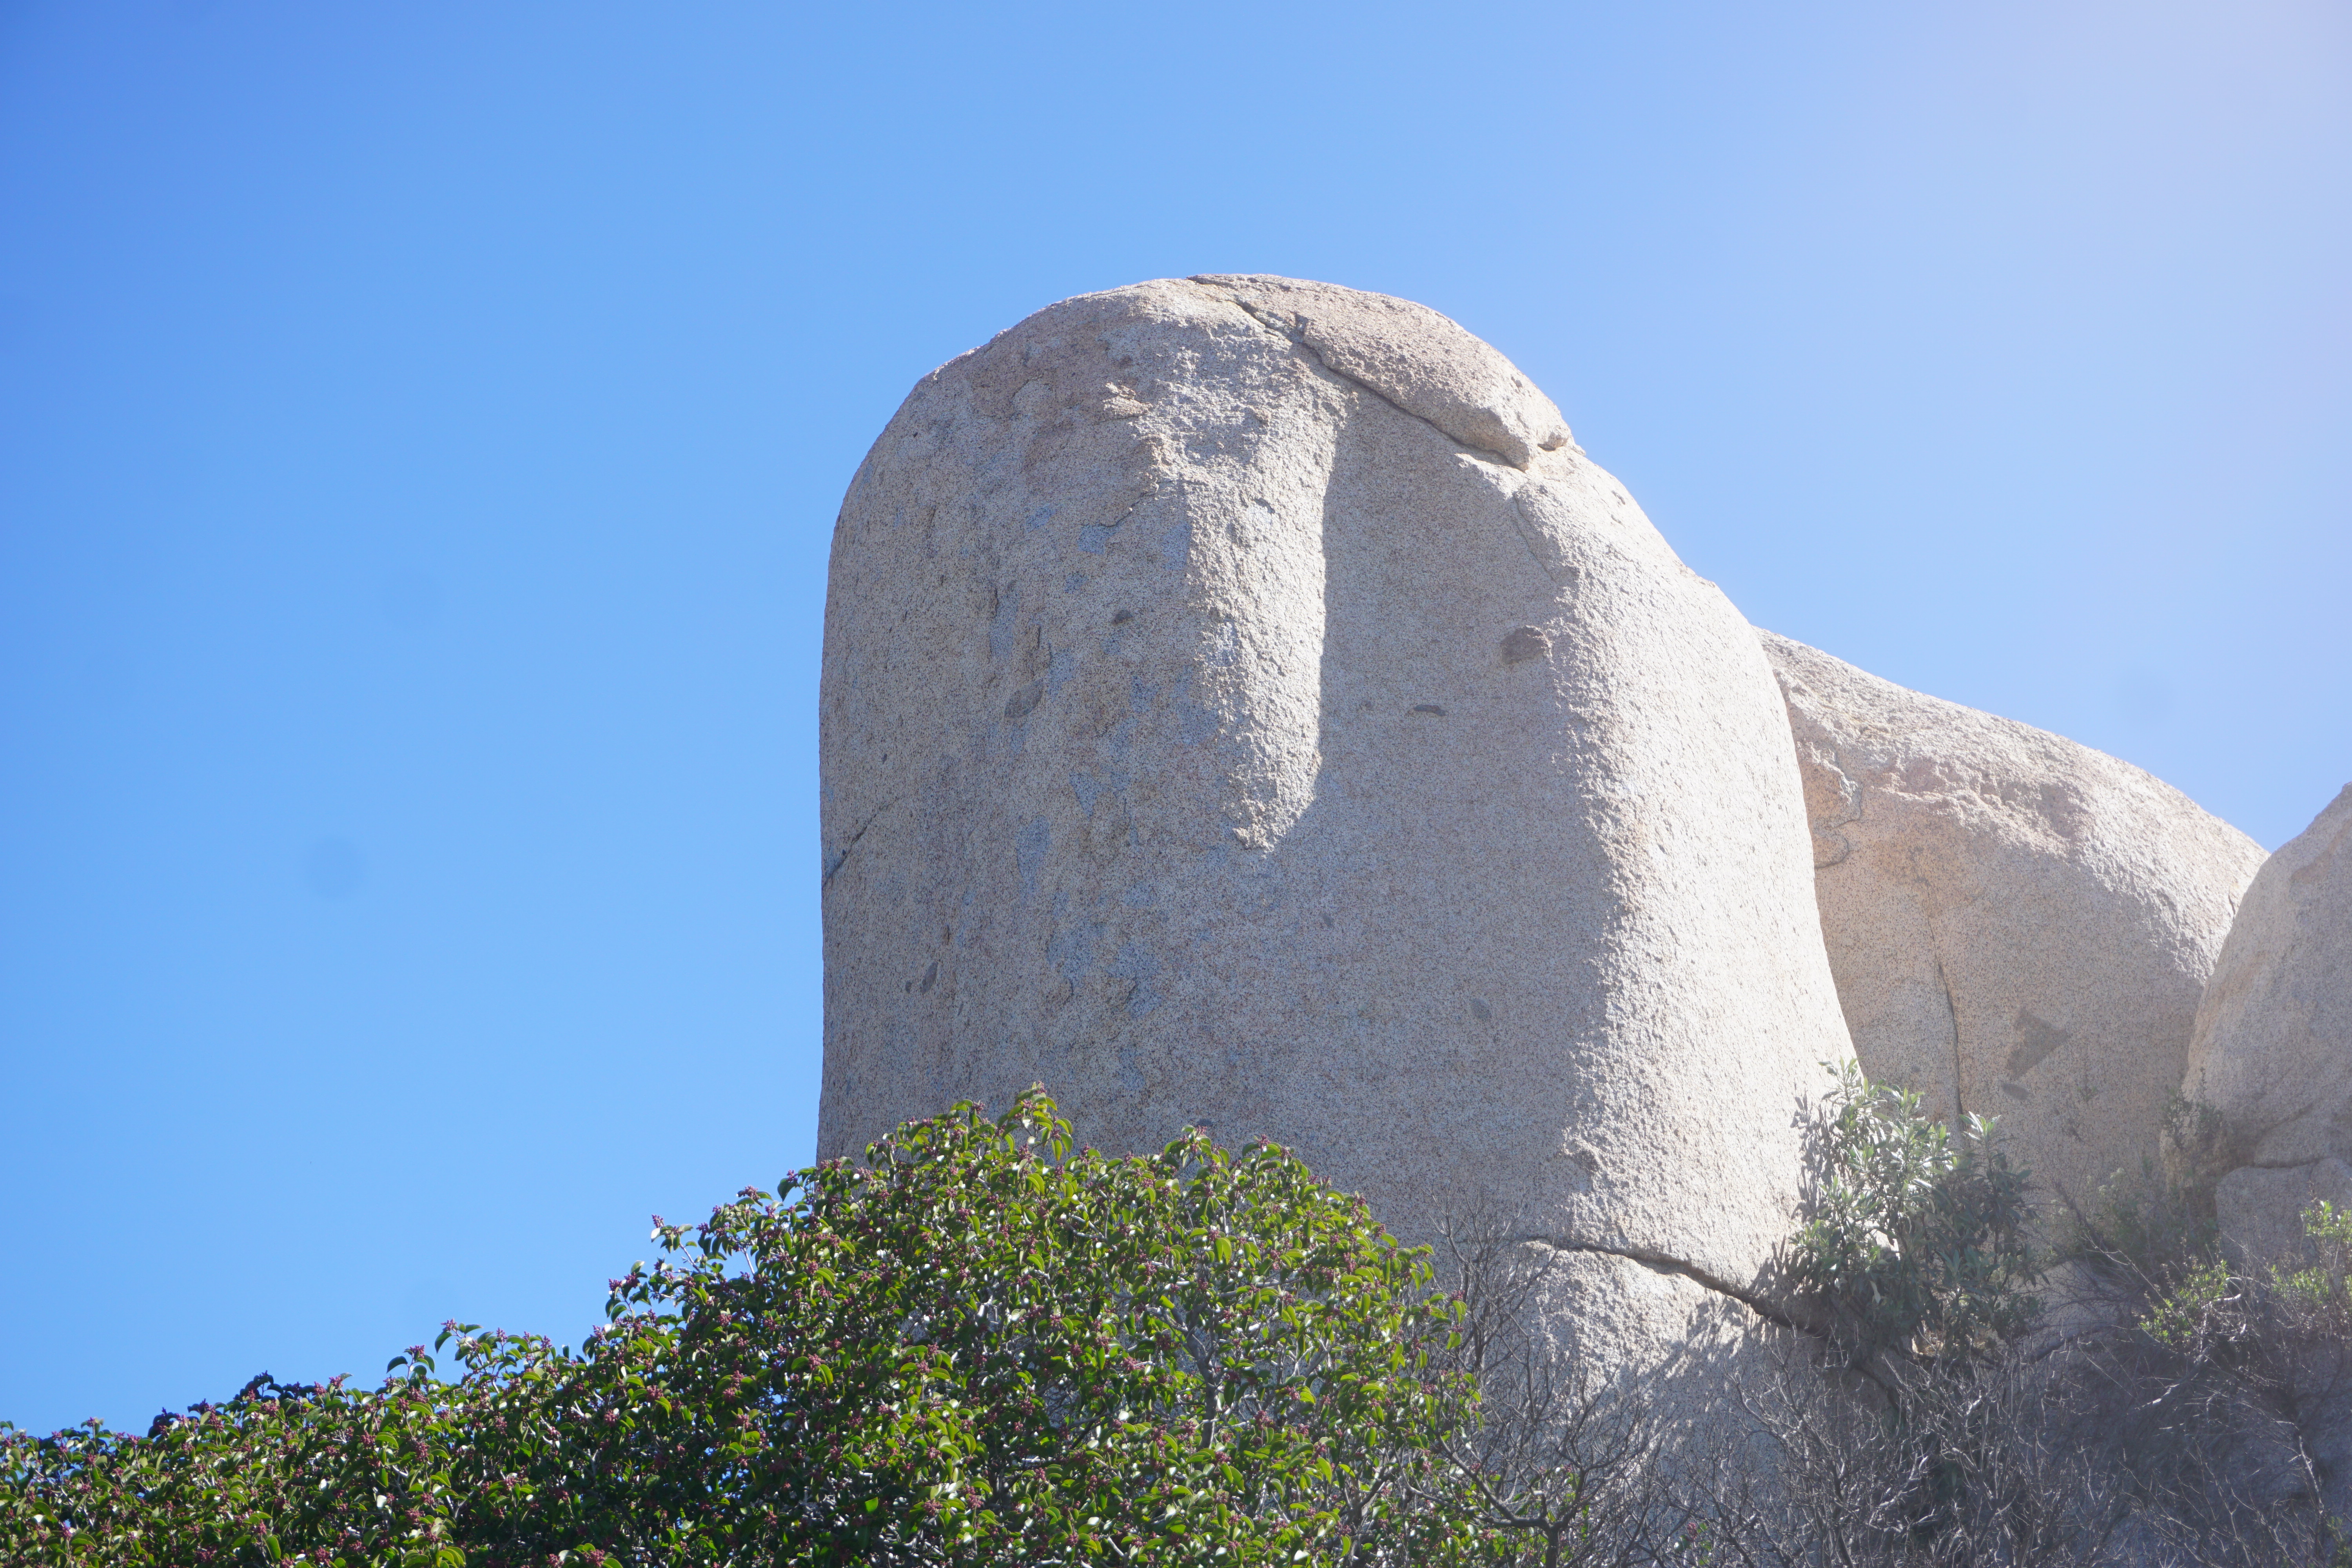
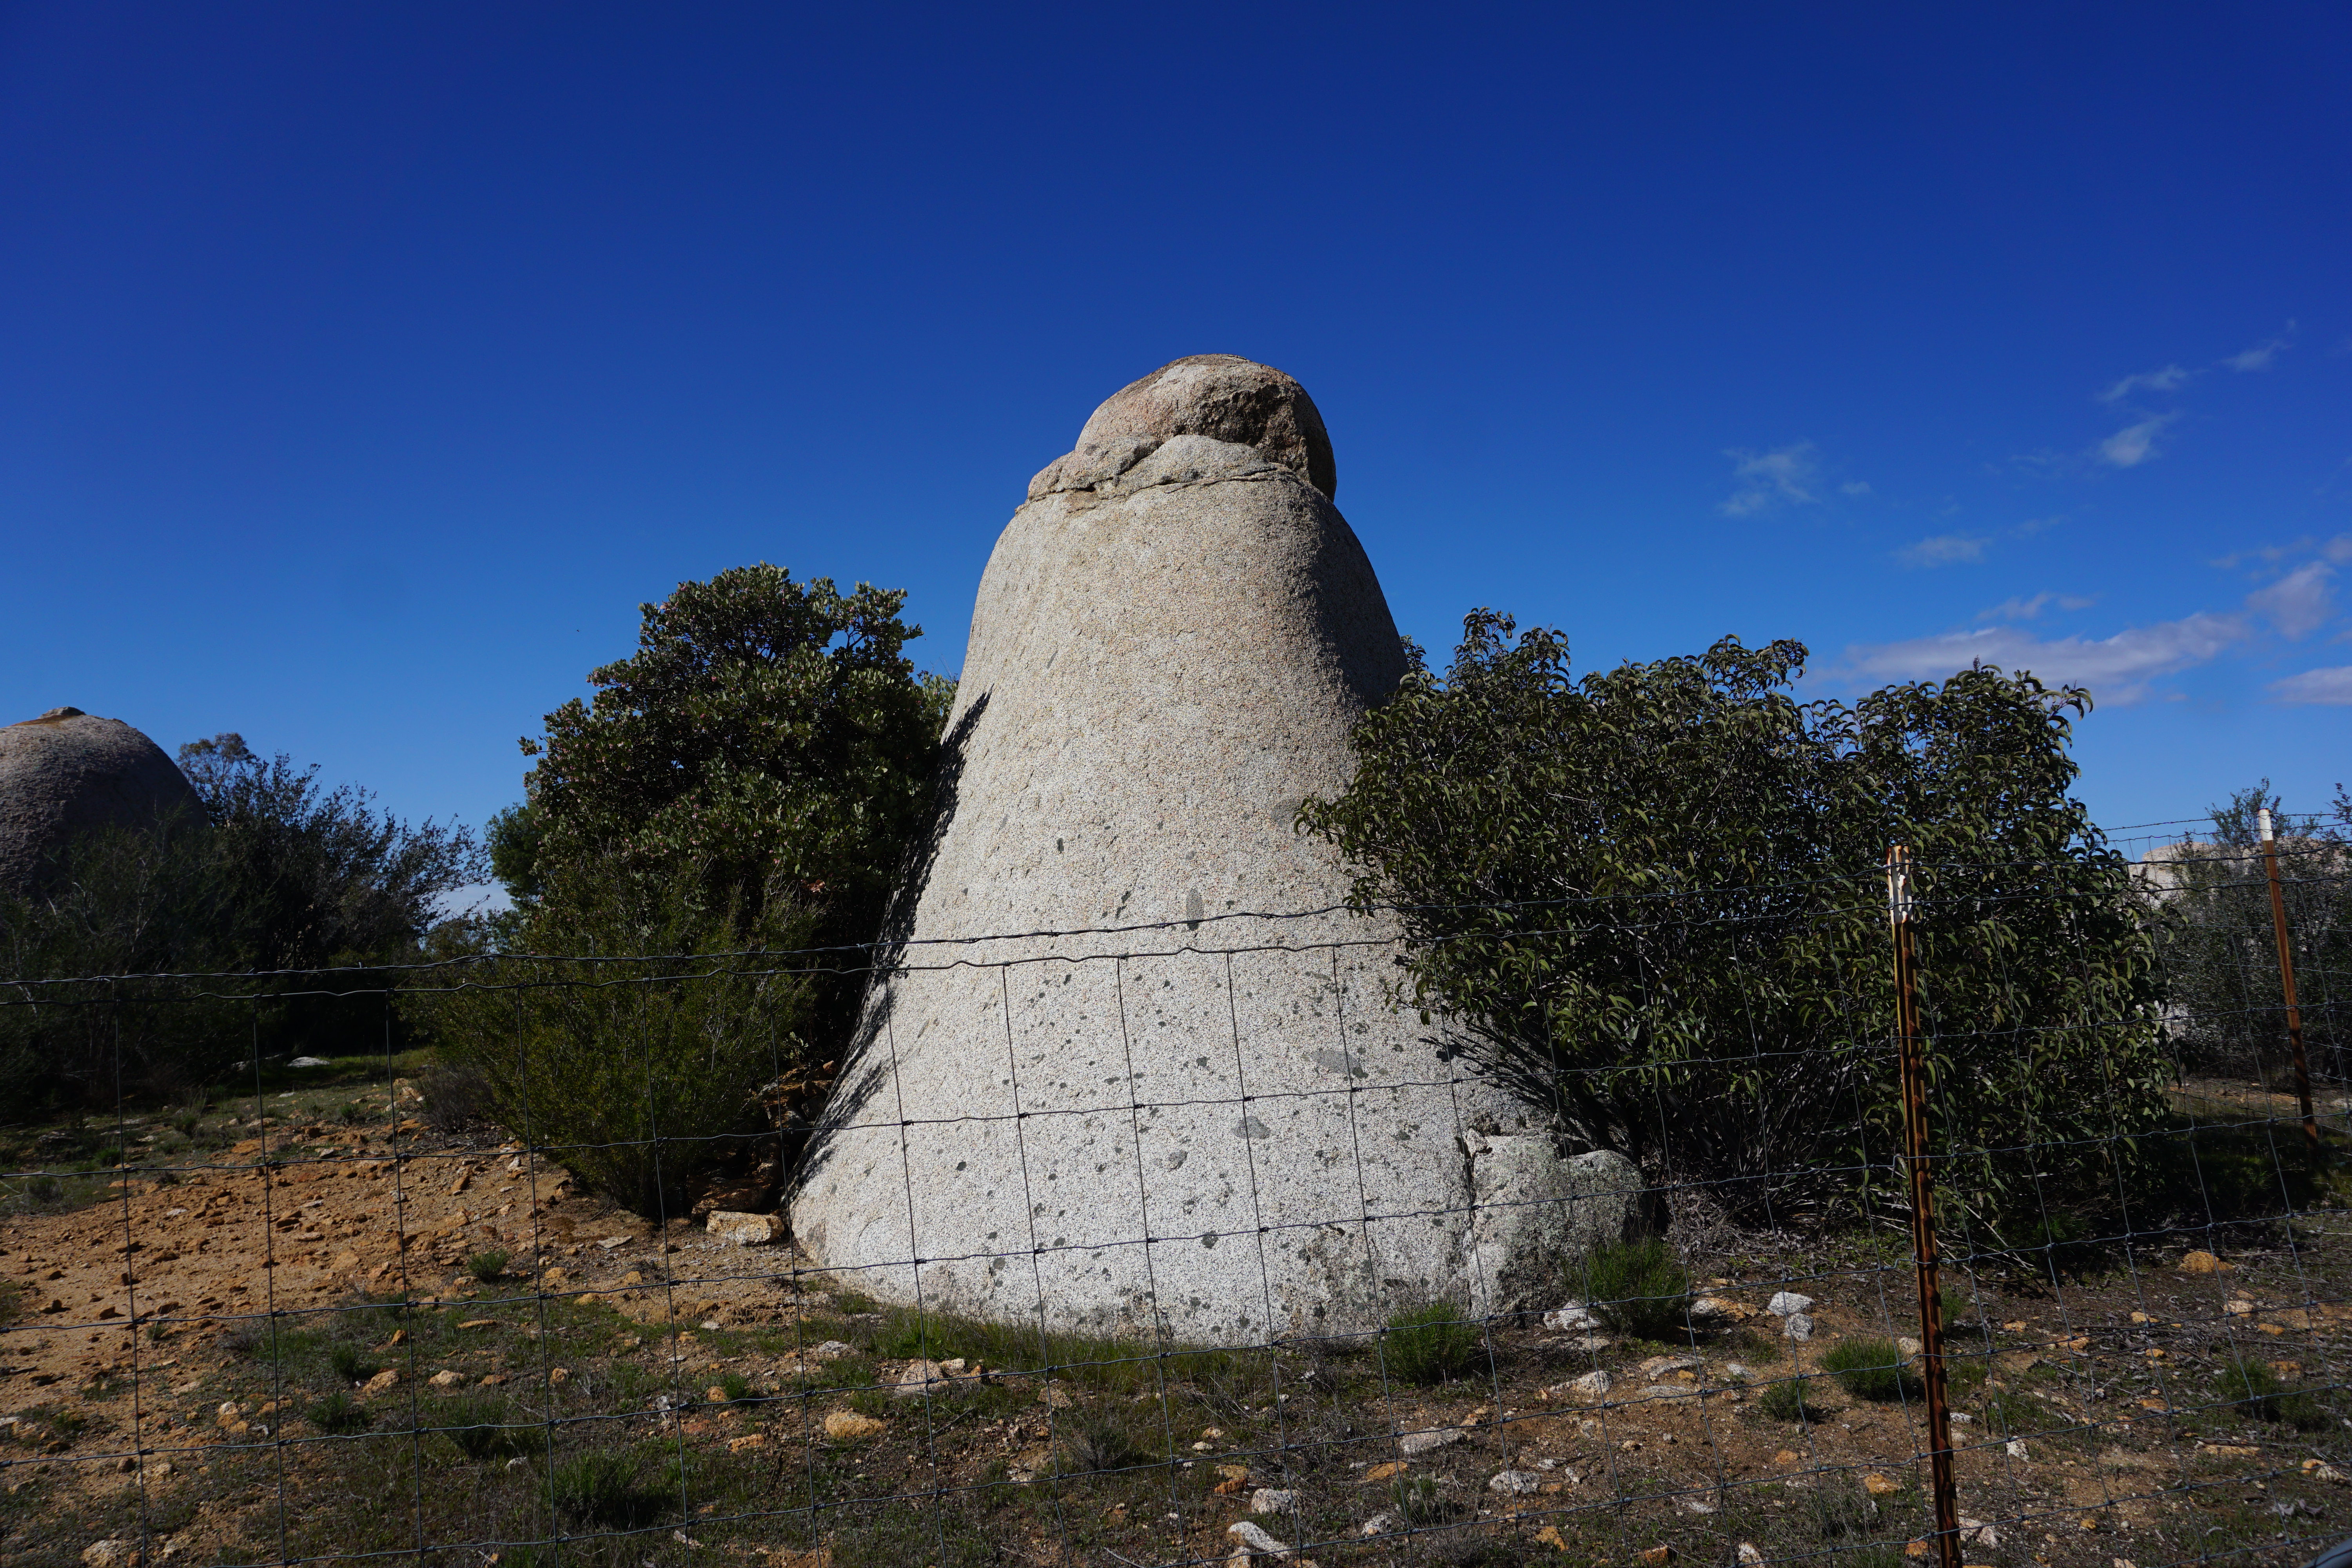
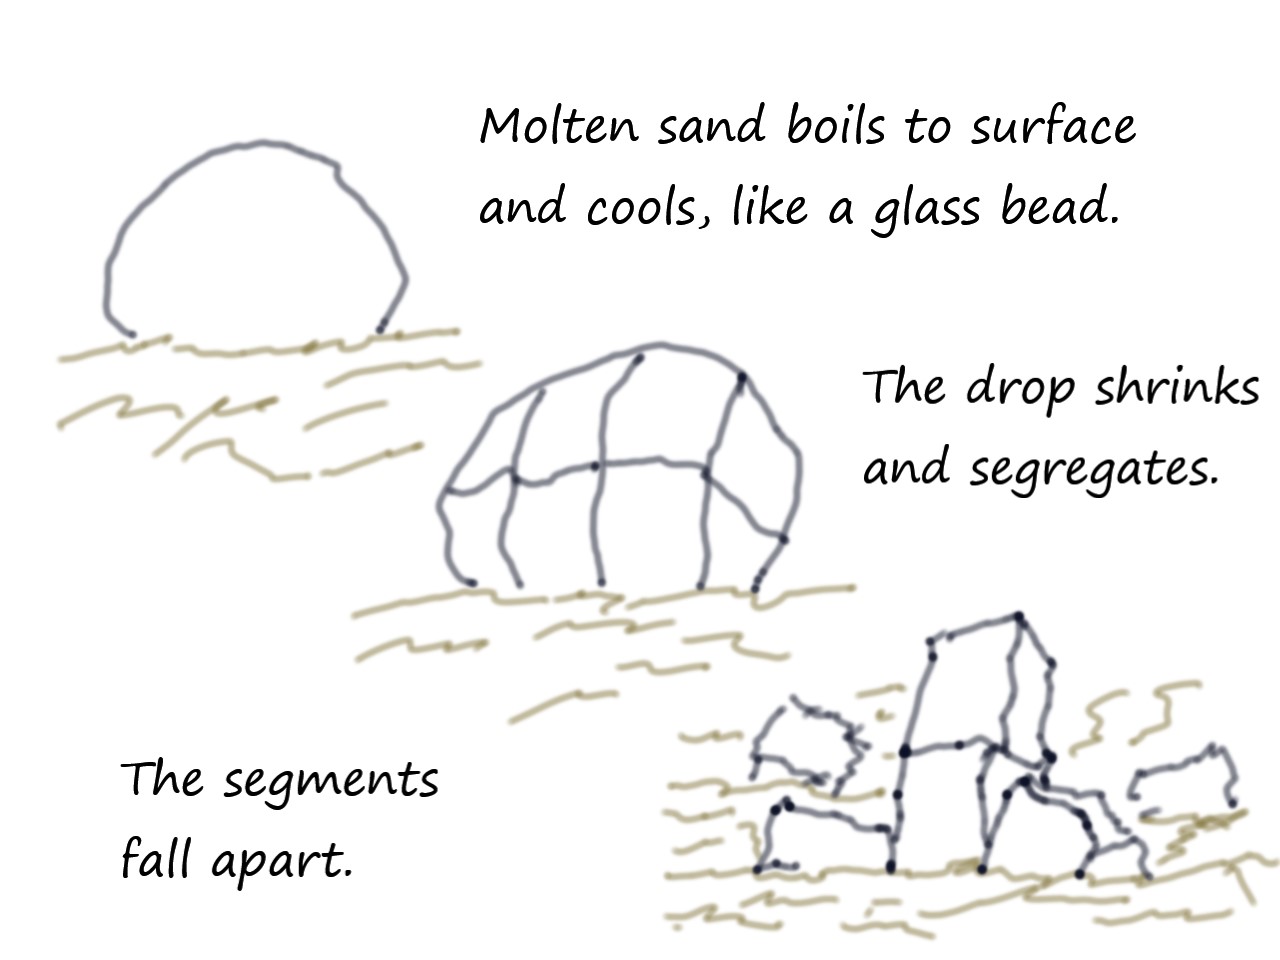
Evidence the boulder formations are boils is their shape, as depicted in the images previously shown, where singular drops formed and froze. While some retained an ovular shape, they dehydrated and contracted as they cooled, often leaving conical or flattened drops. This is exactly what one expects from a hot molten drop that cools, dries and solidifies quickly.
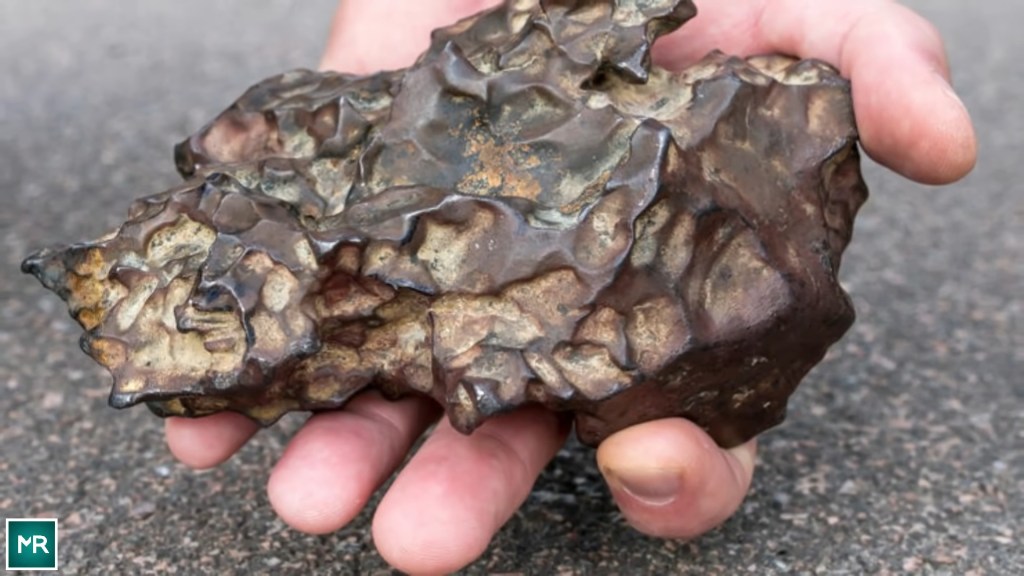
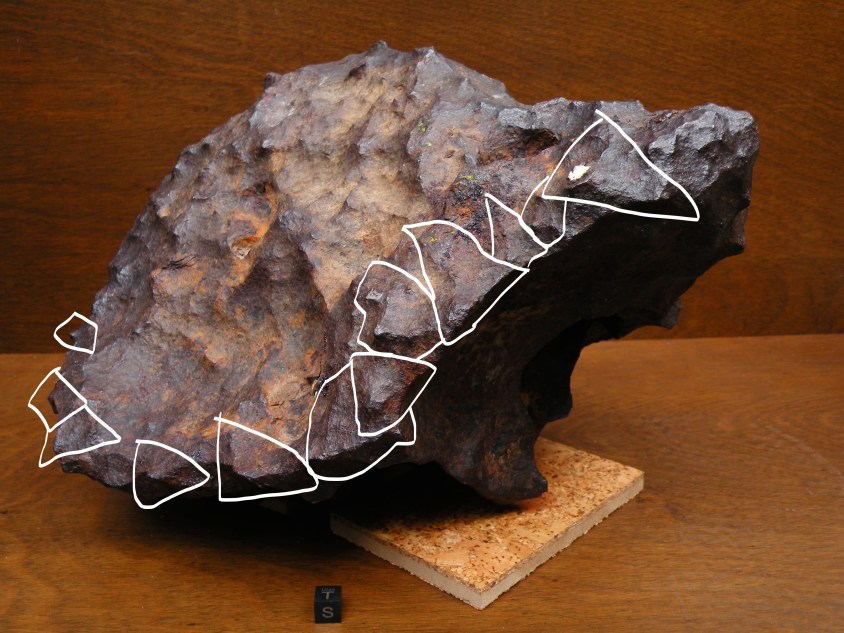
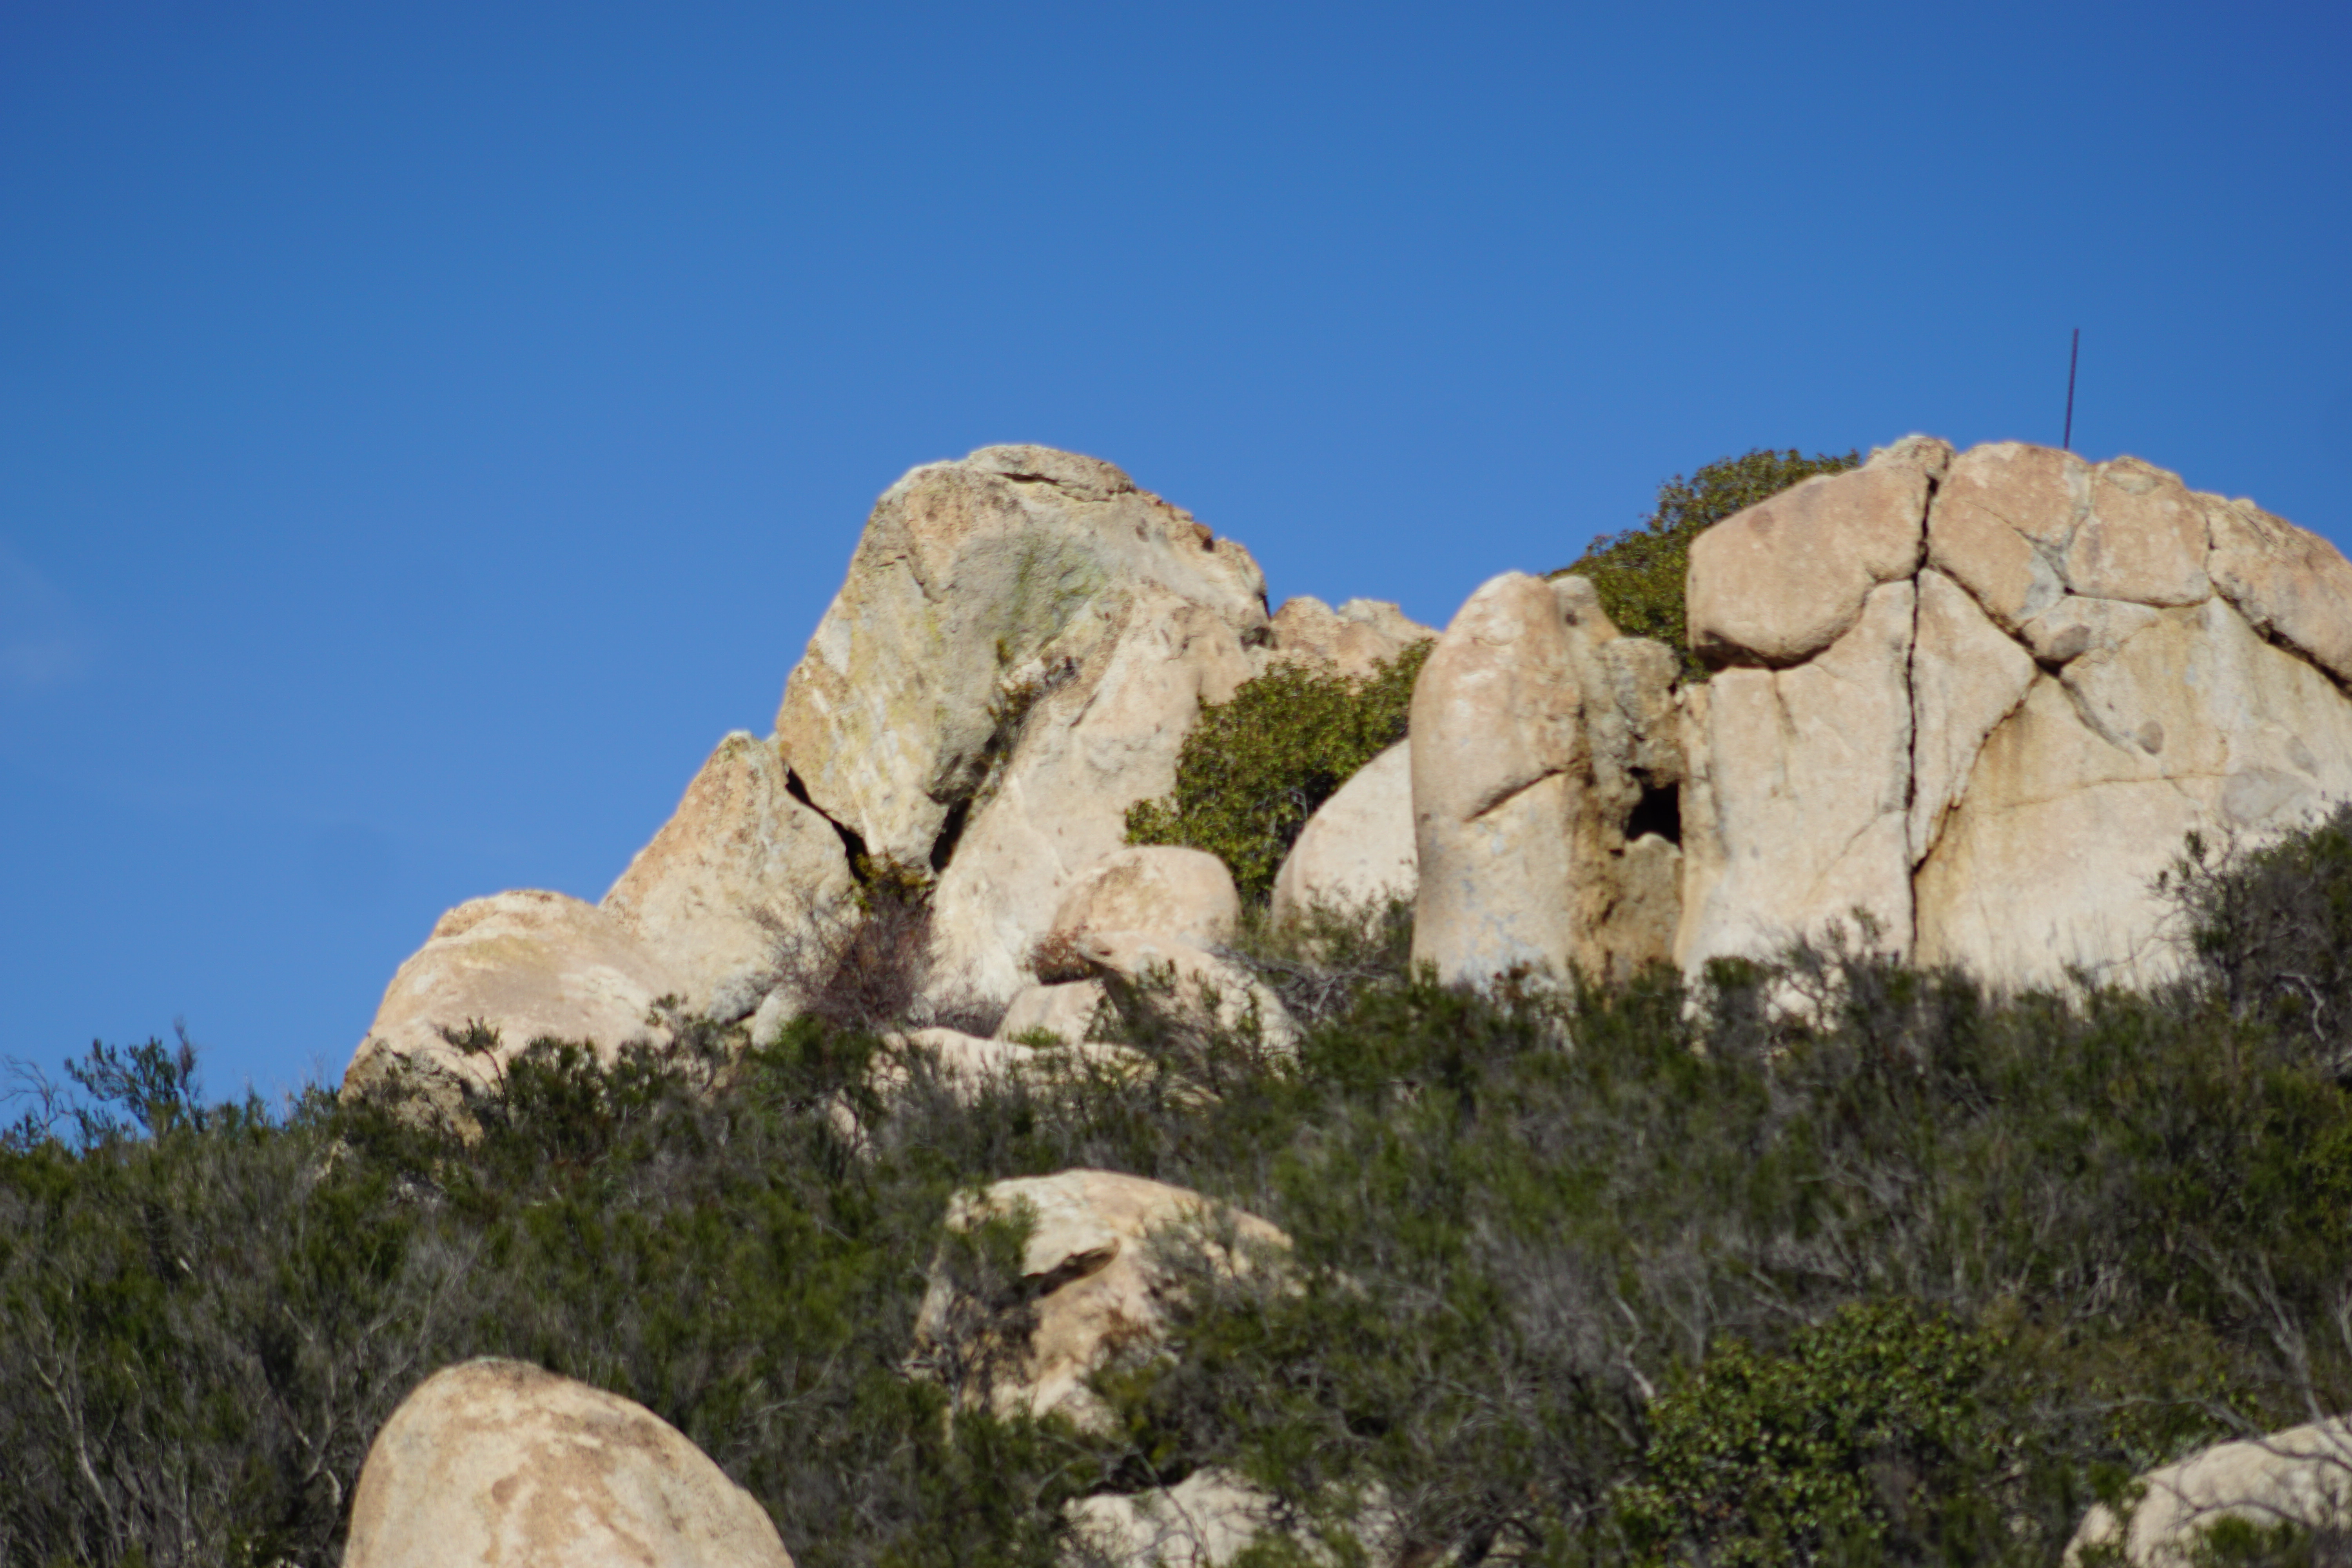
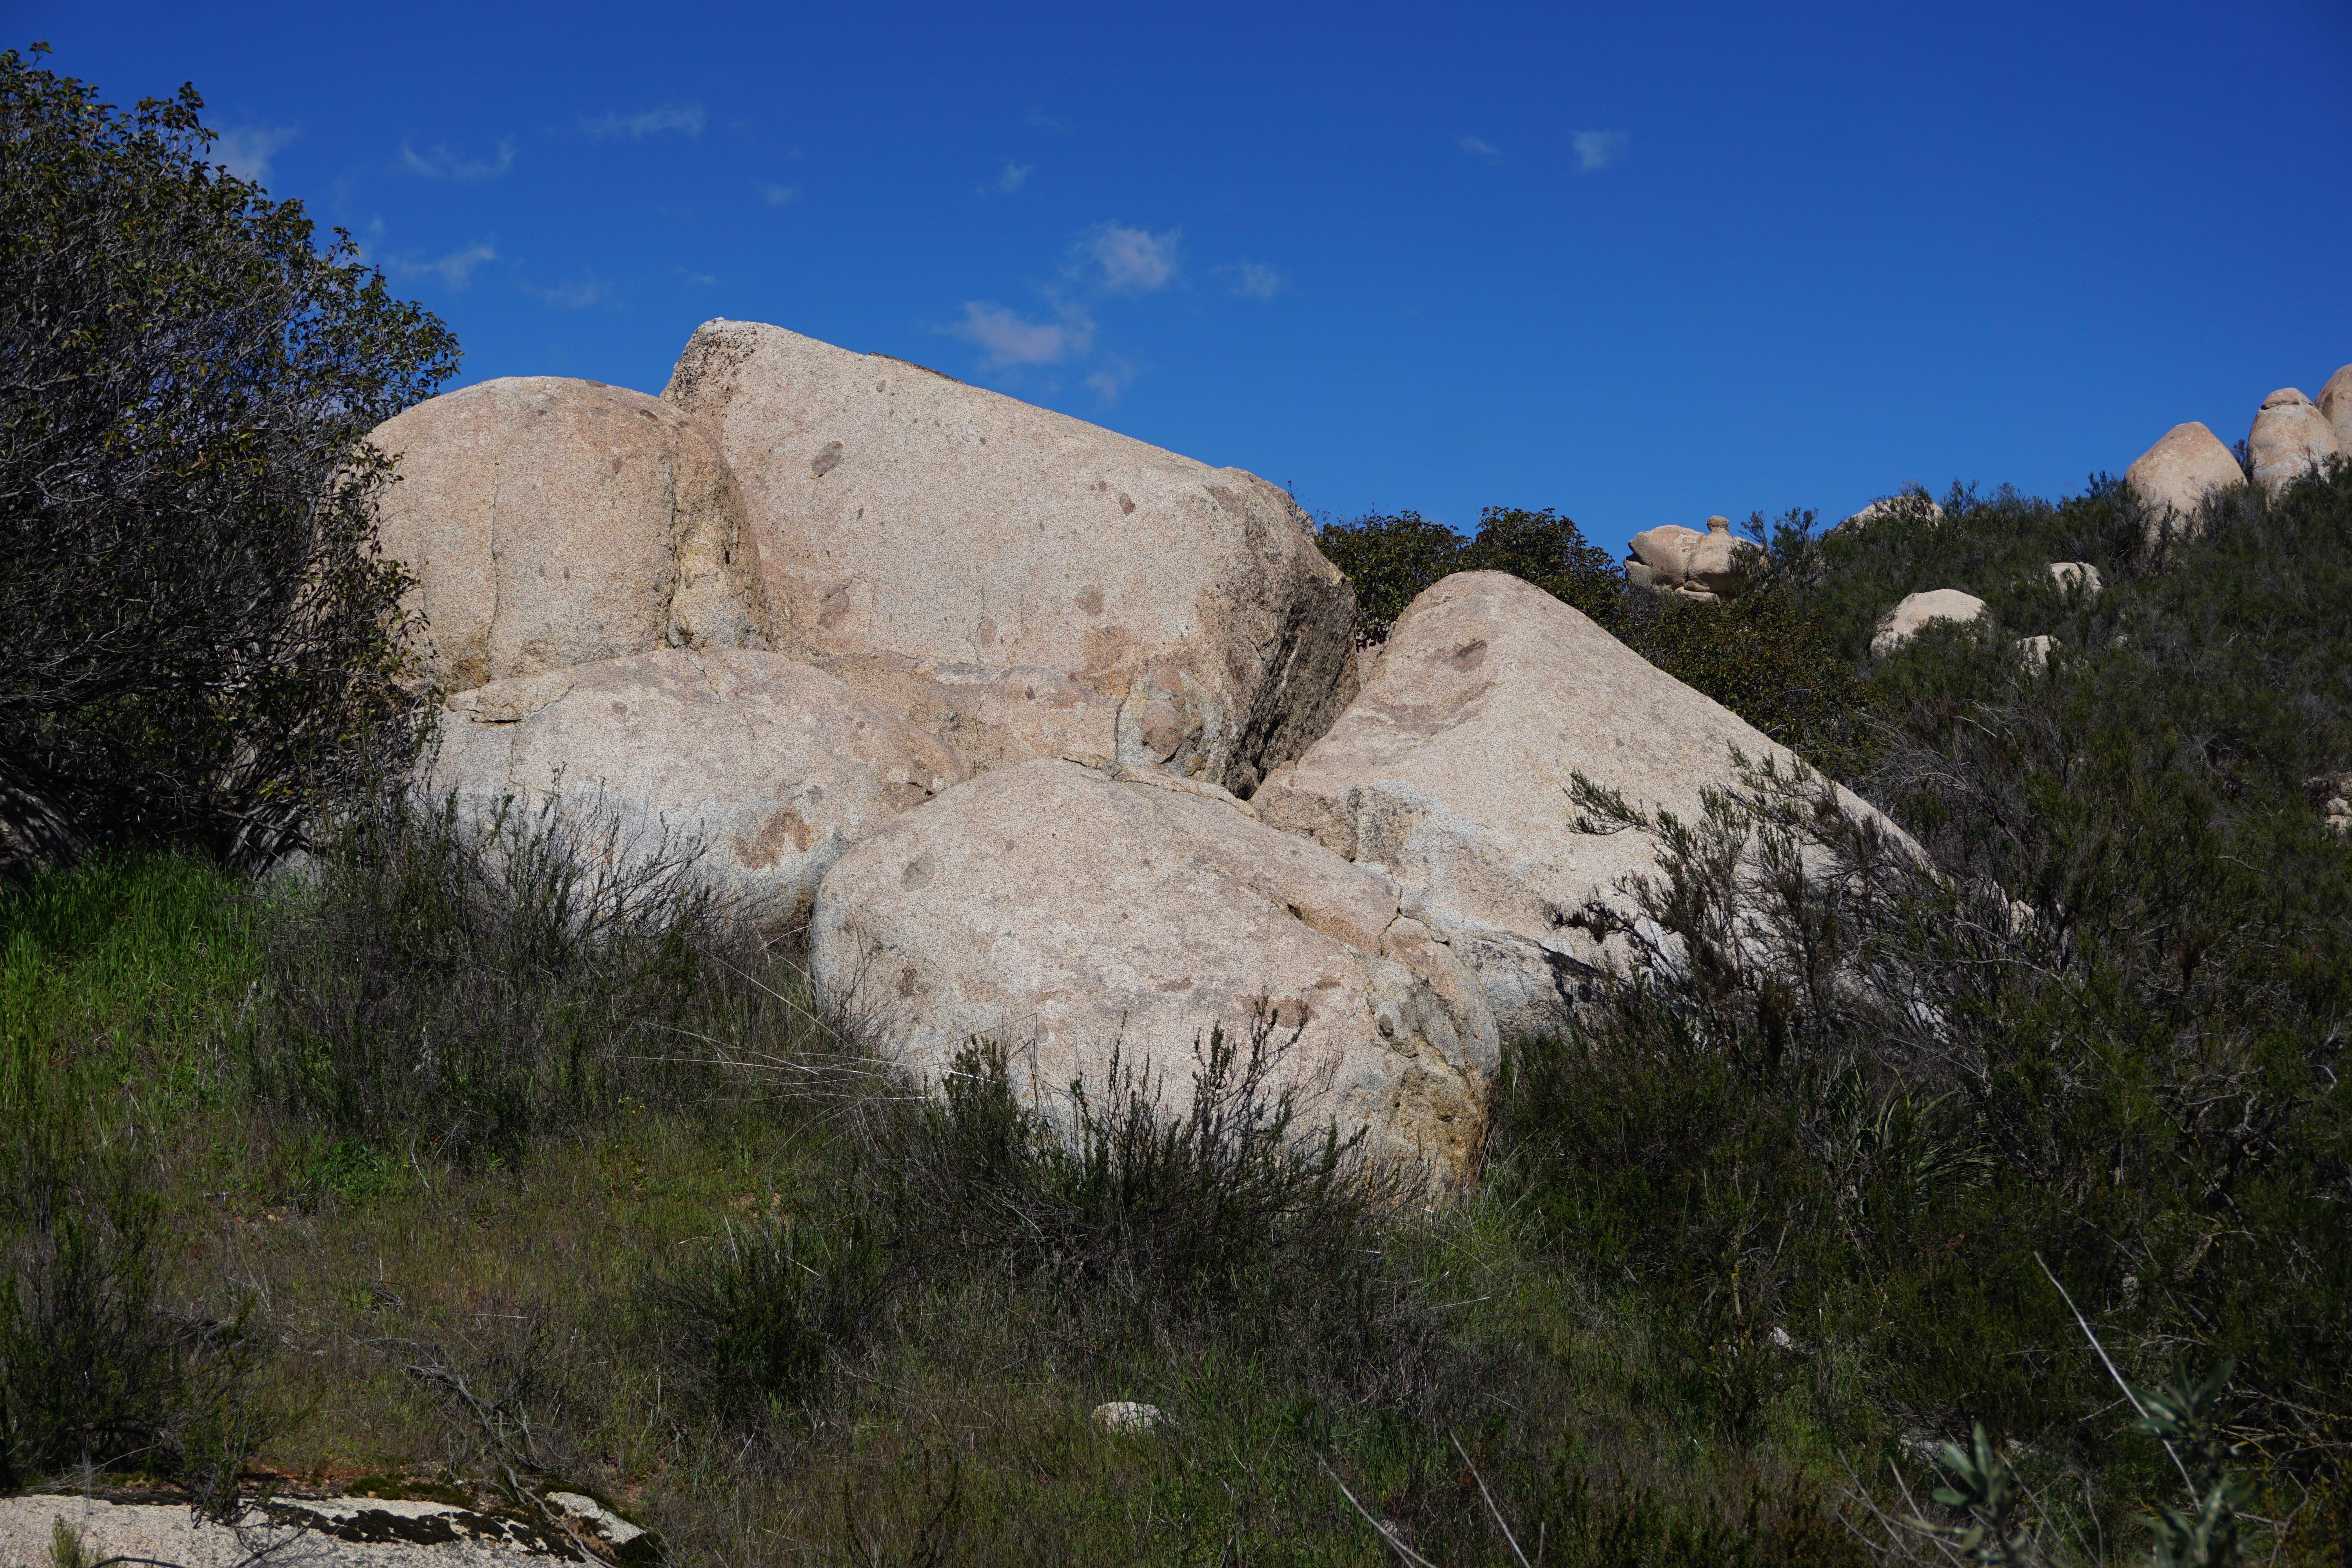
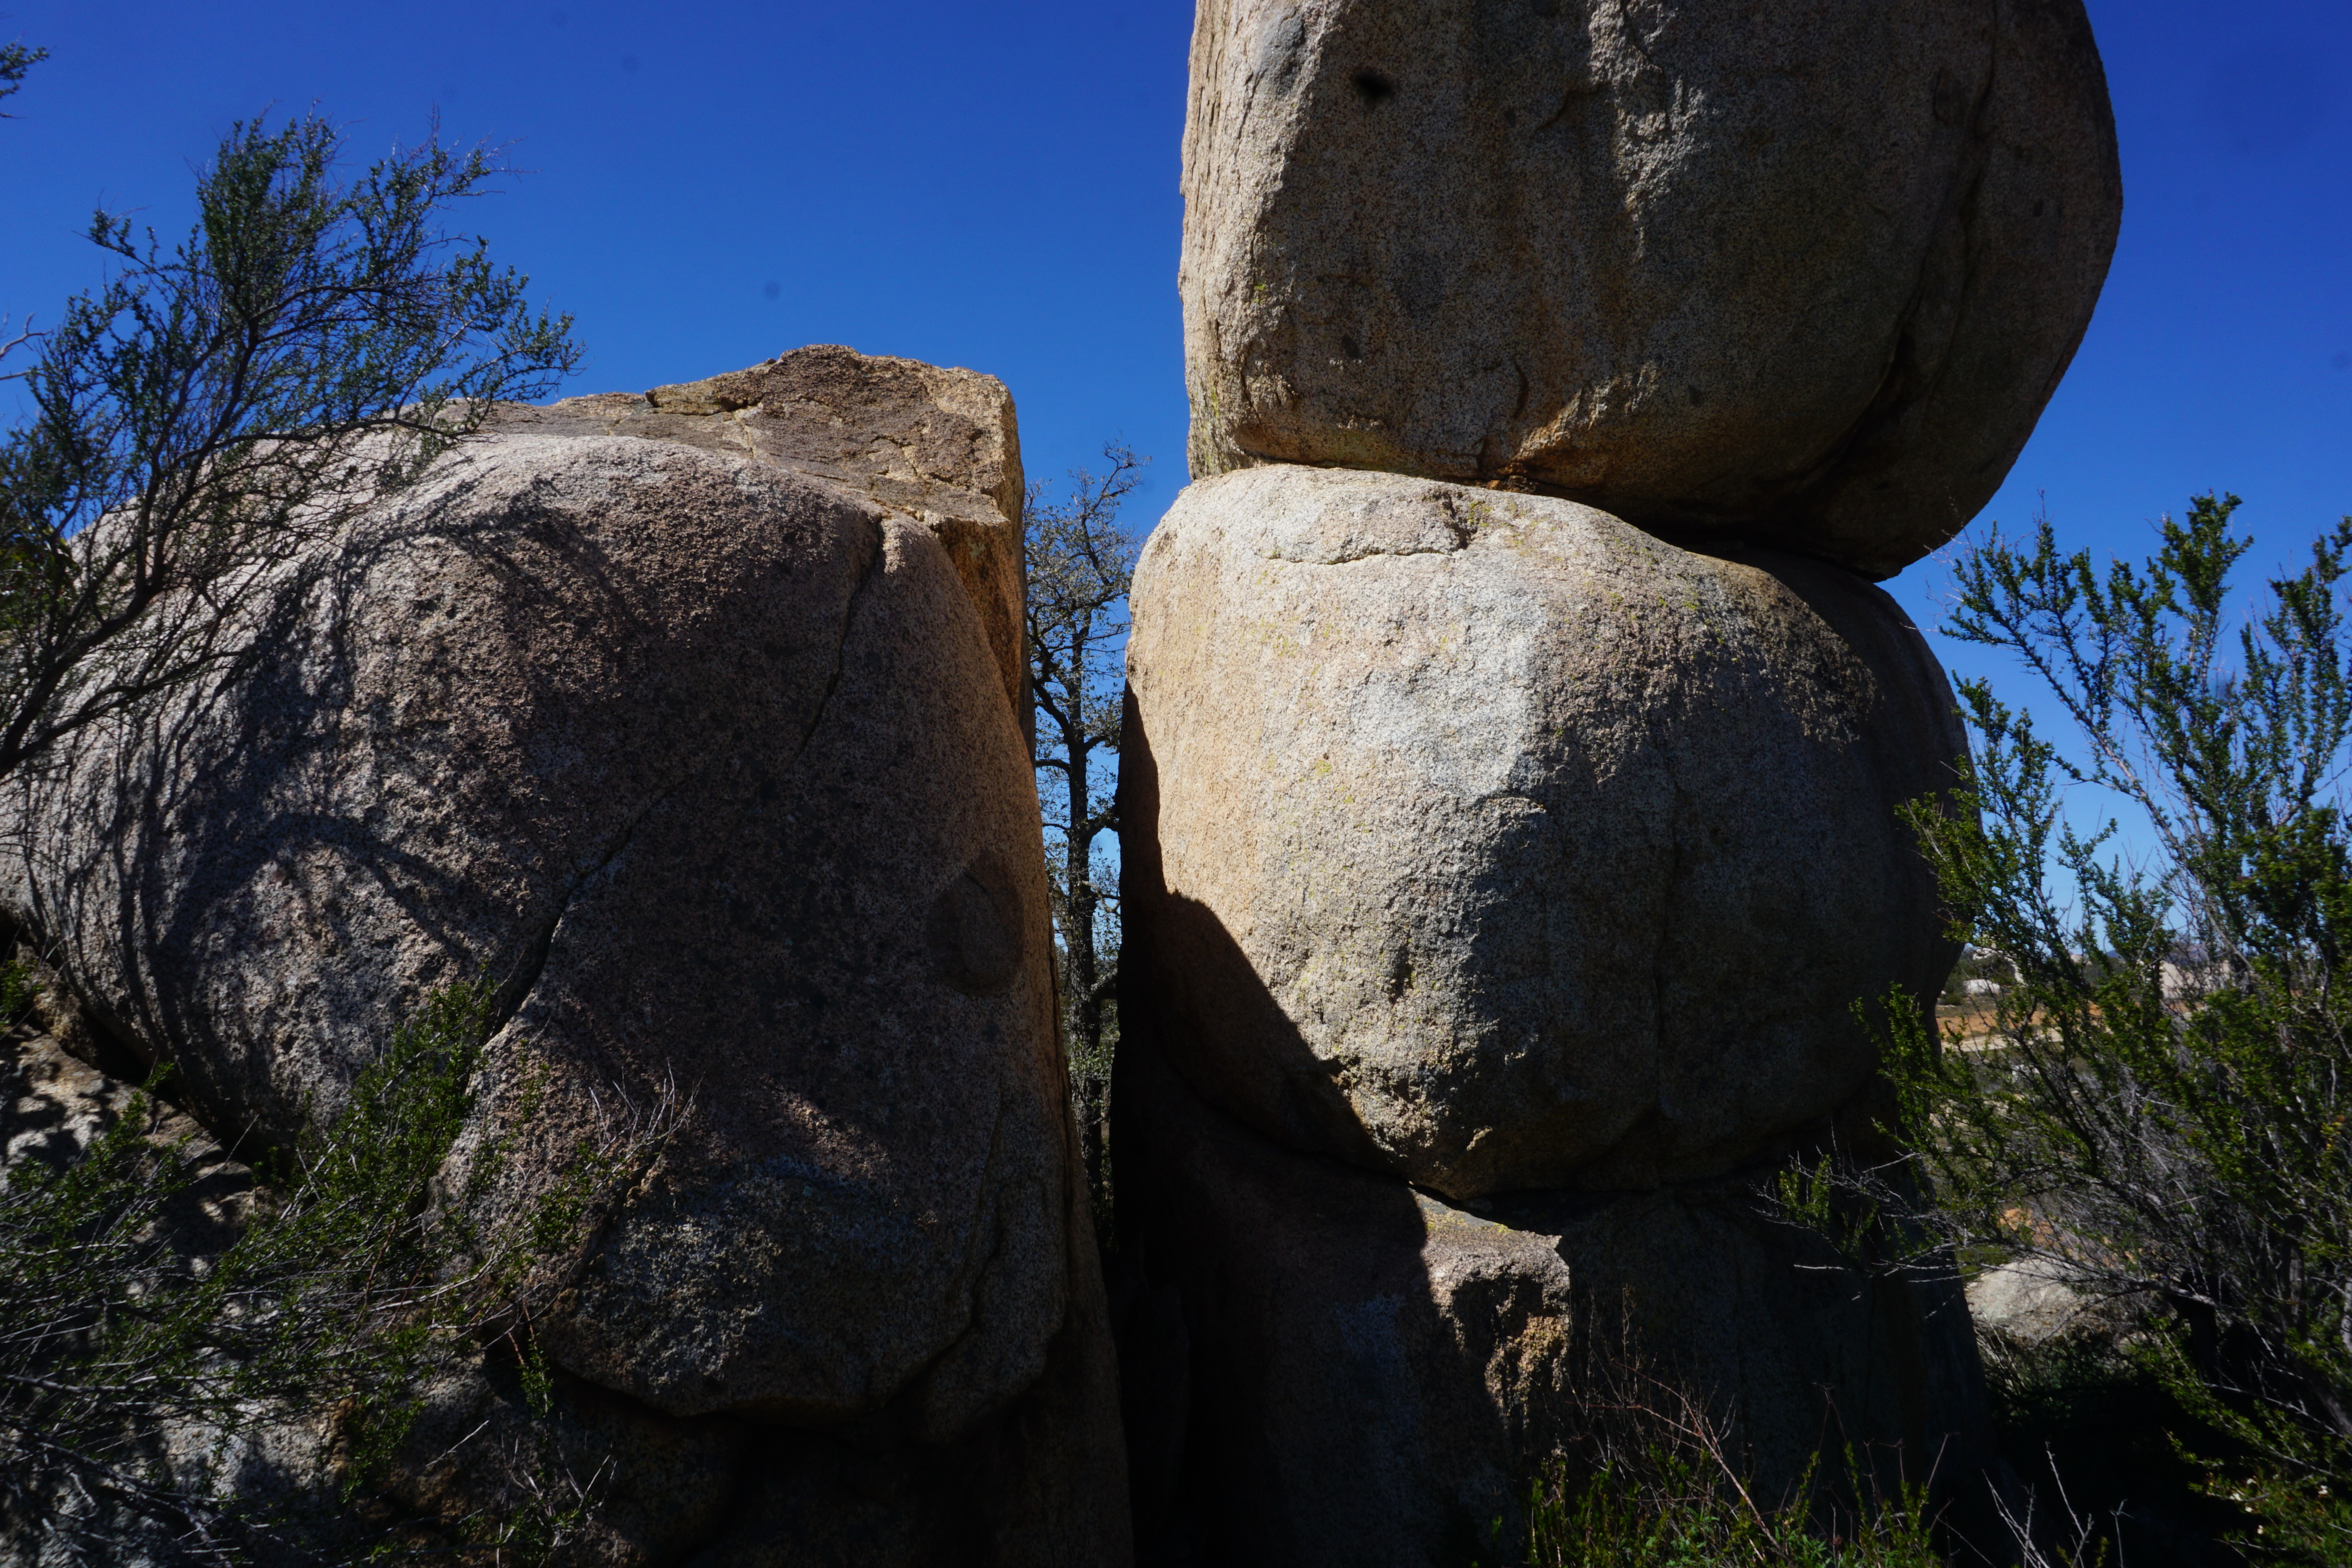
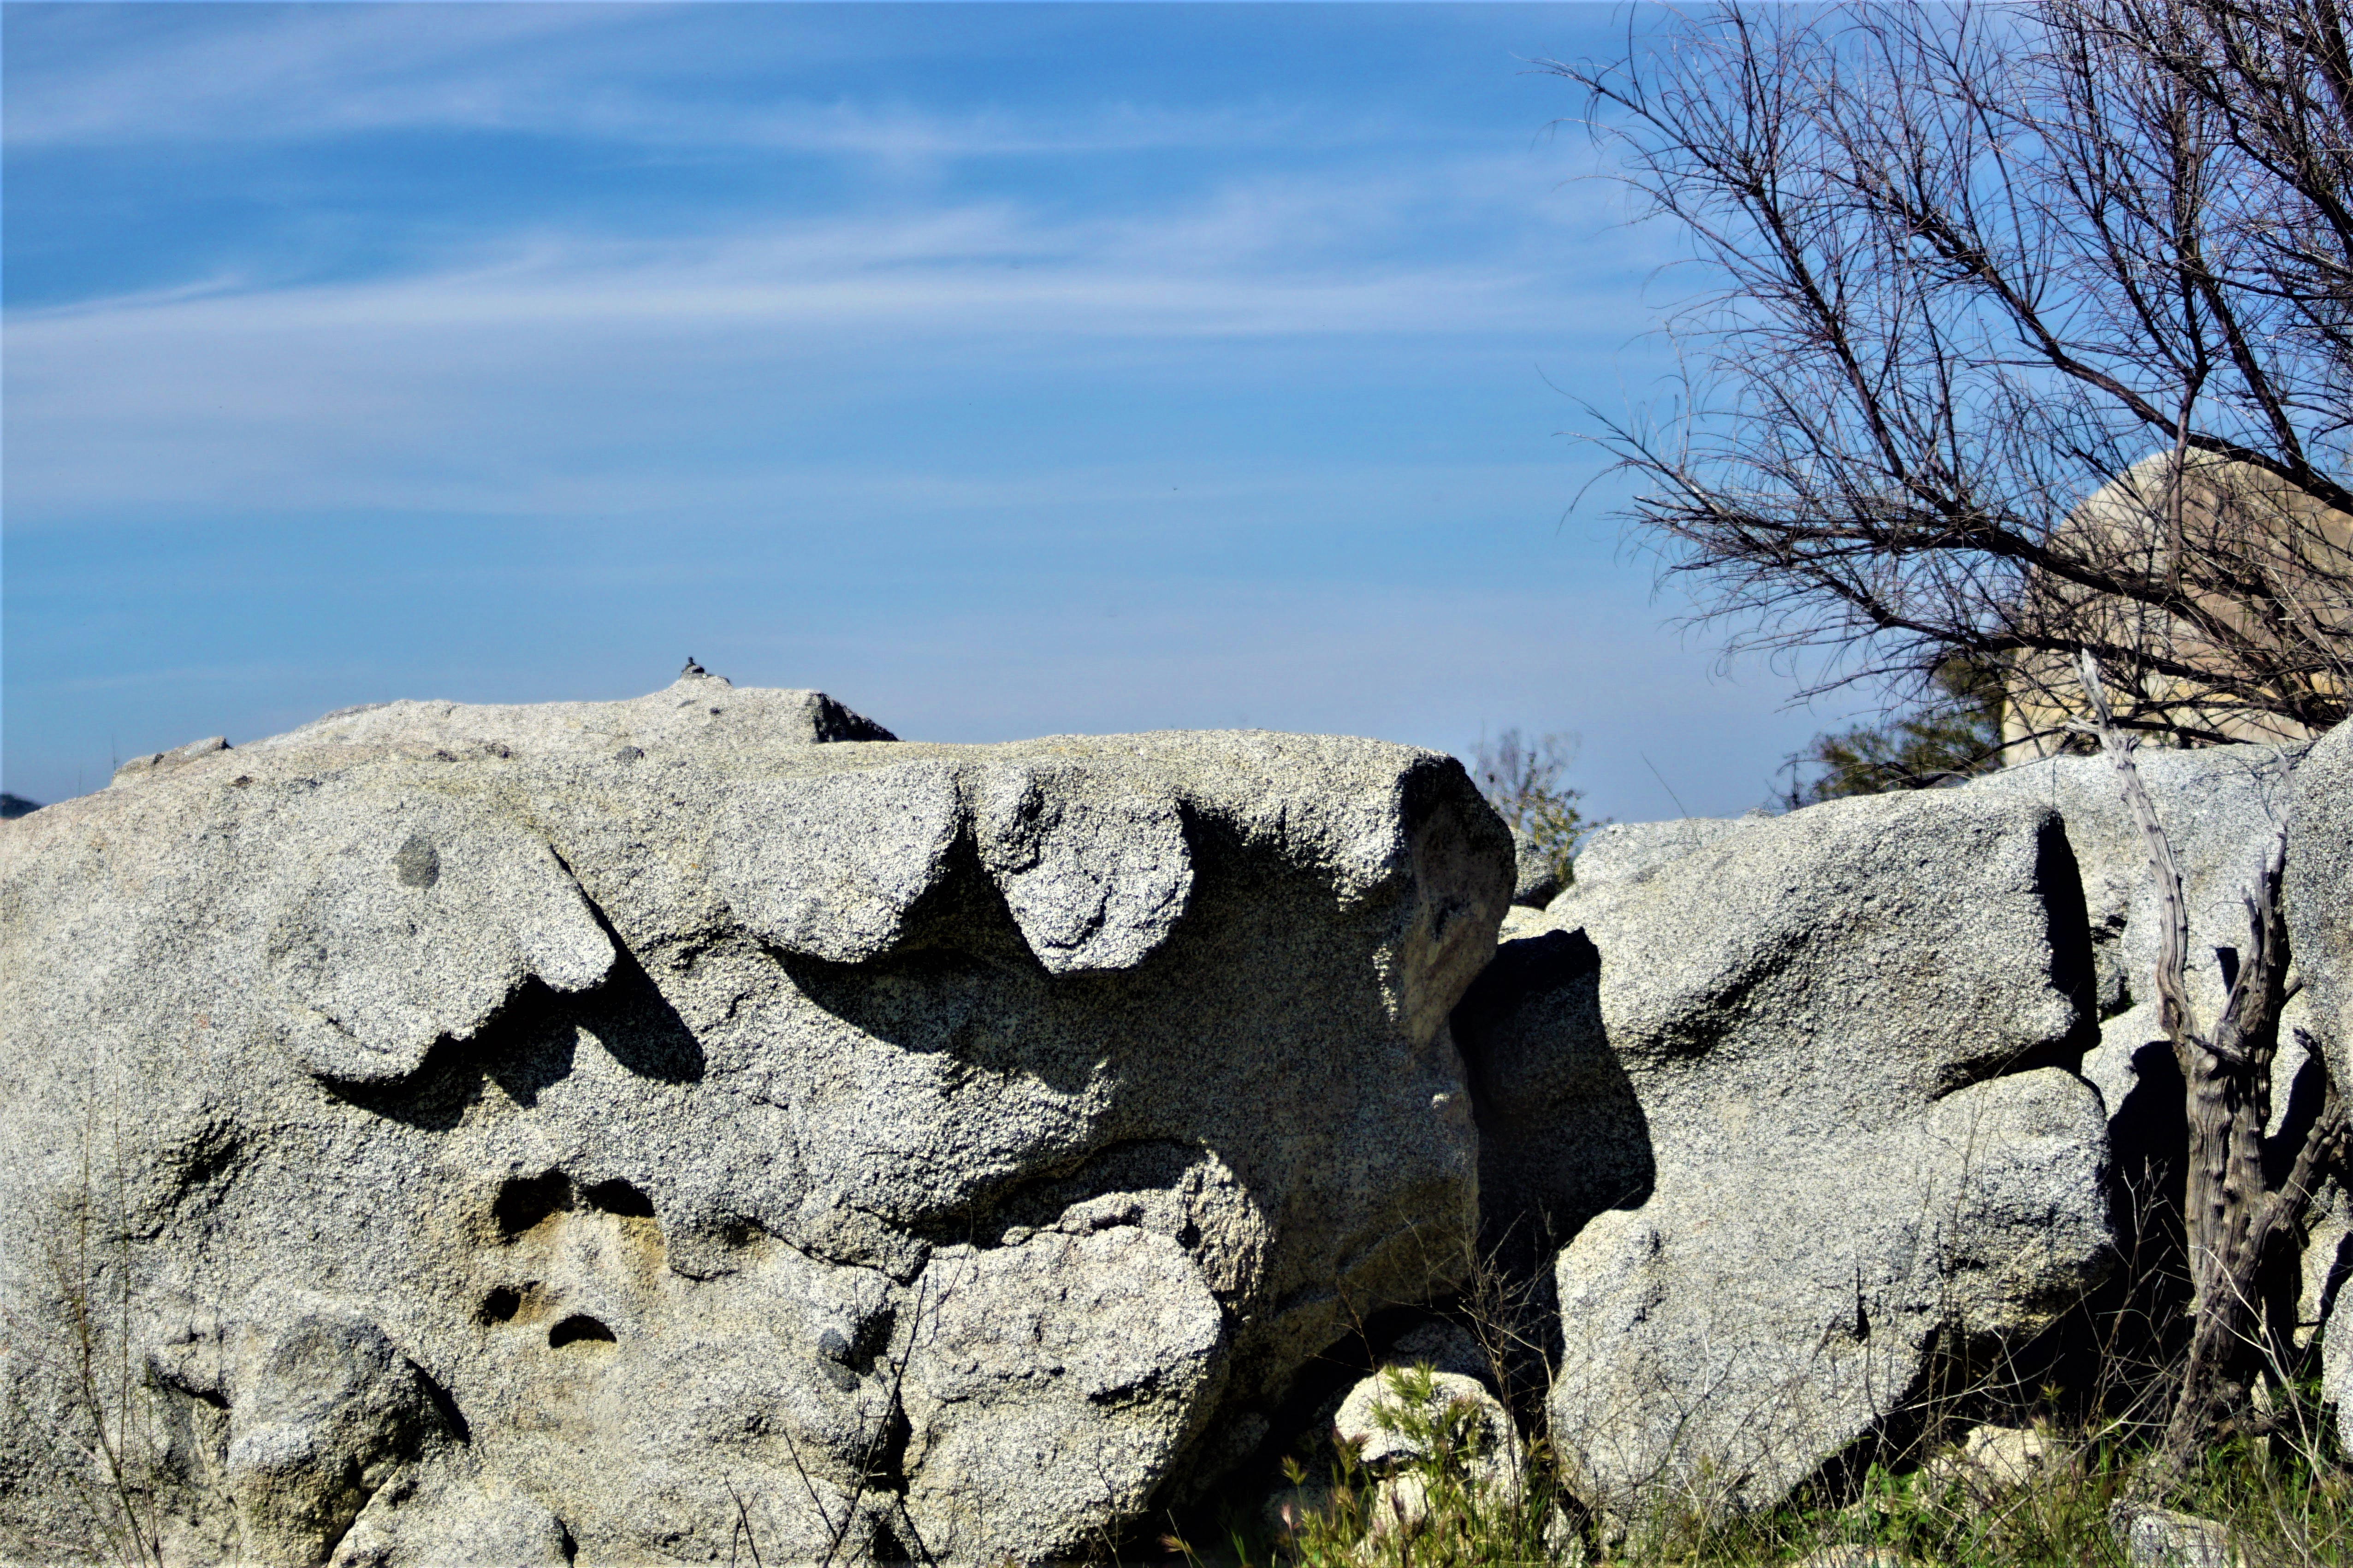
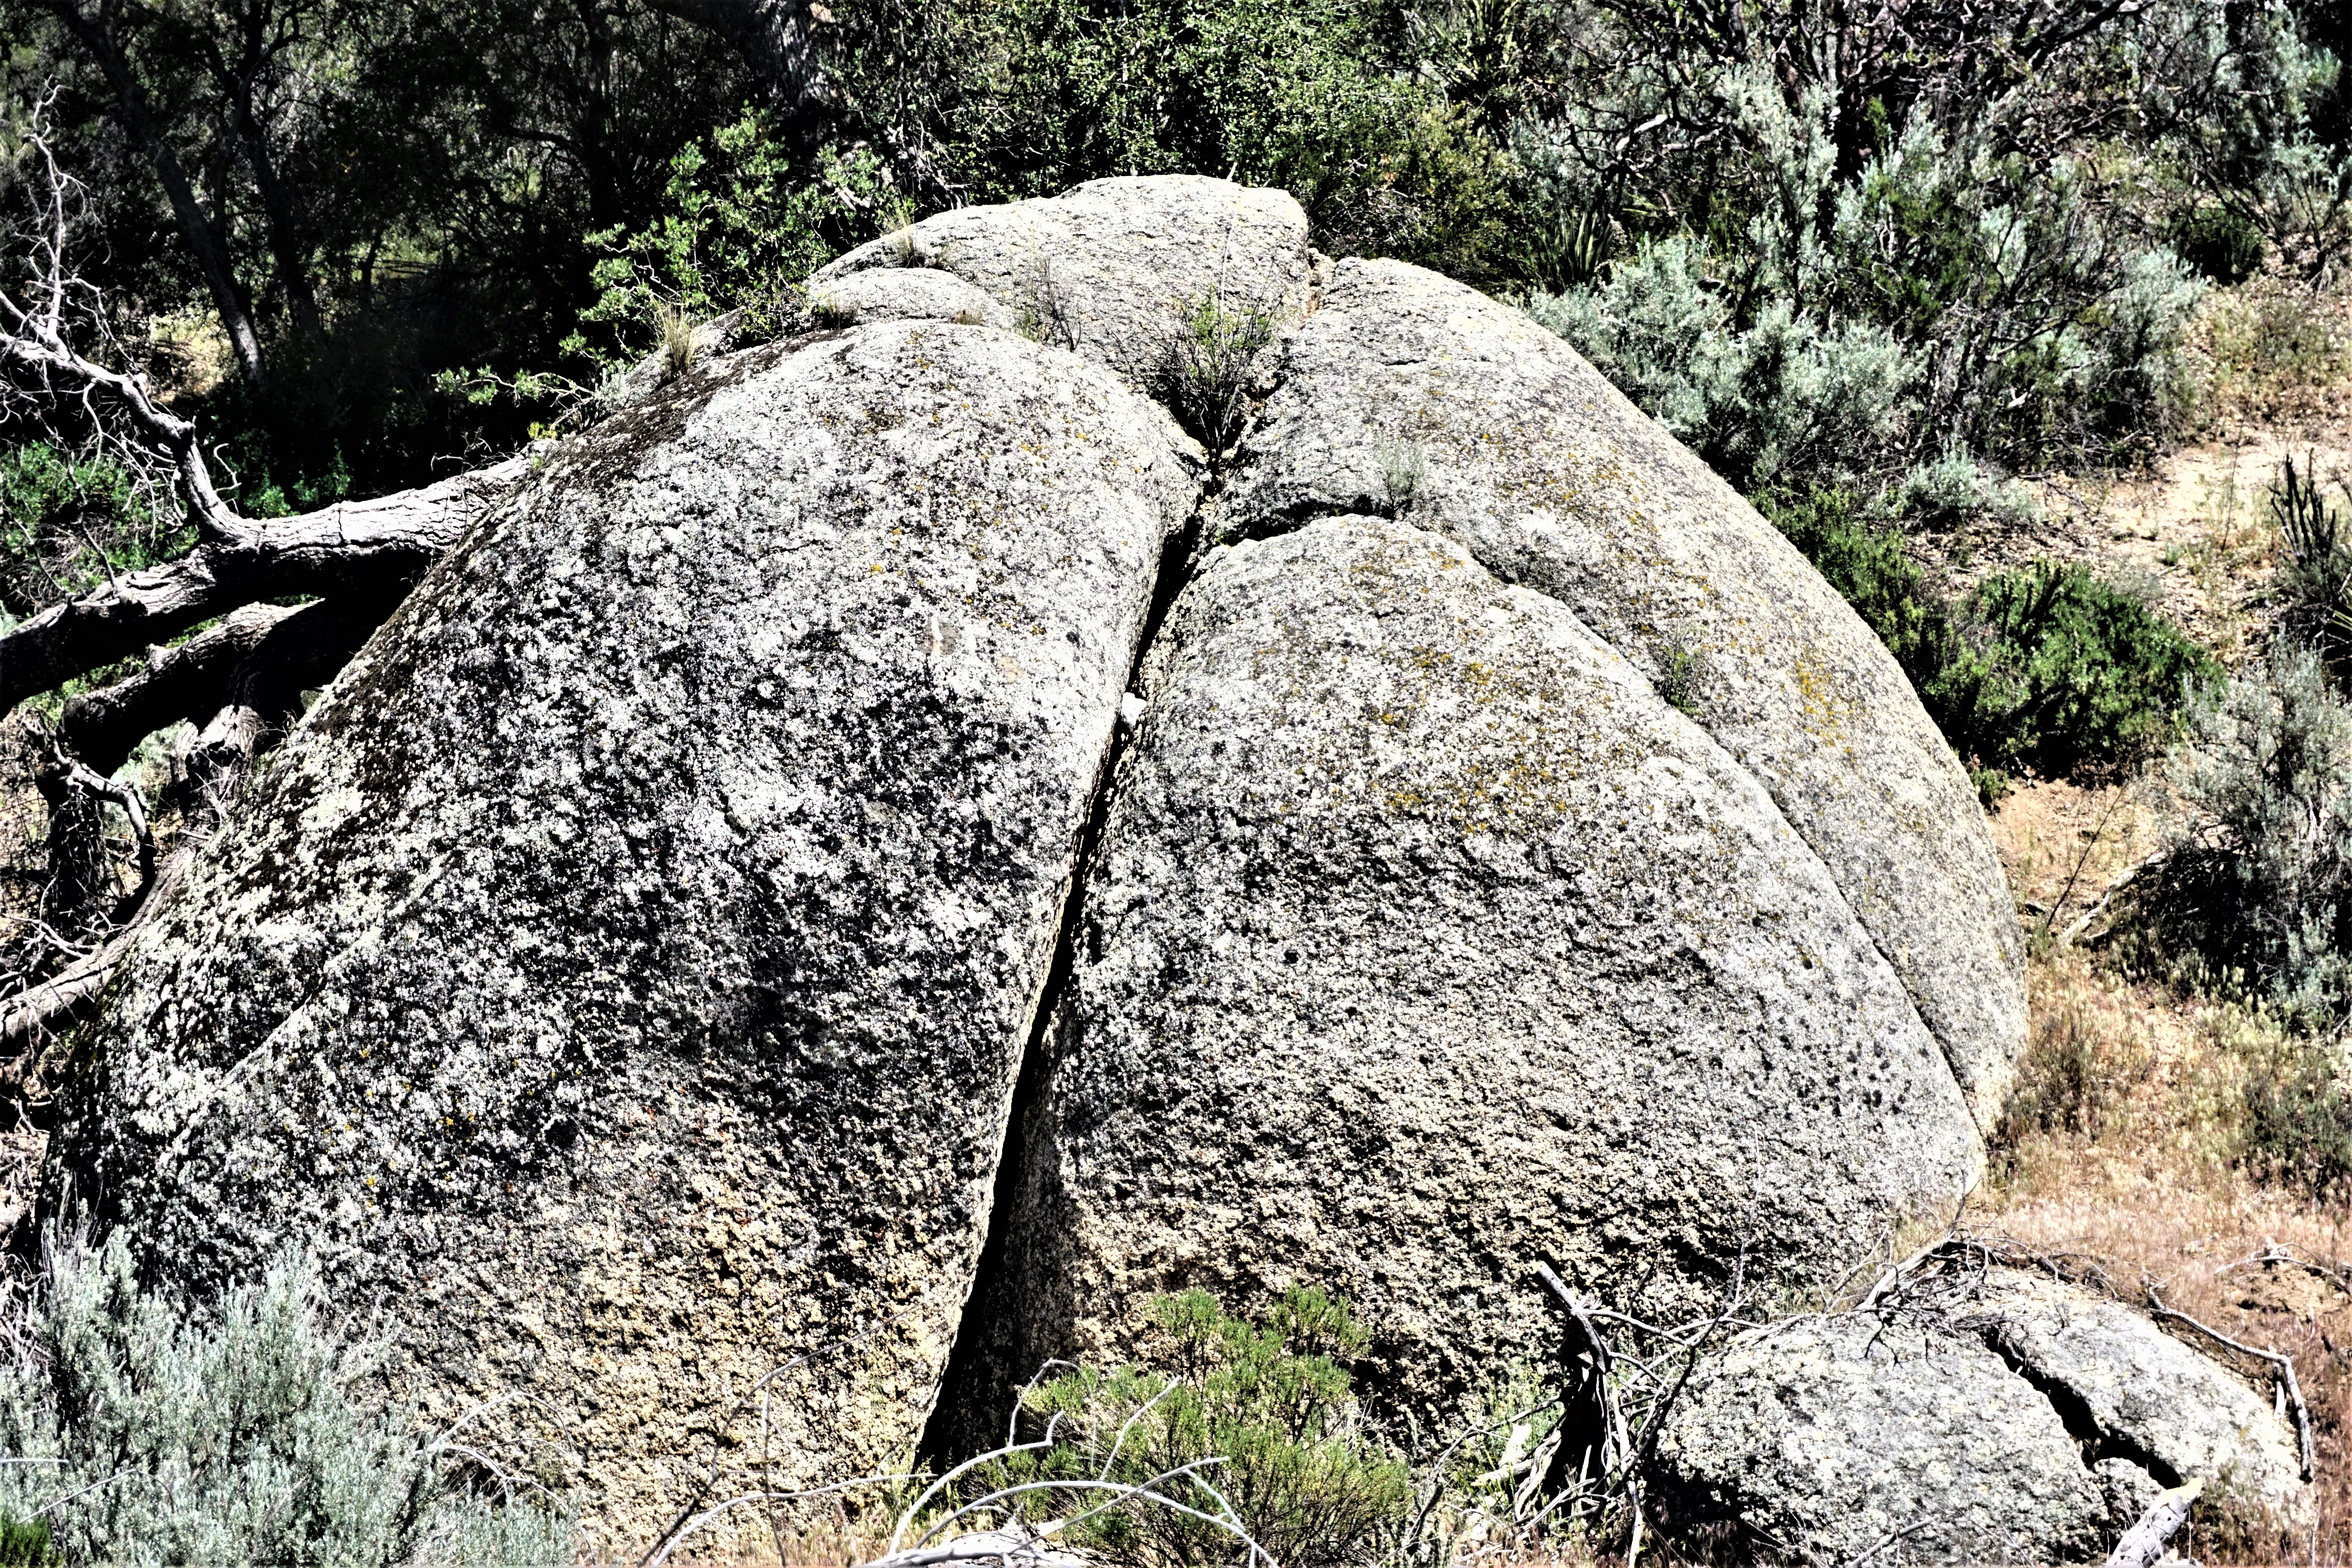
More often, however, one finds clusters of boulders that were once co-joined, like bubbles in a foam. In a foam, bubbles and drops conform to each other, matching shapes across cellular membranes. It’s very obvious the boulders shown in the next set of images are clusters of drops that have dried and fallen apart, leaving matching surfaces where they were co-joined.


Steam and other gasses exited the rock as it cooled. The expansion of gas and steam at the surface contact with atmosphere likely helped cool the surface faster, increasing the surface tension in the skin and causing shrinkage of the drop. As the drop shrank it separated into lobes, which further shrank and broke apart.

Comparing the boulder clusters shown, to the bubble clusters in the next group of images, one sees the same polygonal interfaces, the same segmenting and interstitial bubbles wedged between larger bubbles. The only difference shape-wise is that boulders are solidified drops, not bubbles, and they shrank as they dried causing segmented lobes to separate and fall apart.


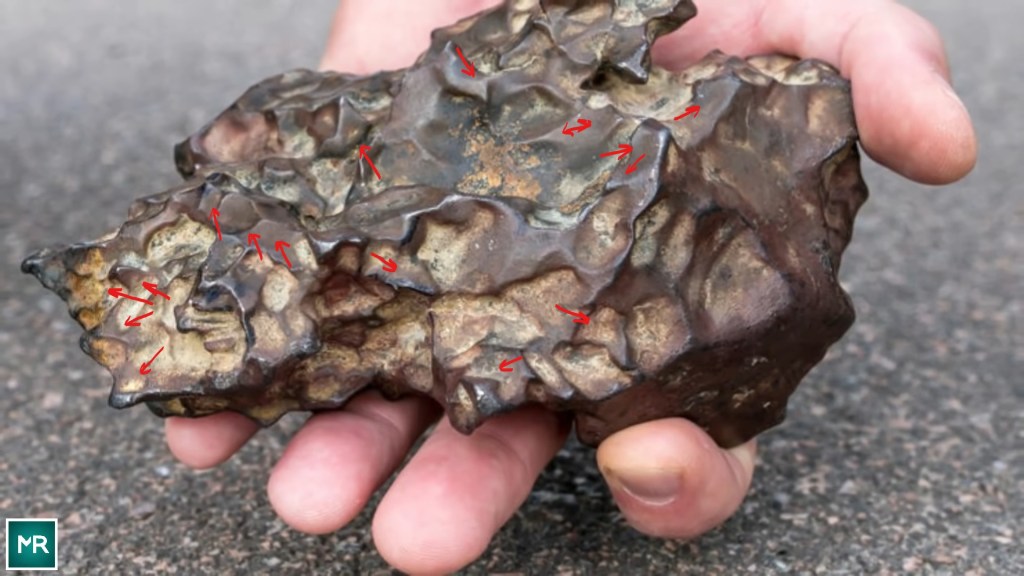
When bubbles and drops cluster, those on the interior of the cluster tend to be polygonal shapes. Because the internal pressure between co-joined cells in a cluster is more, or less equalized, internal membrane walls experience no pressure differential and are flat. Outer cells in the cluster, however have a differential between interior pressure and the atmosphere, and therefore bulge. That is exactly how these boulder clusters are structured.
If one makes a symmetrical cluster of five equal bubbles, the one inside the other four will be a perfect cube. There are several examples of polygonal bubbles in the images shown. Singular boulders tend to be rounded, while boulders in clusters tend to be polygonal, especially the ones in the cluster centers.


The squared shapes and flat surfaces between boulders is proof they formed as drops in the atmosphere. This granite has no “grain” oriented in a certain direction, or any other internal structure that would cause them to break in a particular way as a result of earthquake or erosion. The only explanation presented by physics is if these rocks were clustered drops. A child can make a perfect square with soap bubbles. I challenge any PhD to do so with erosion.
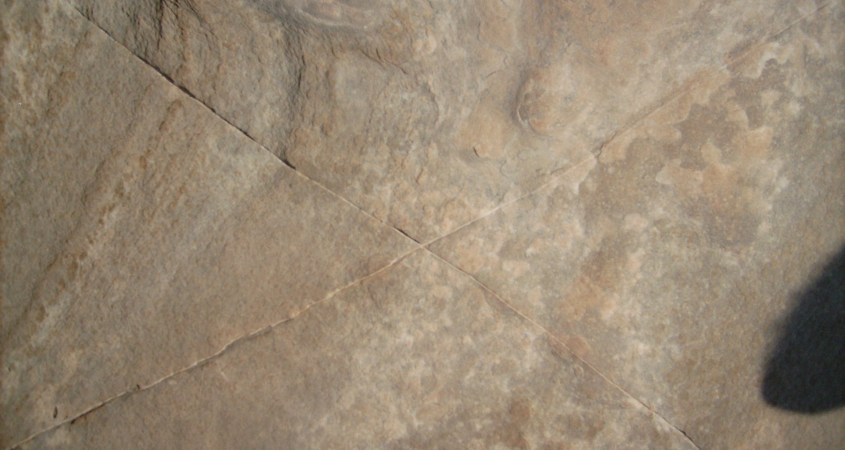
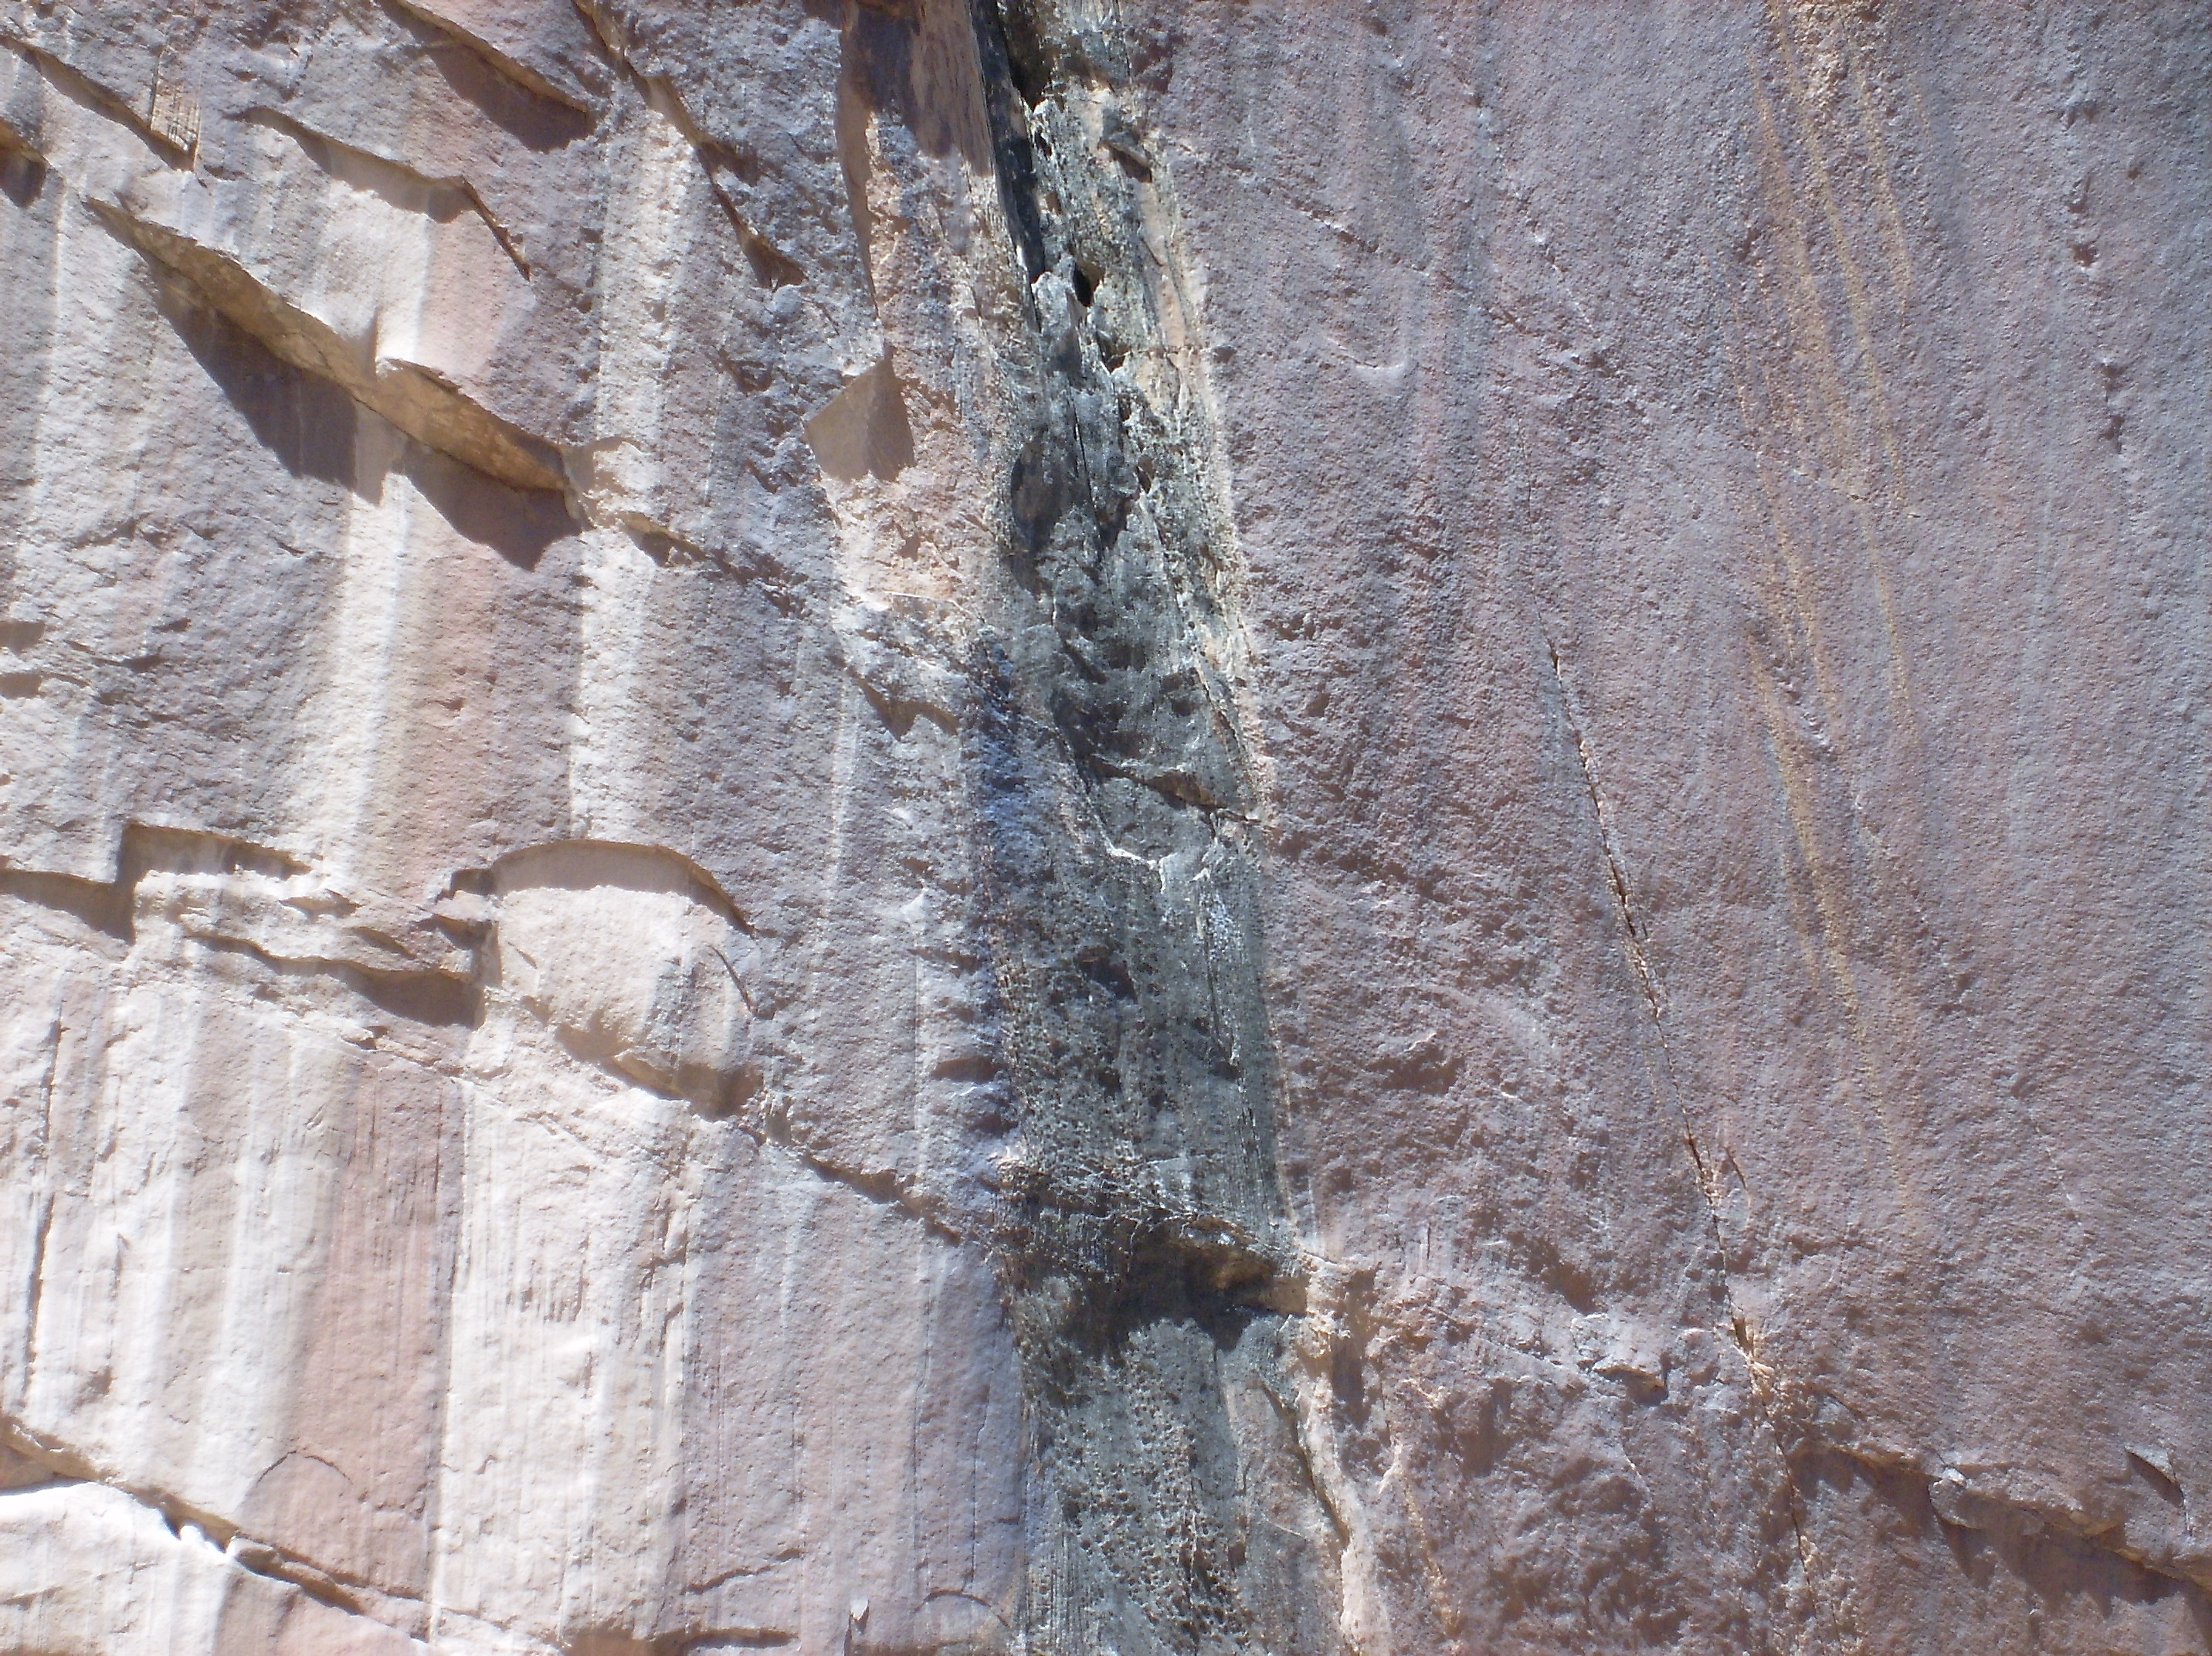
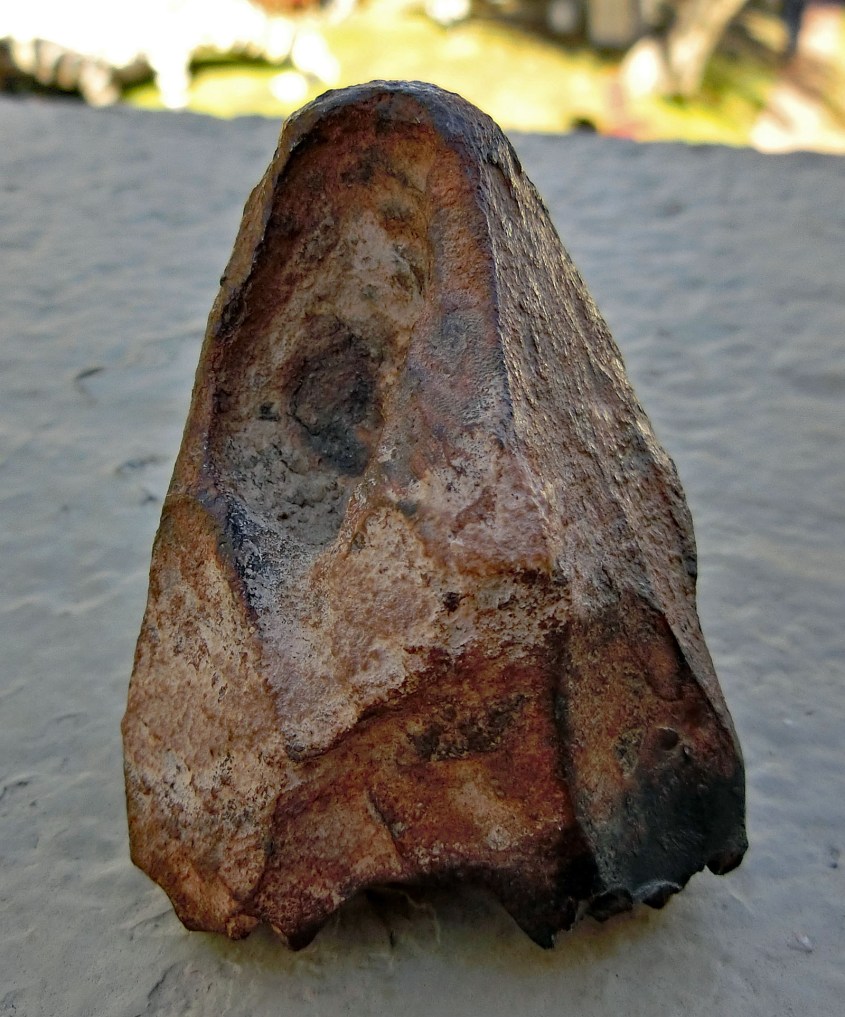
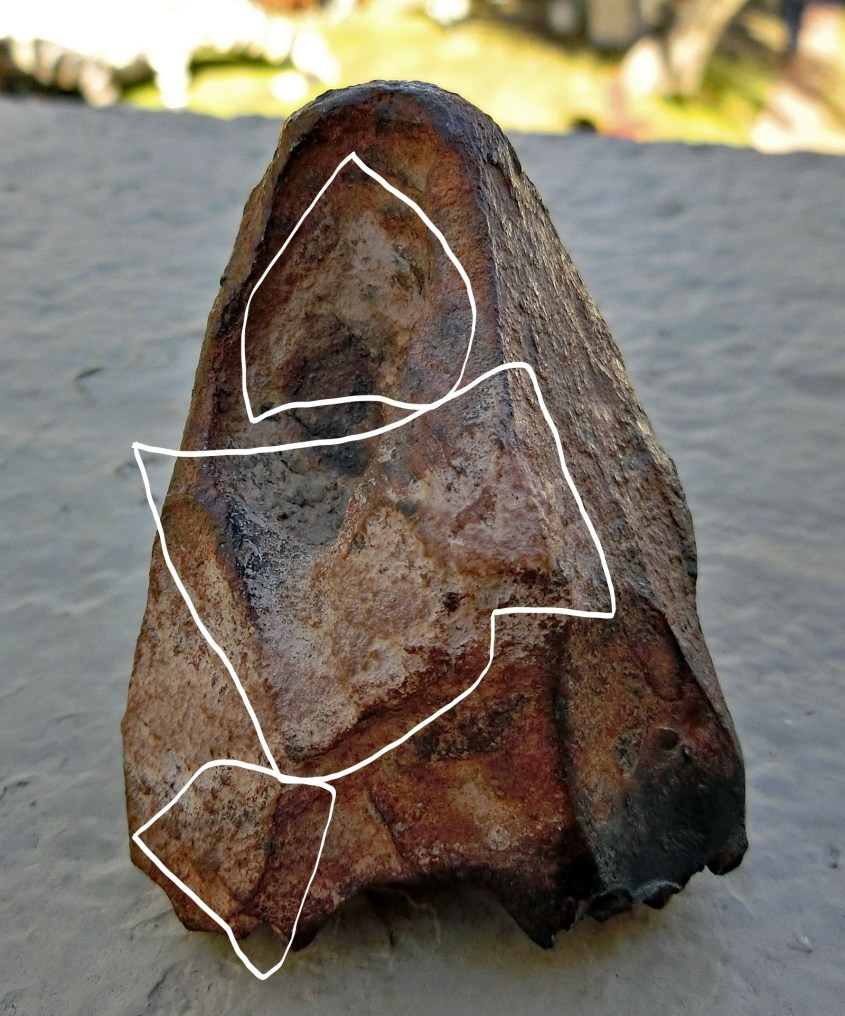
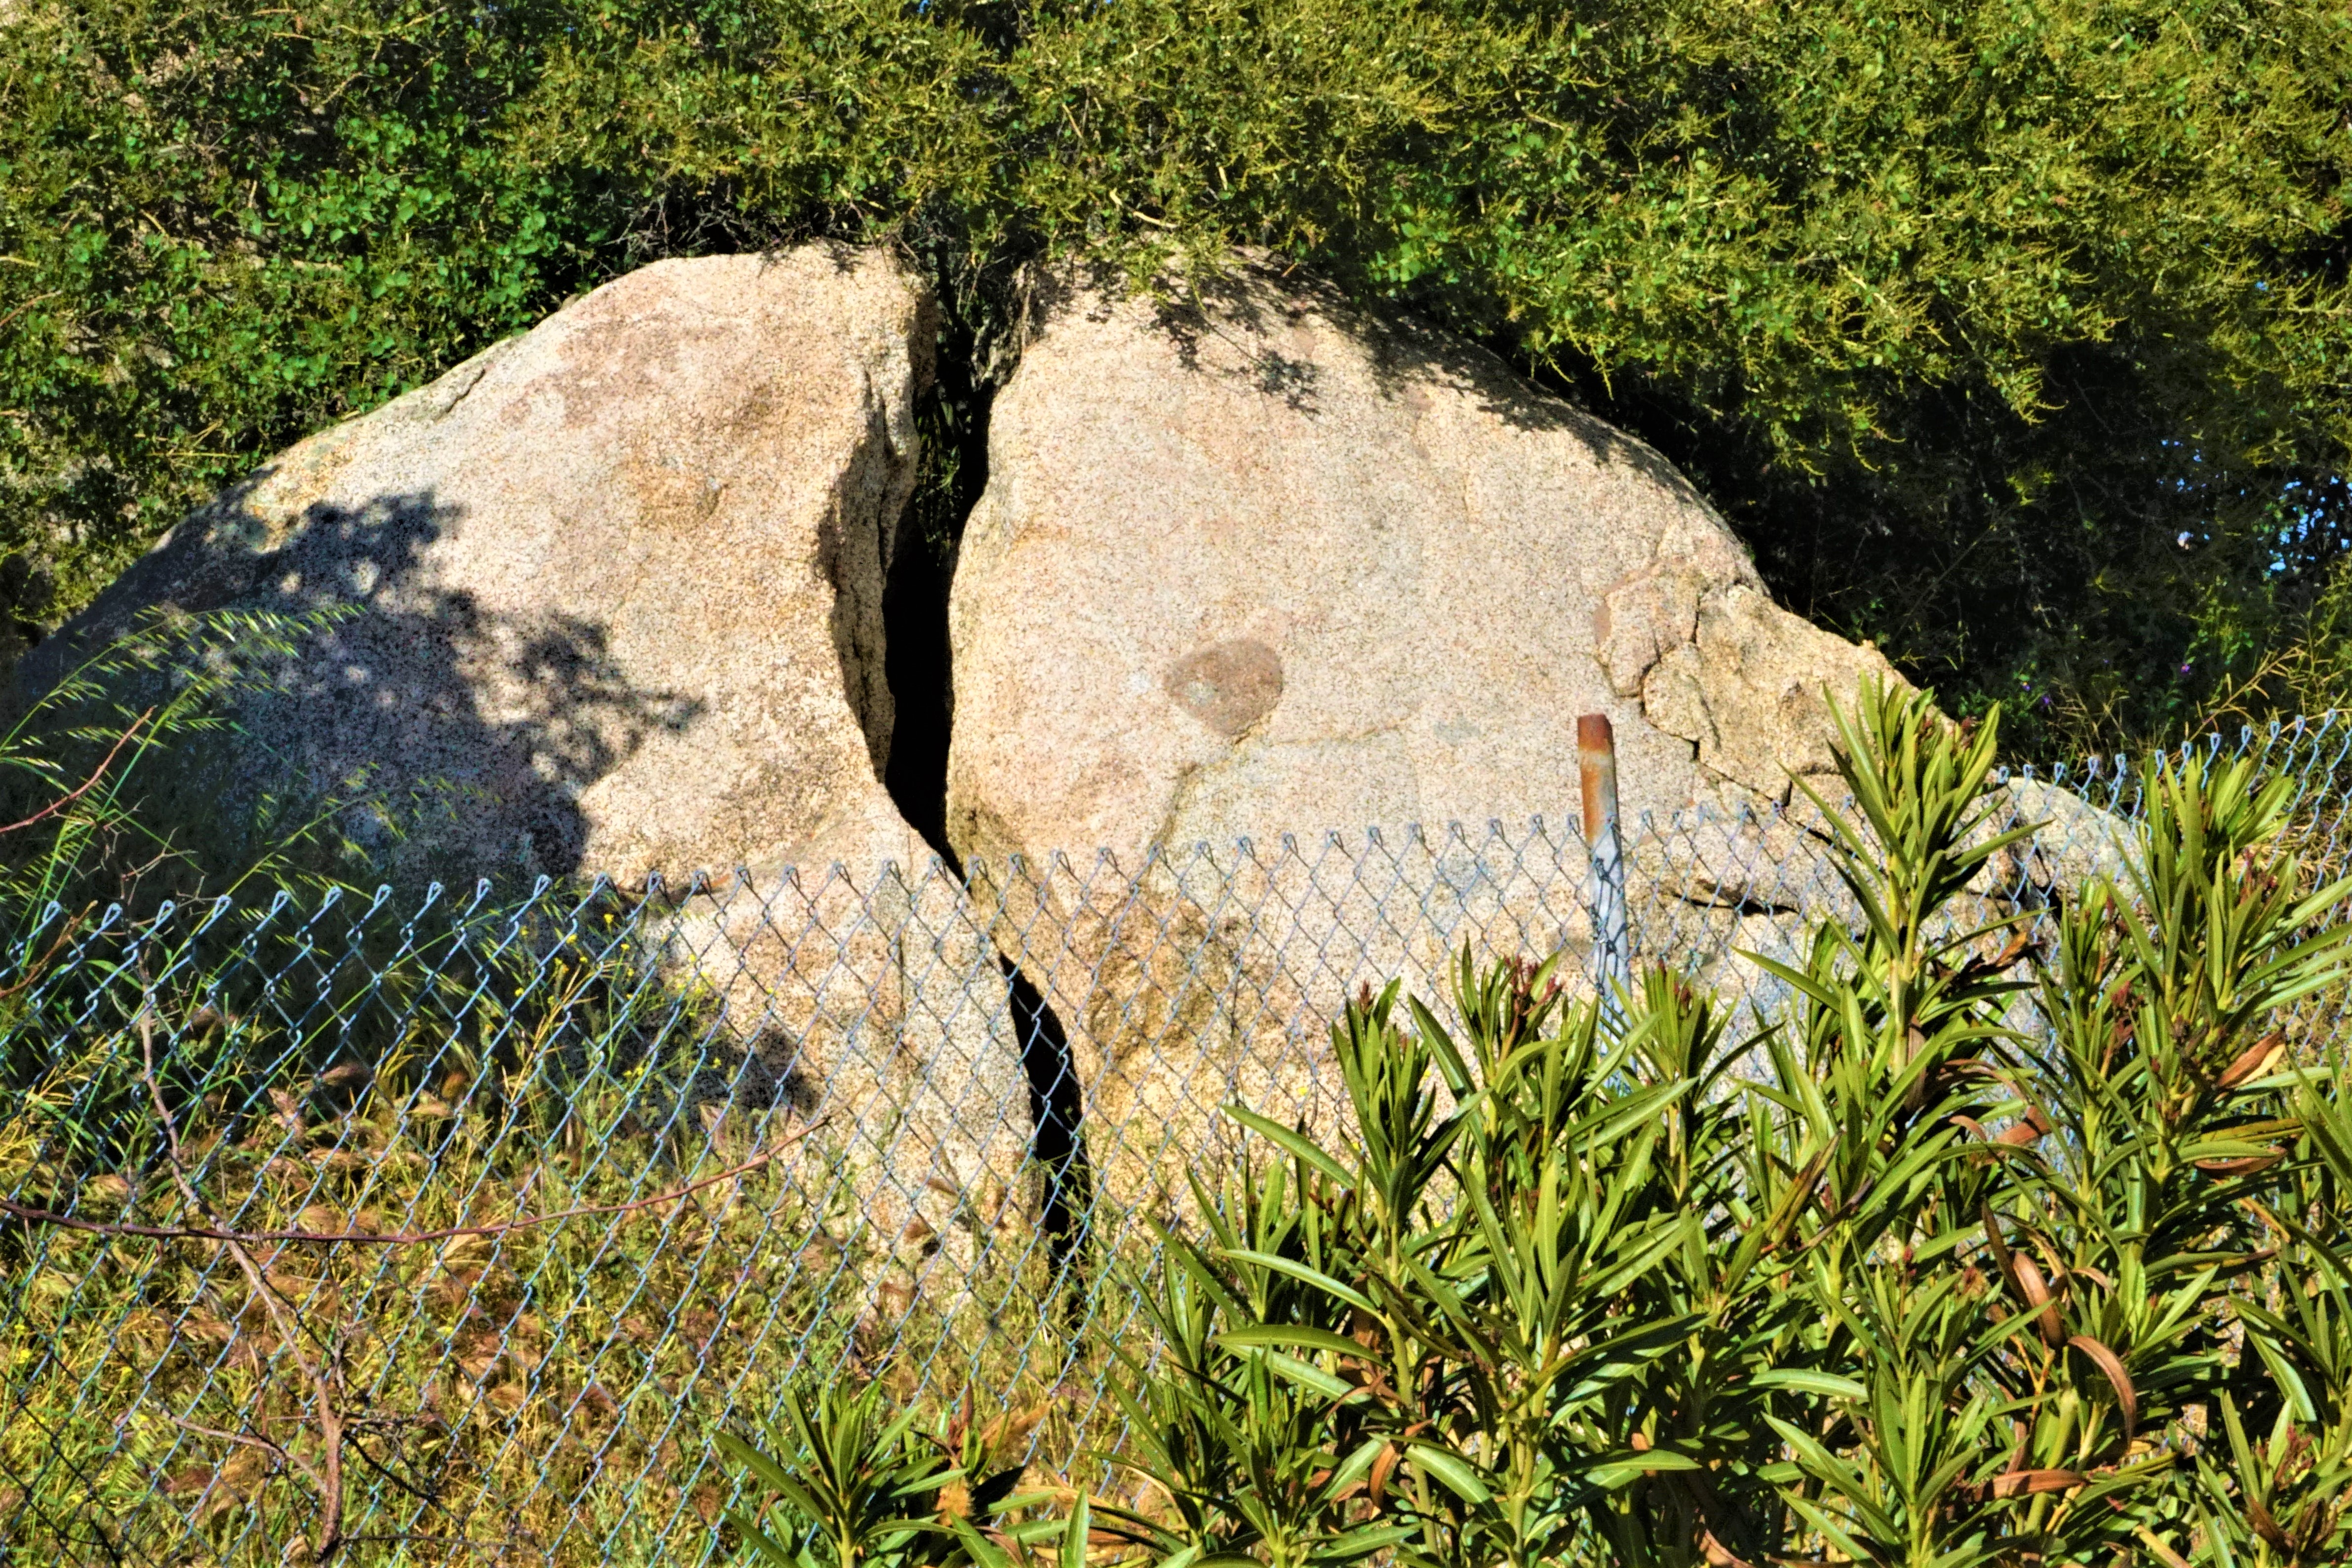
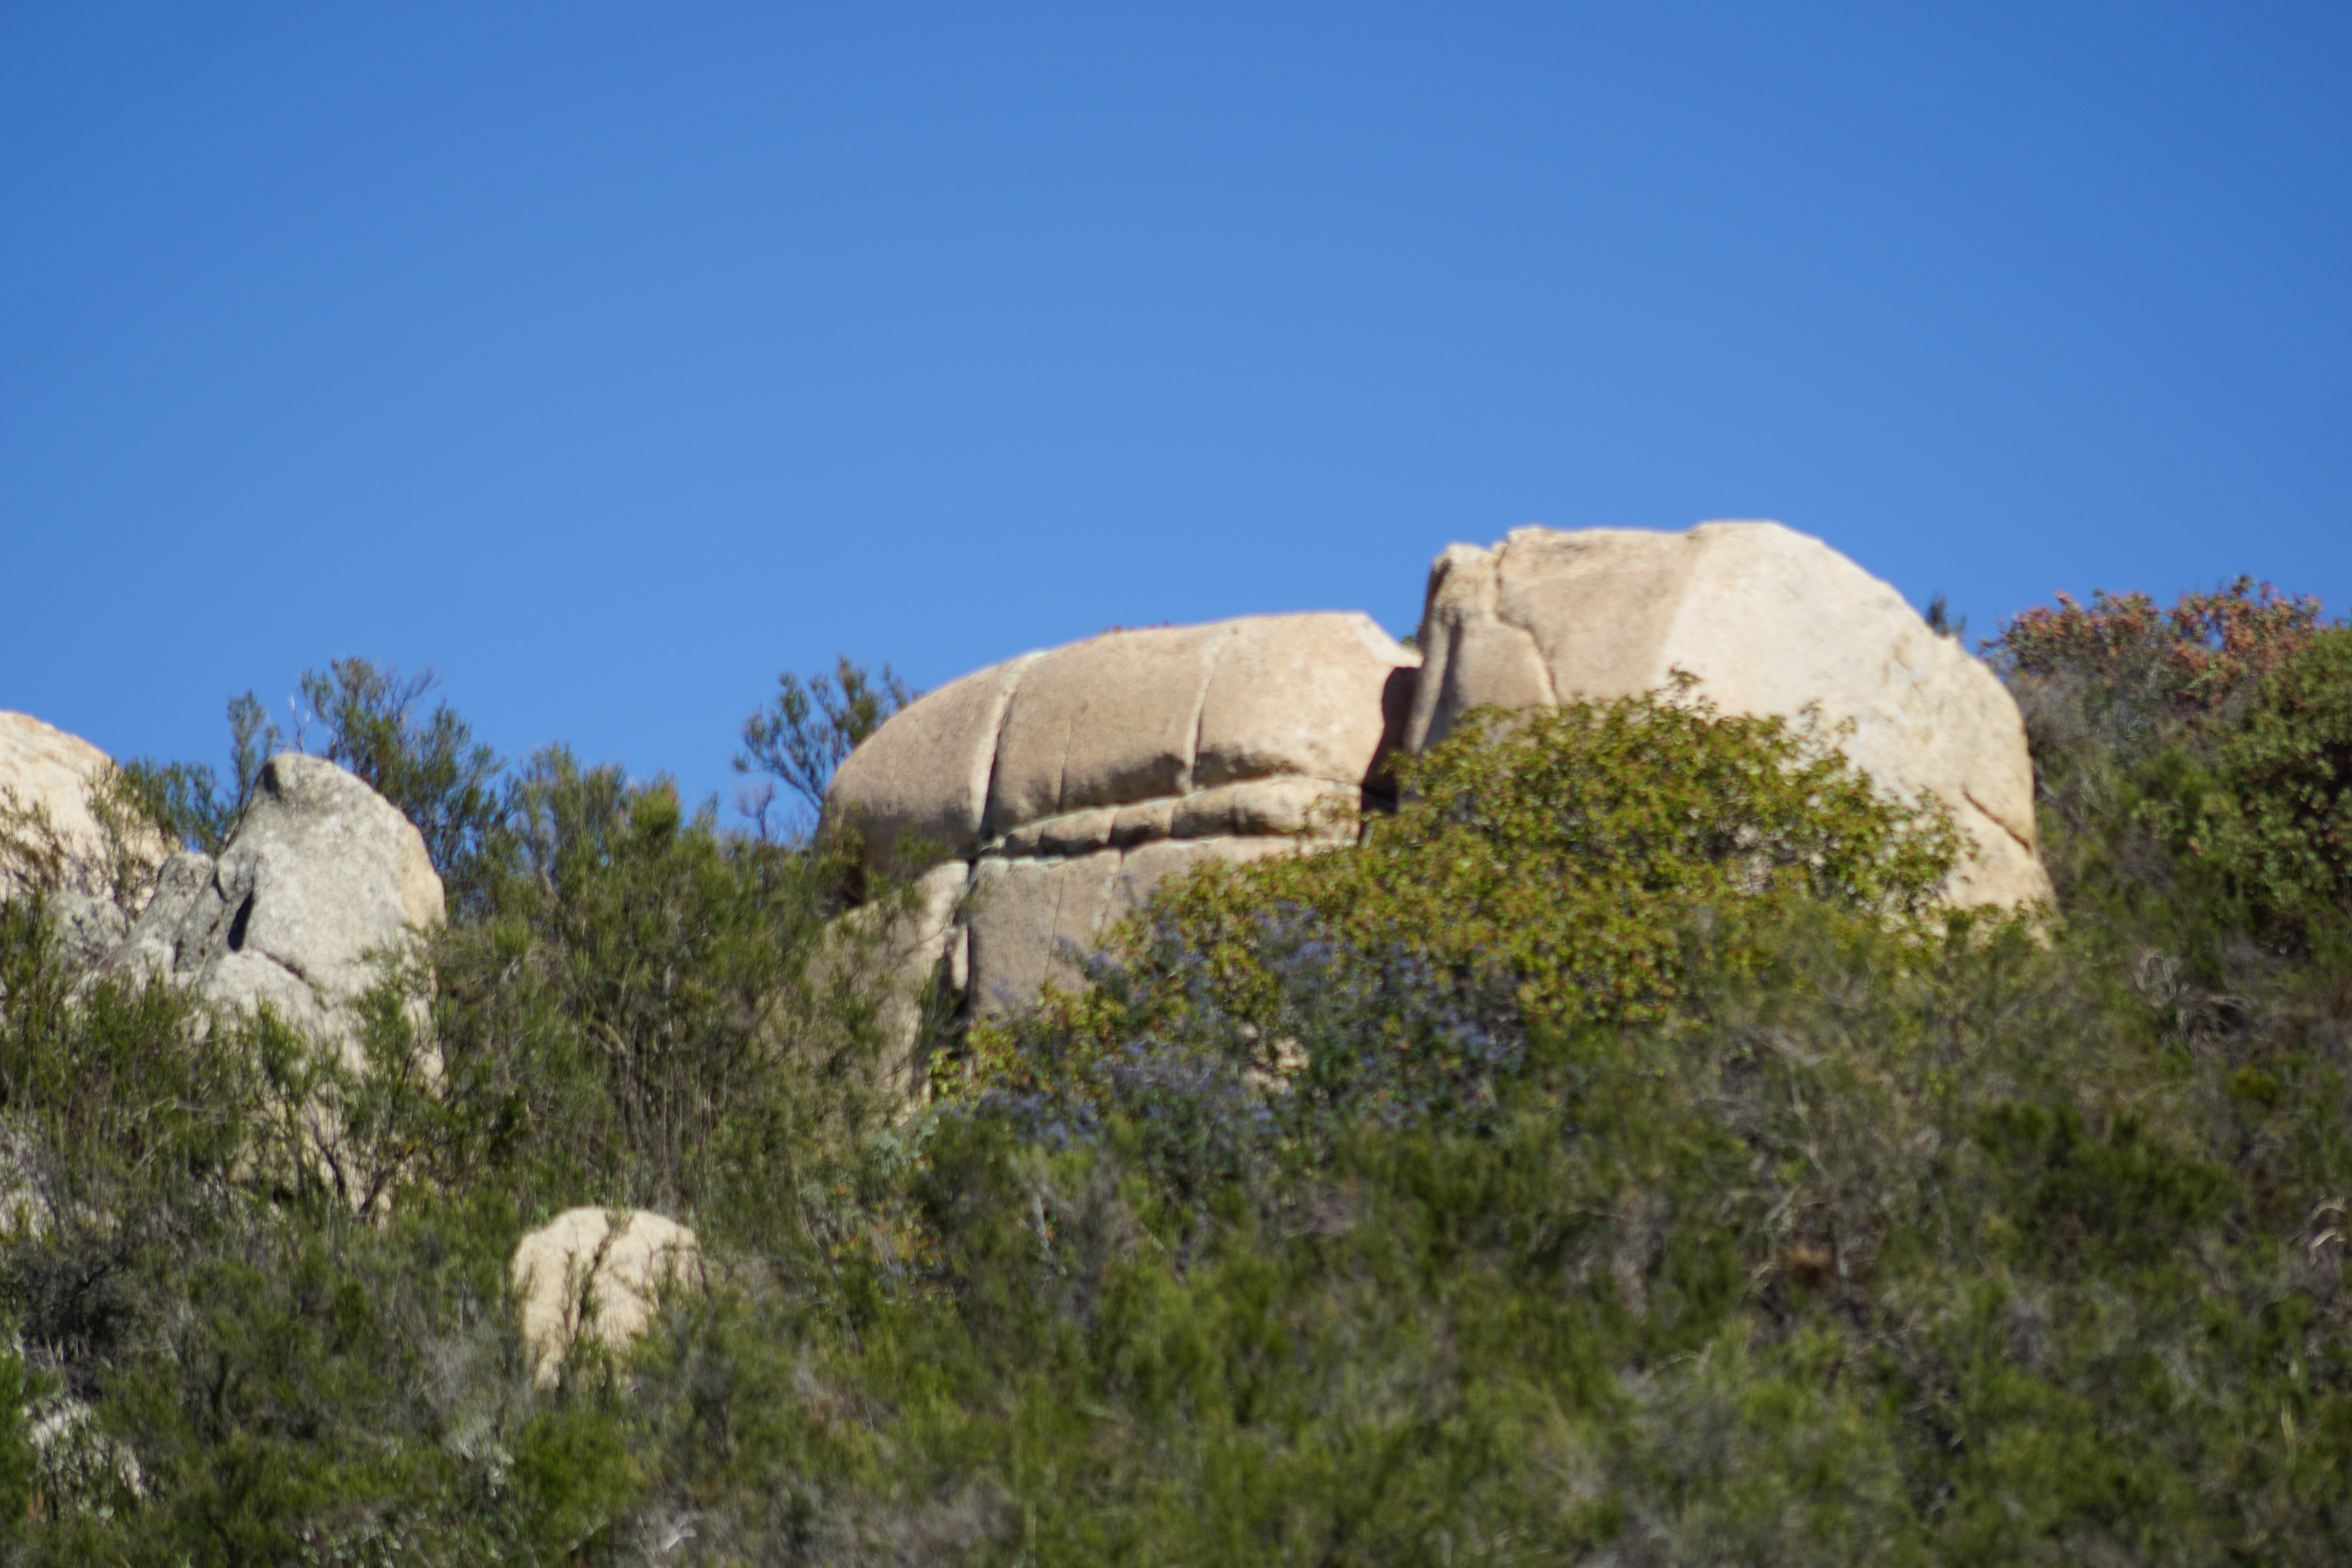
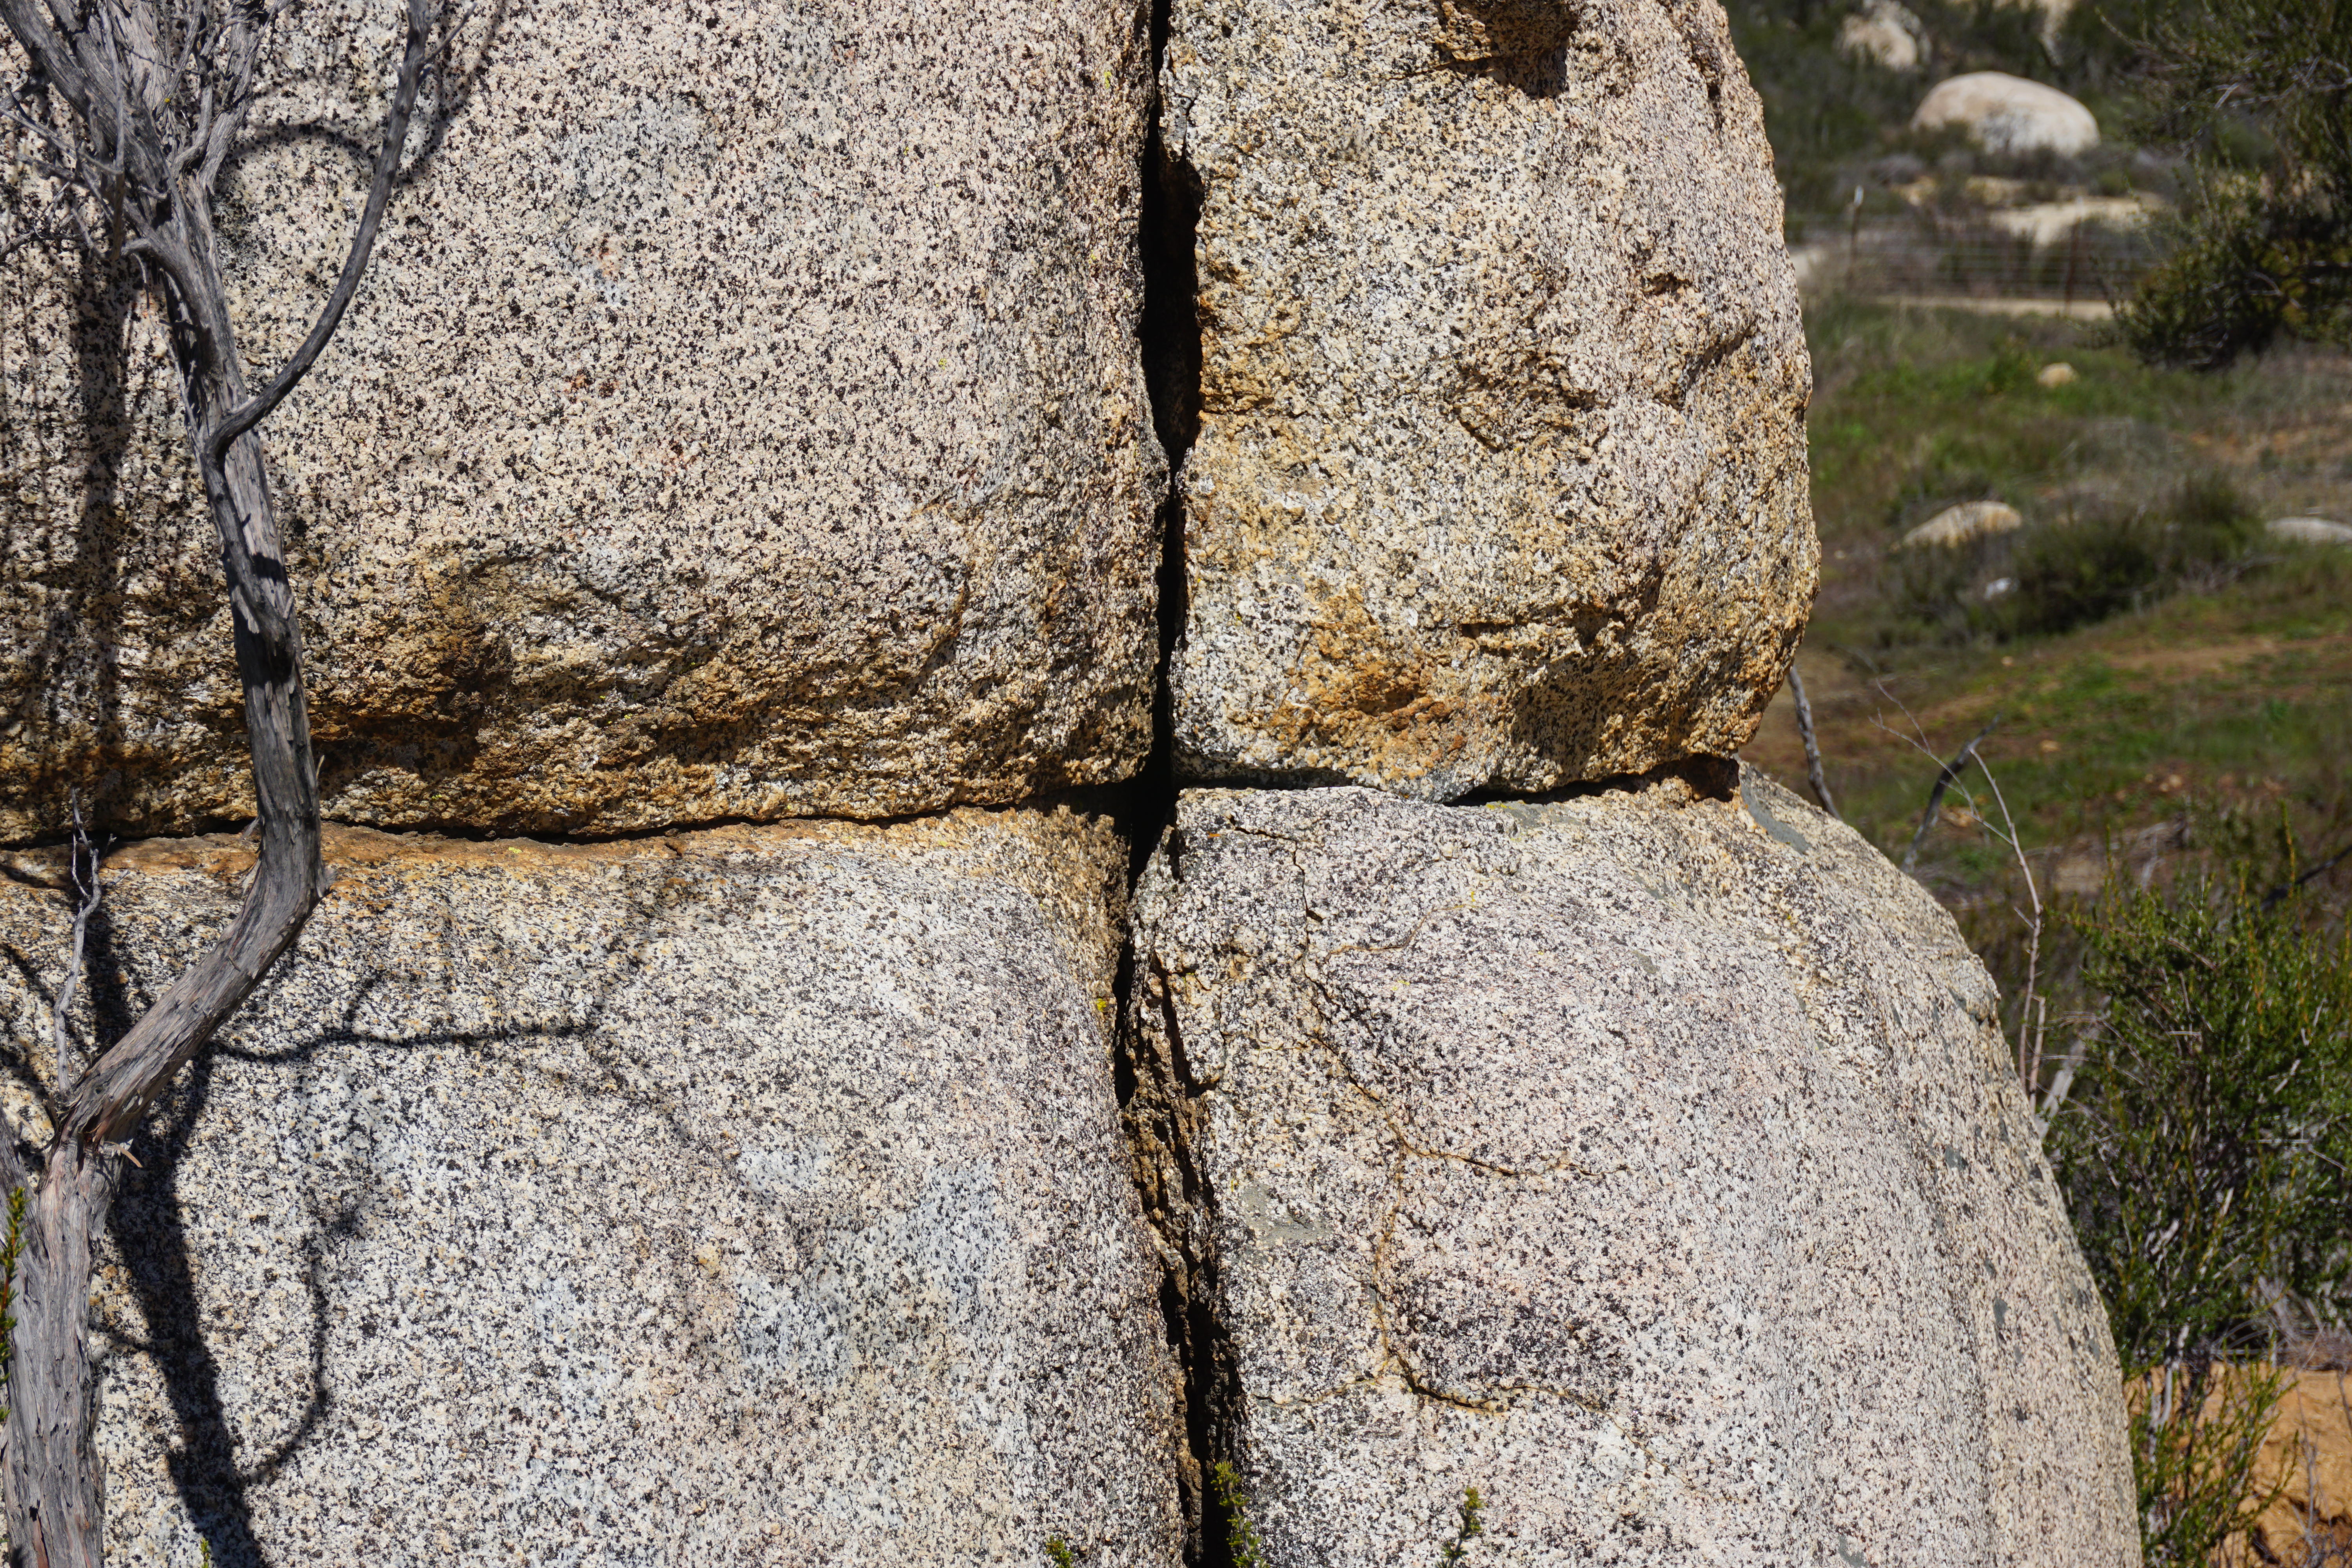
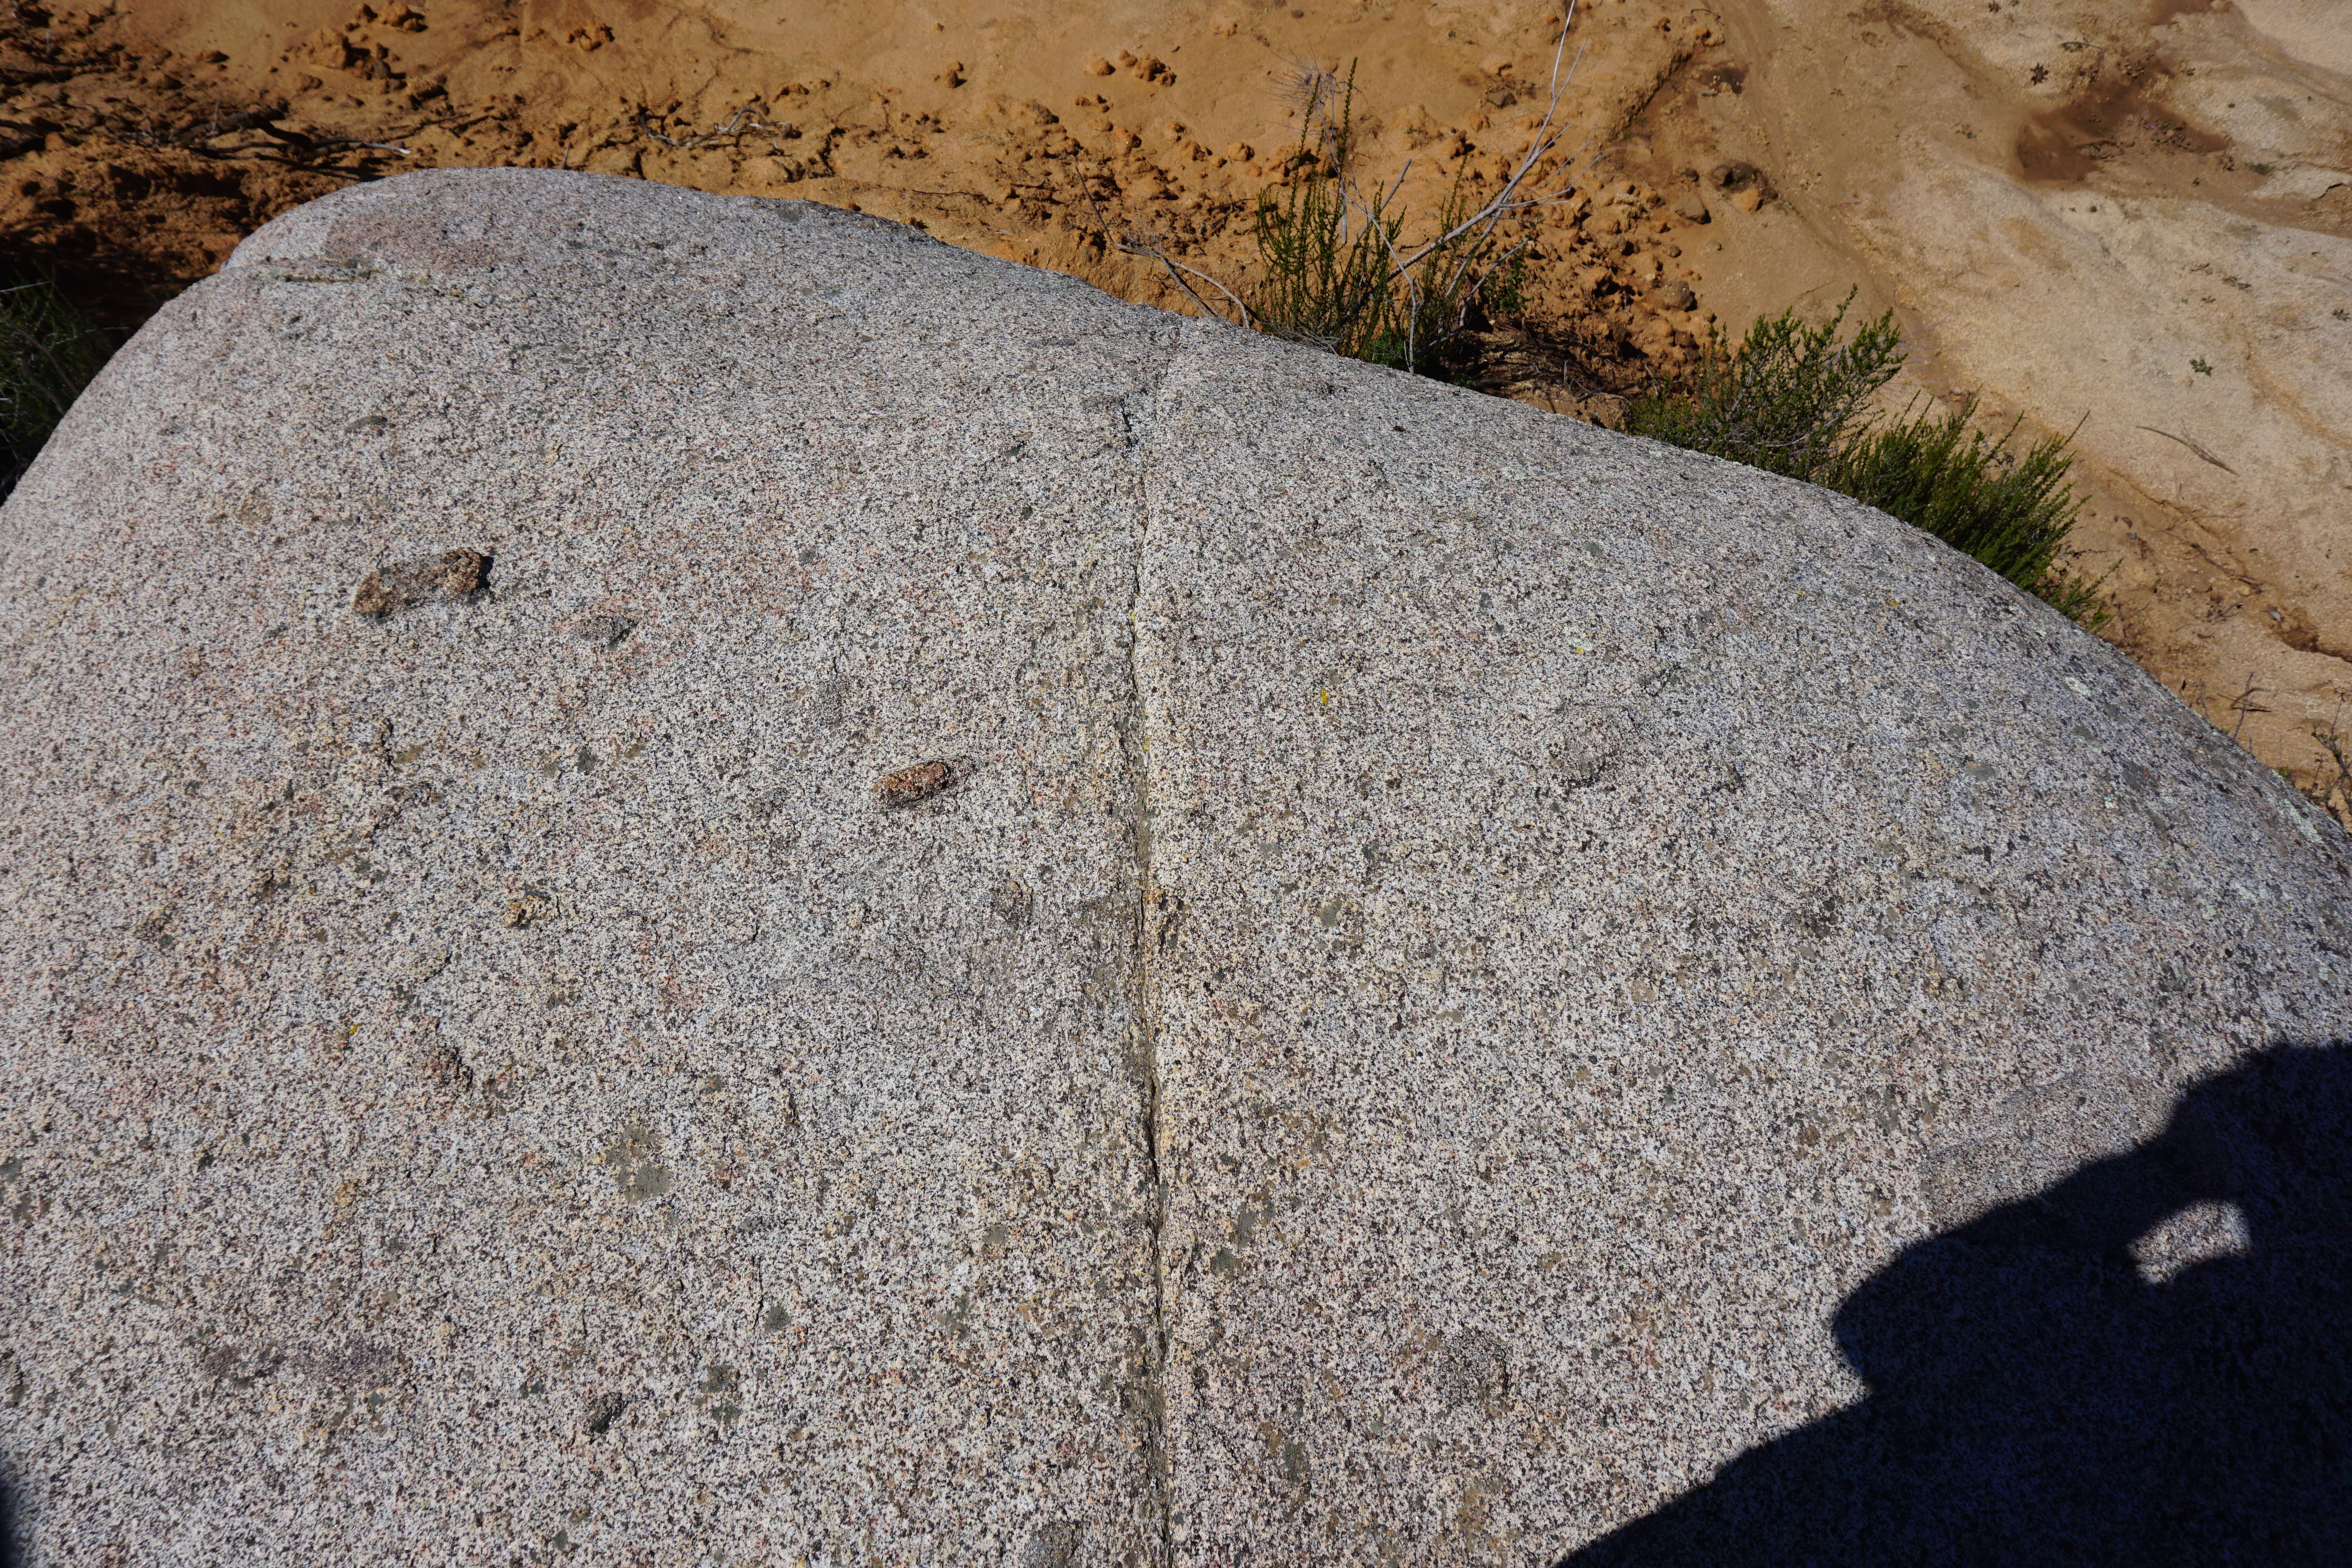
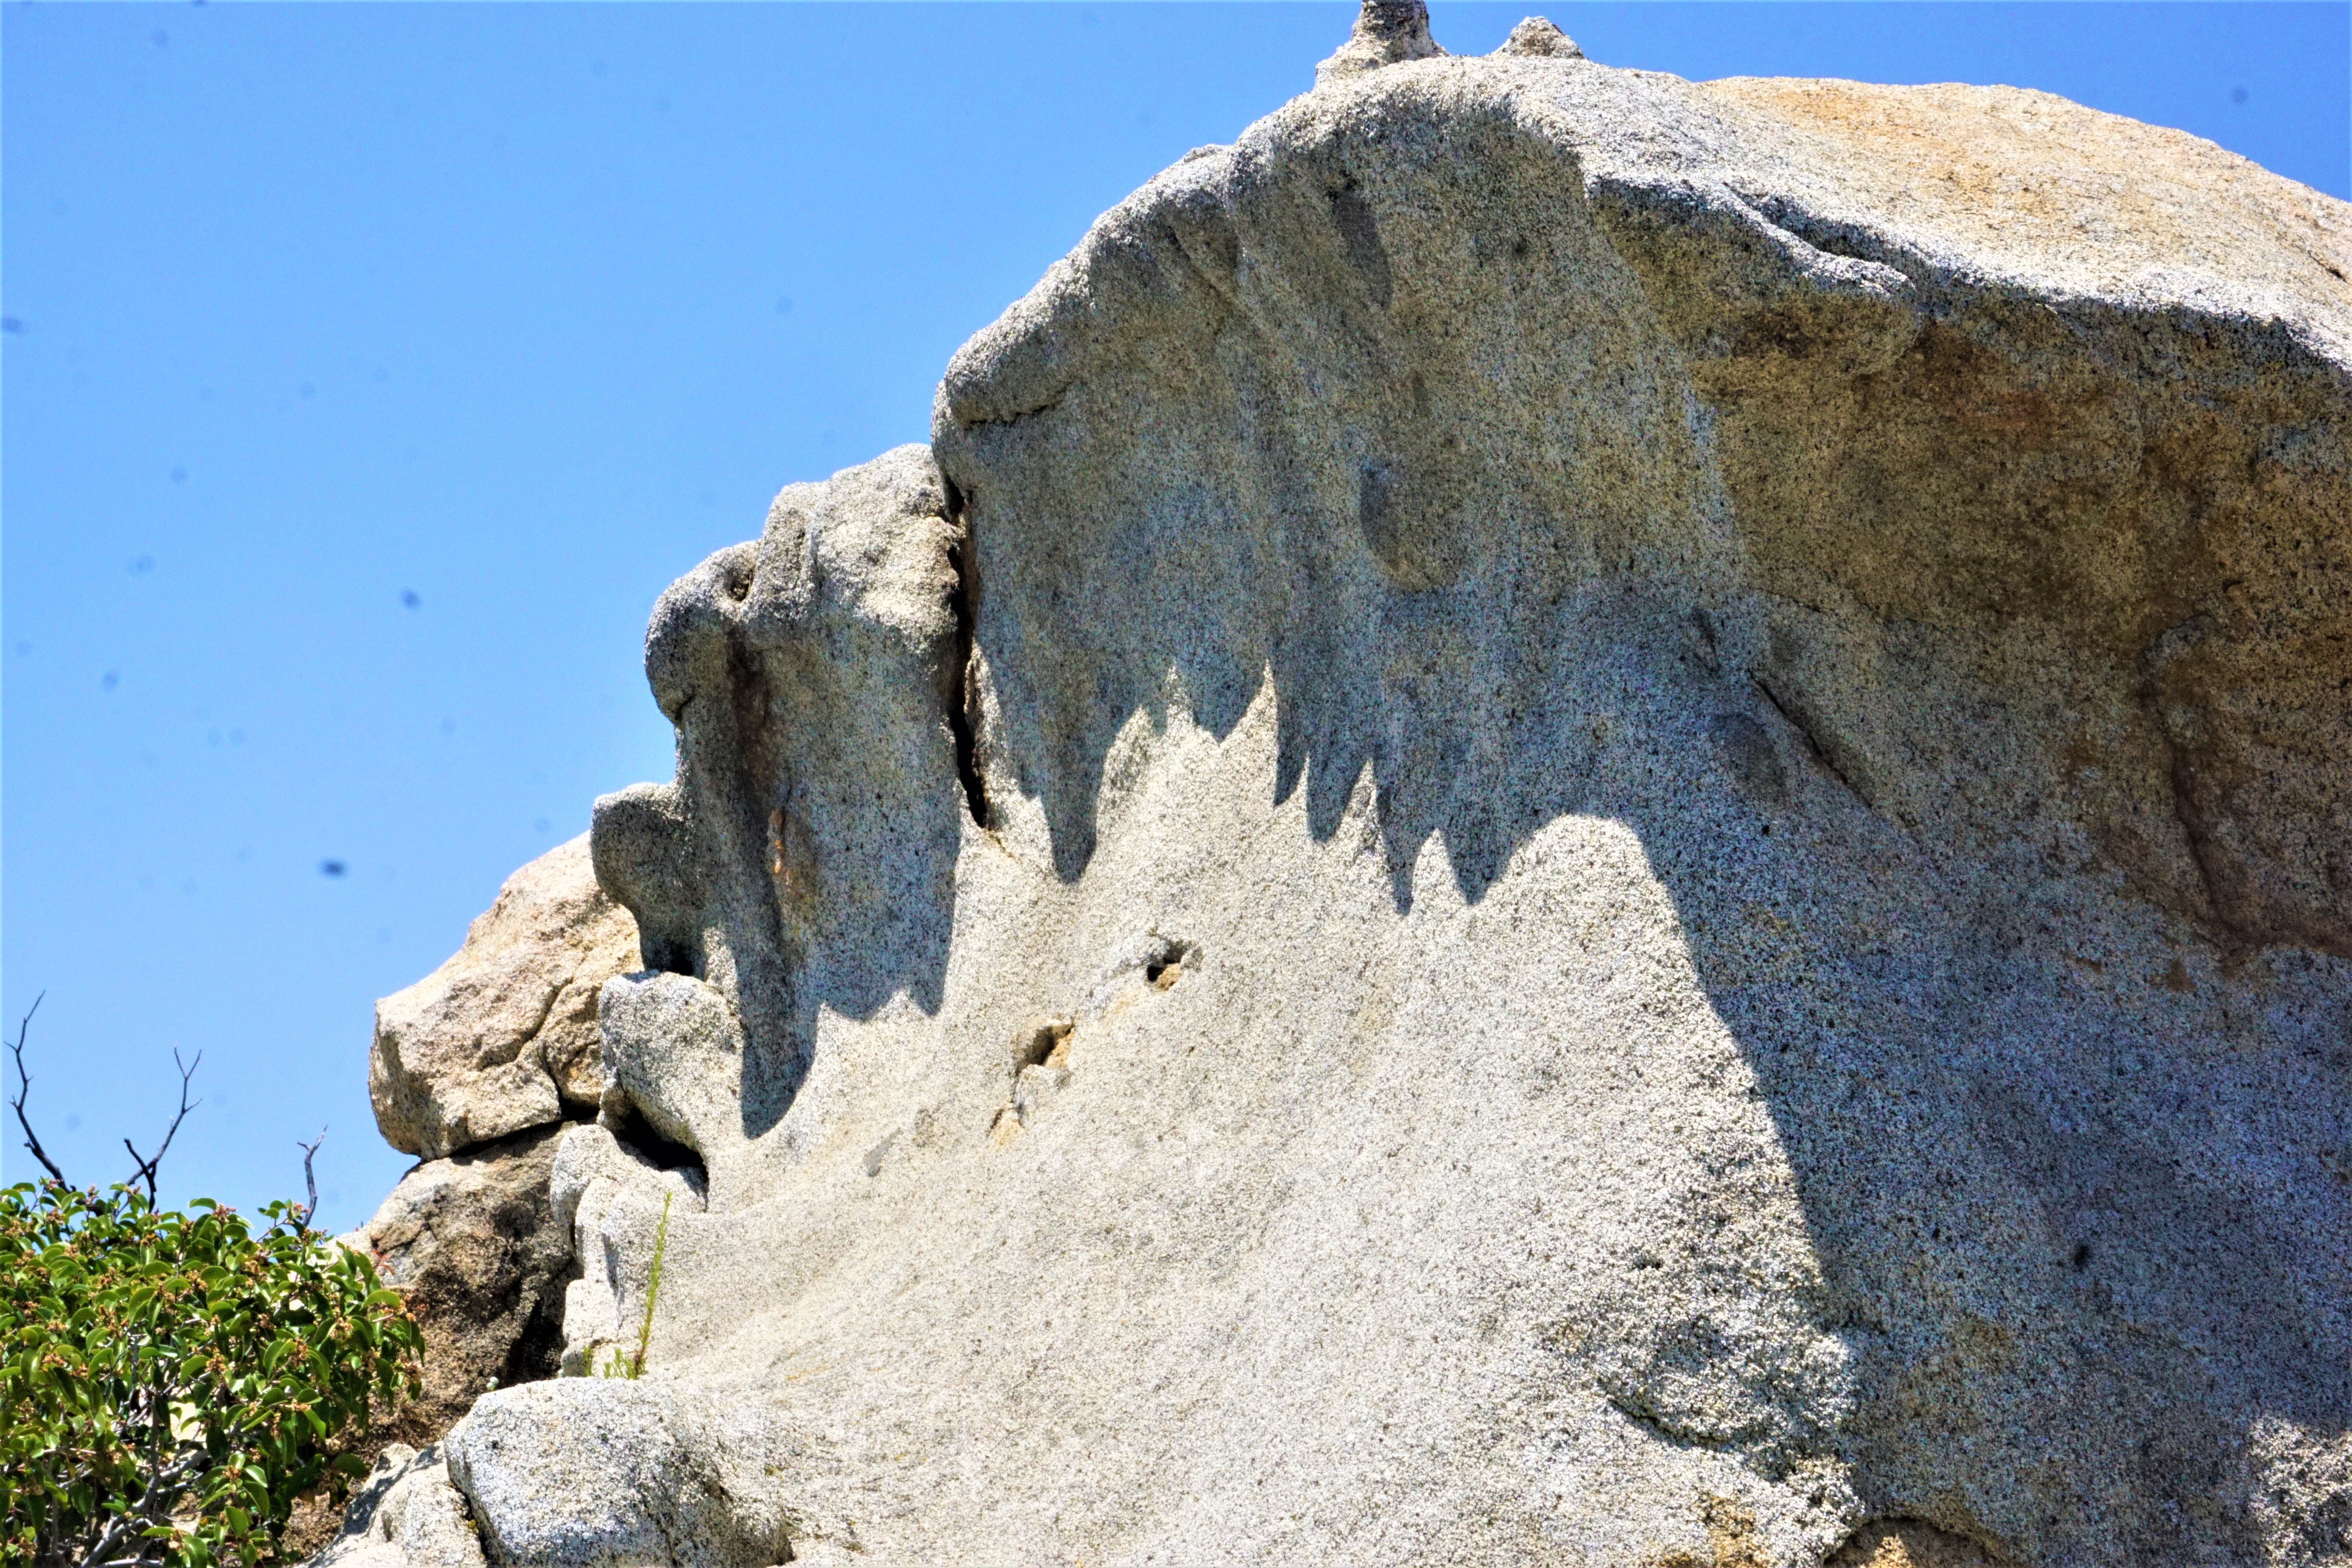
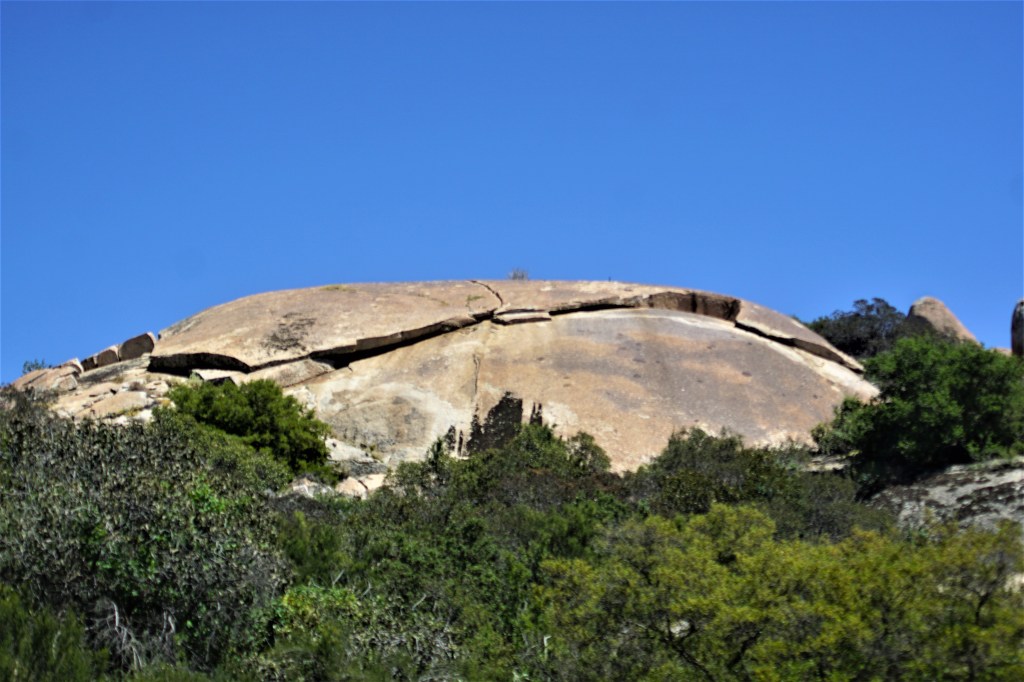
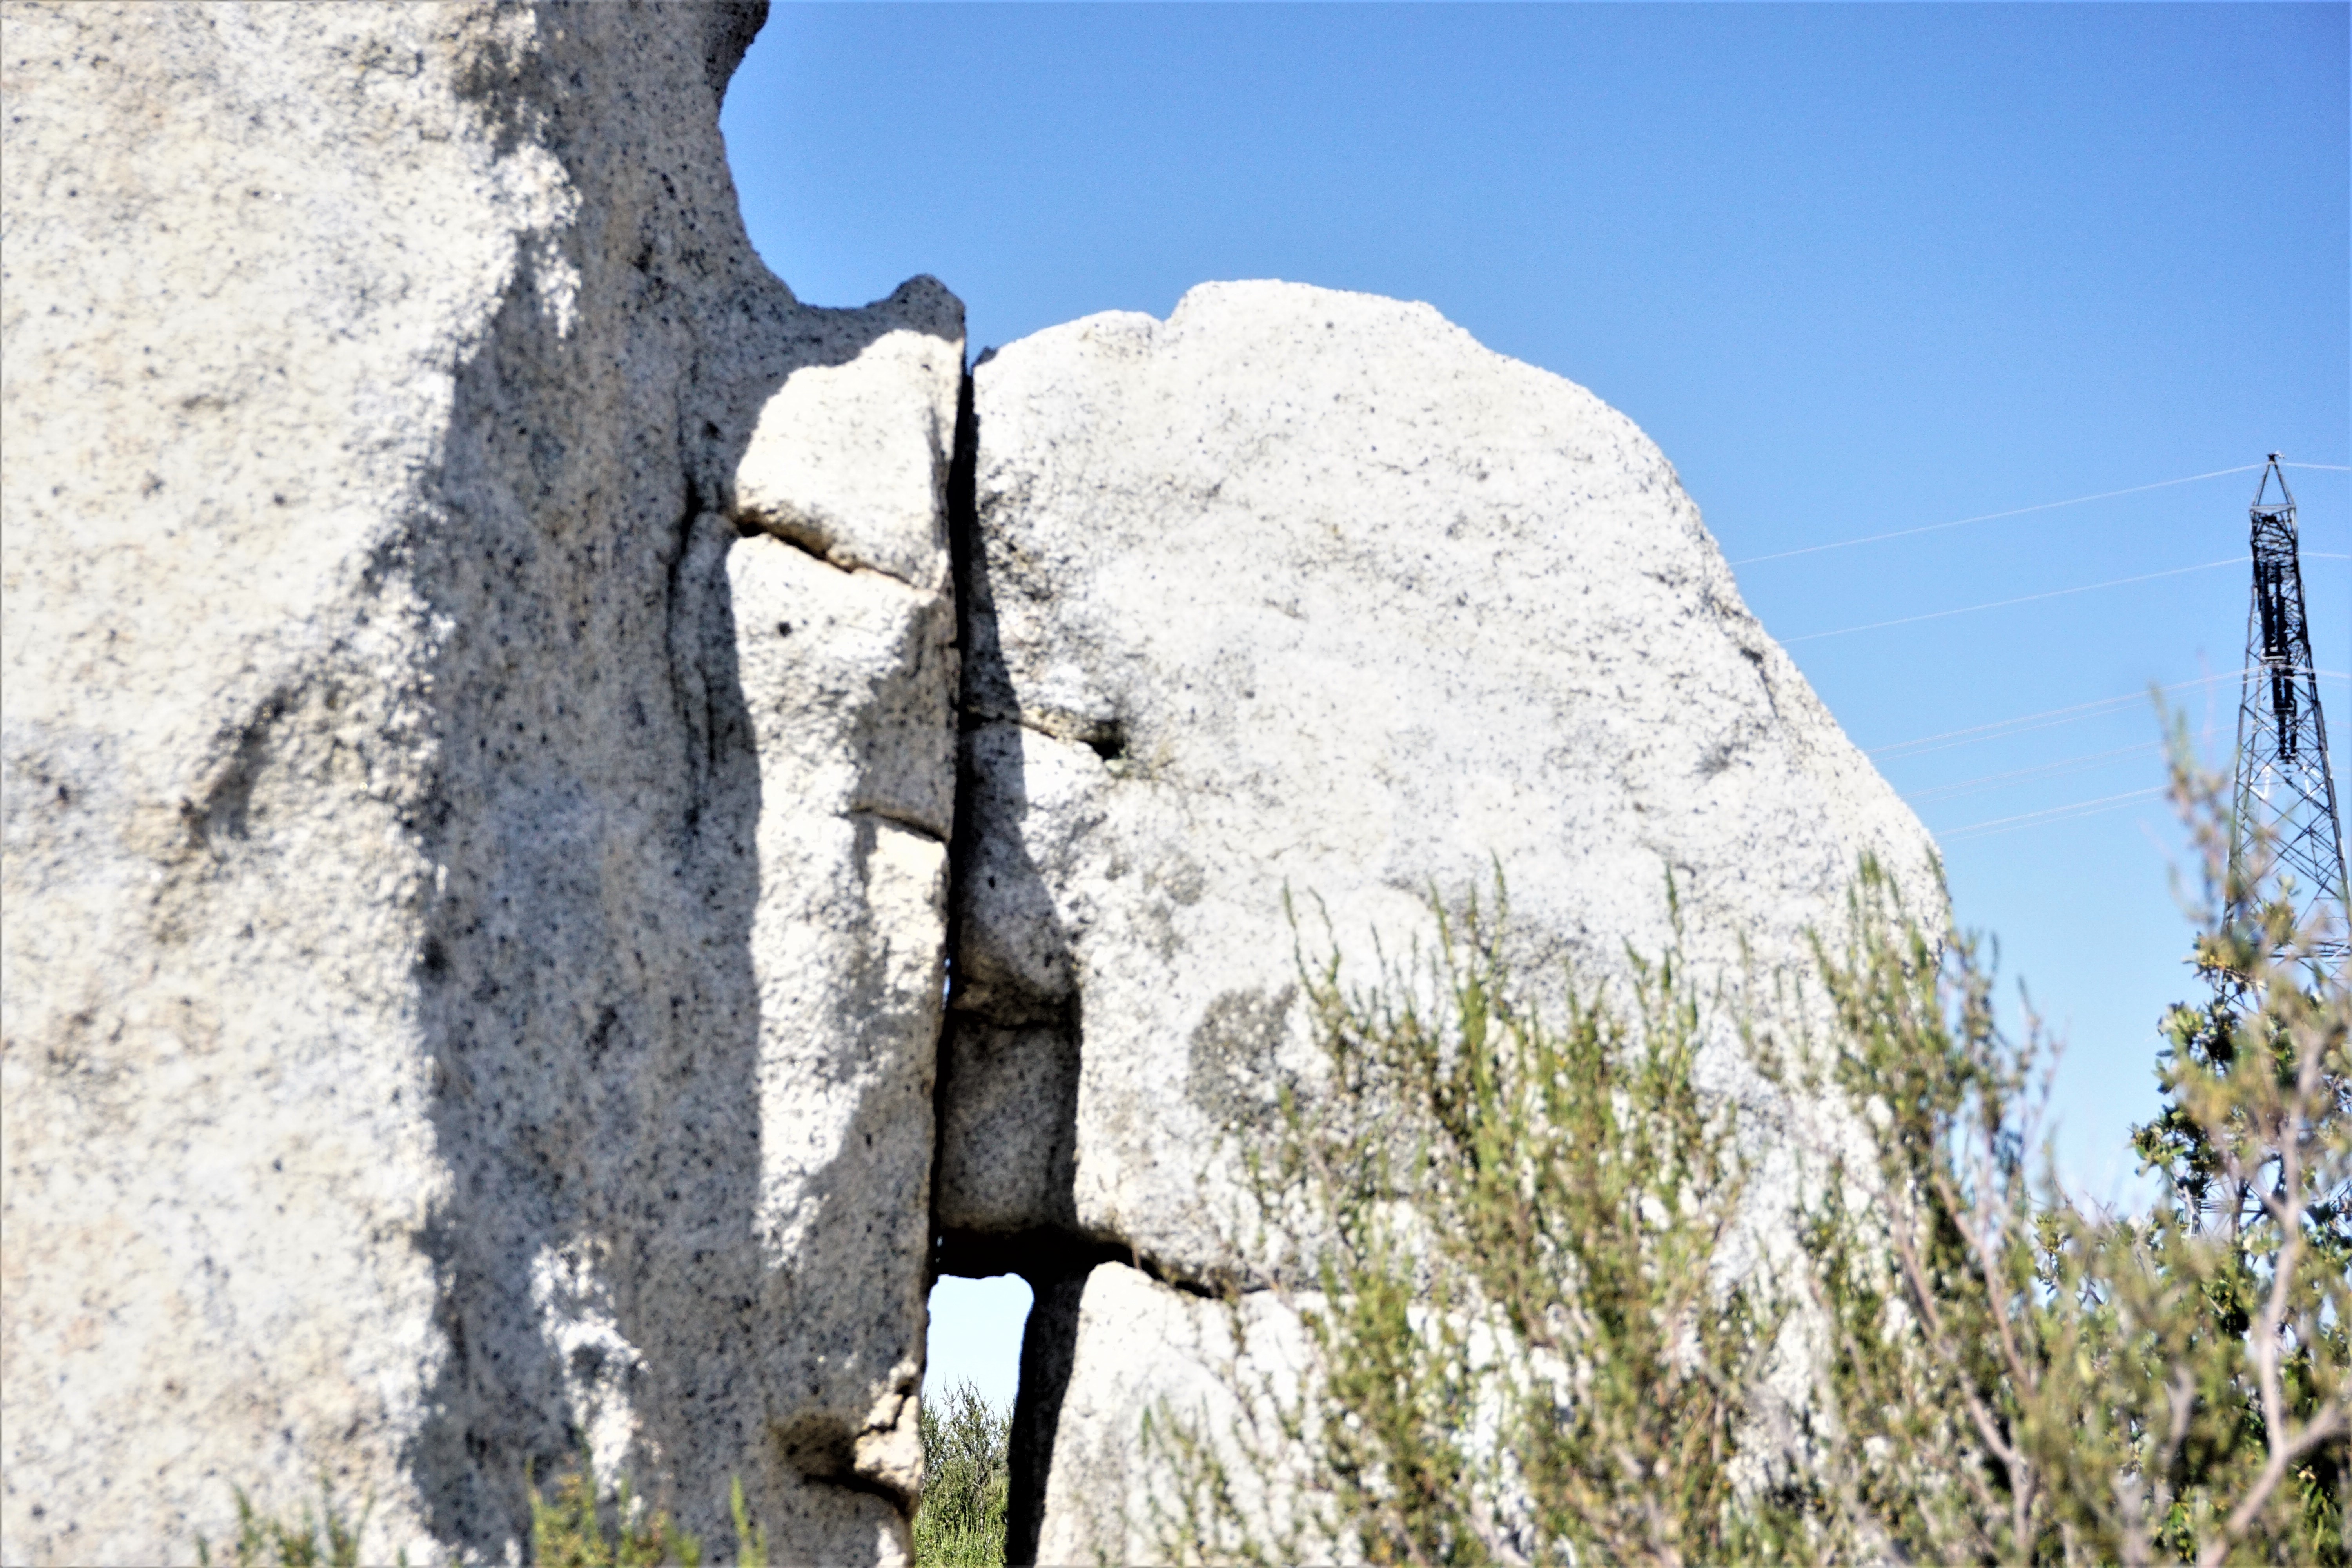
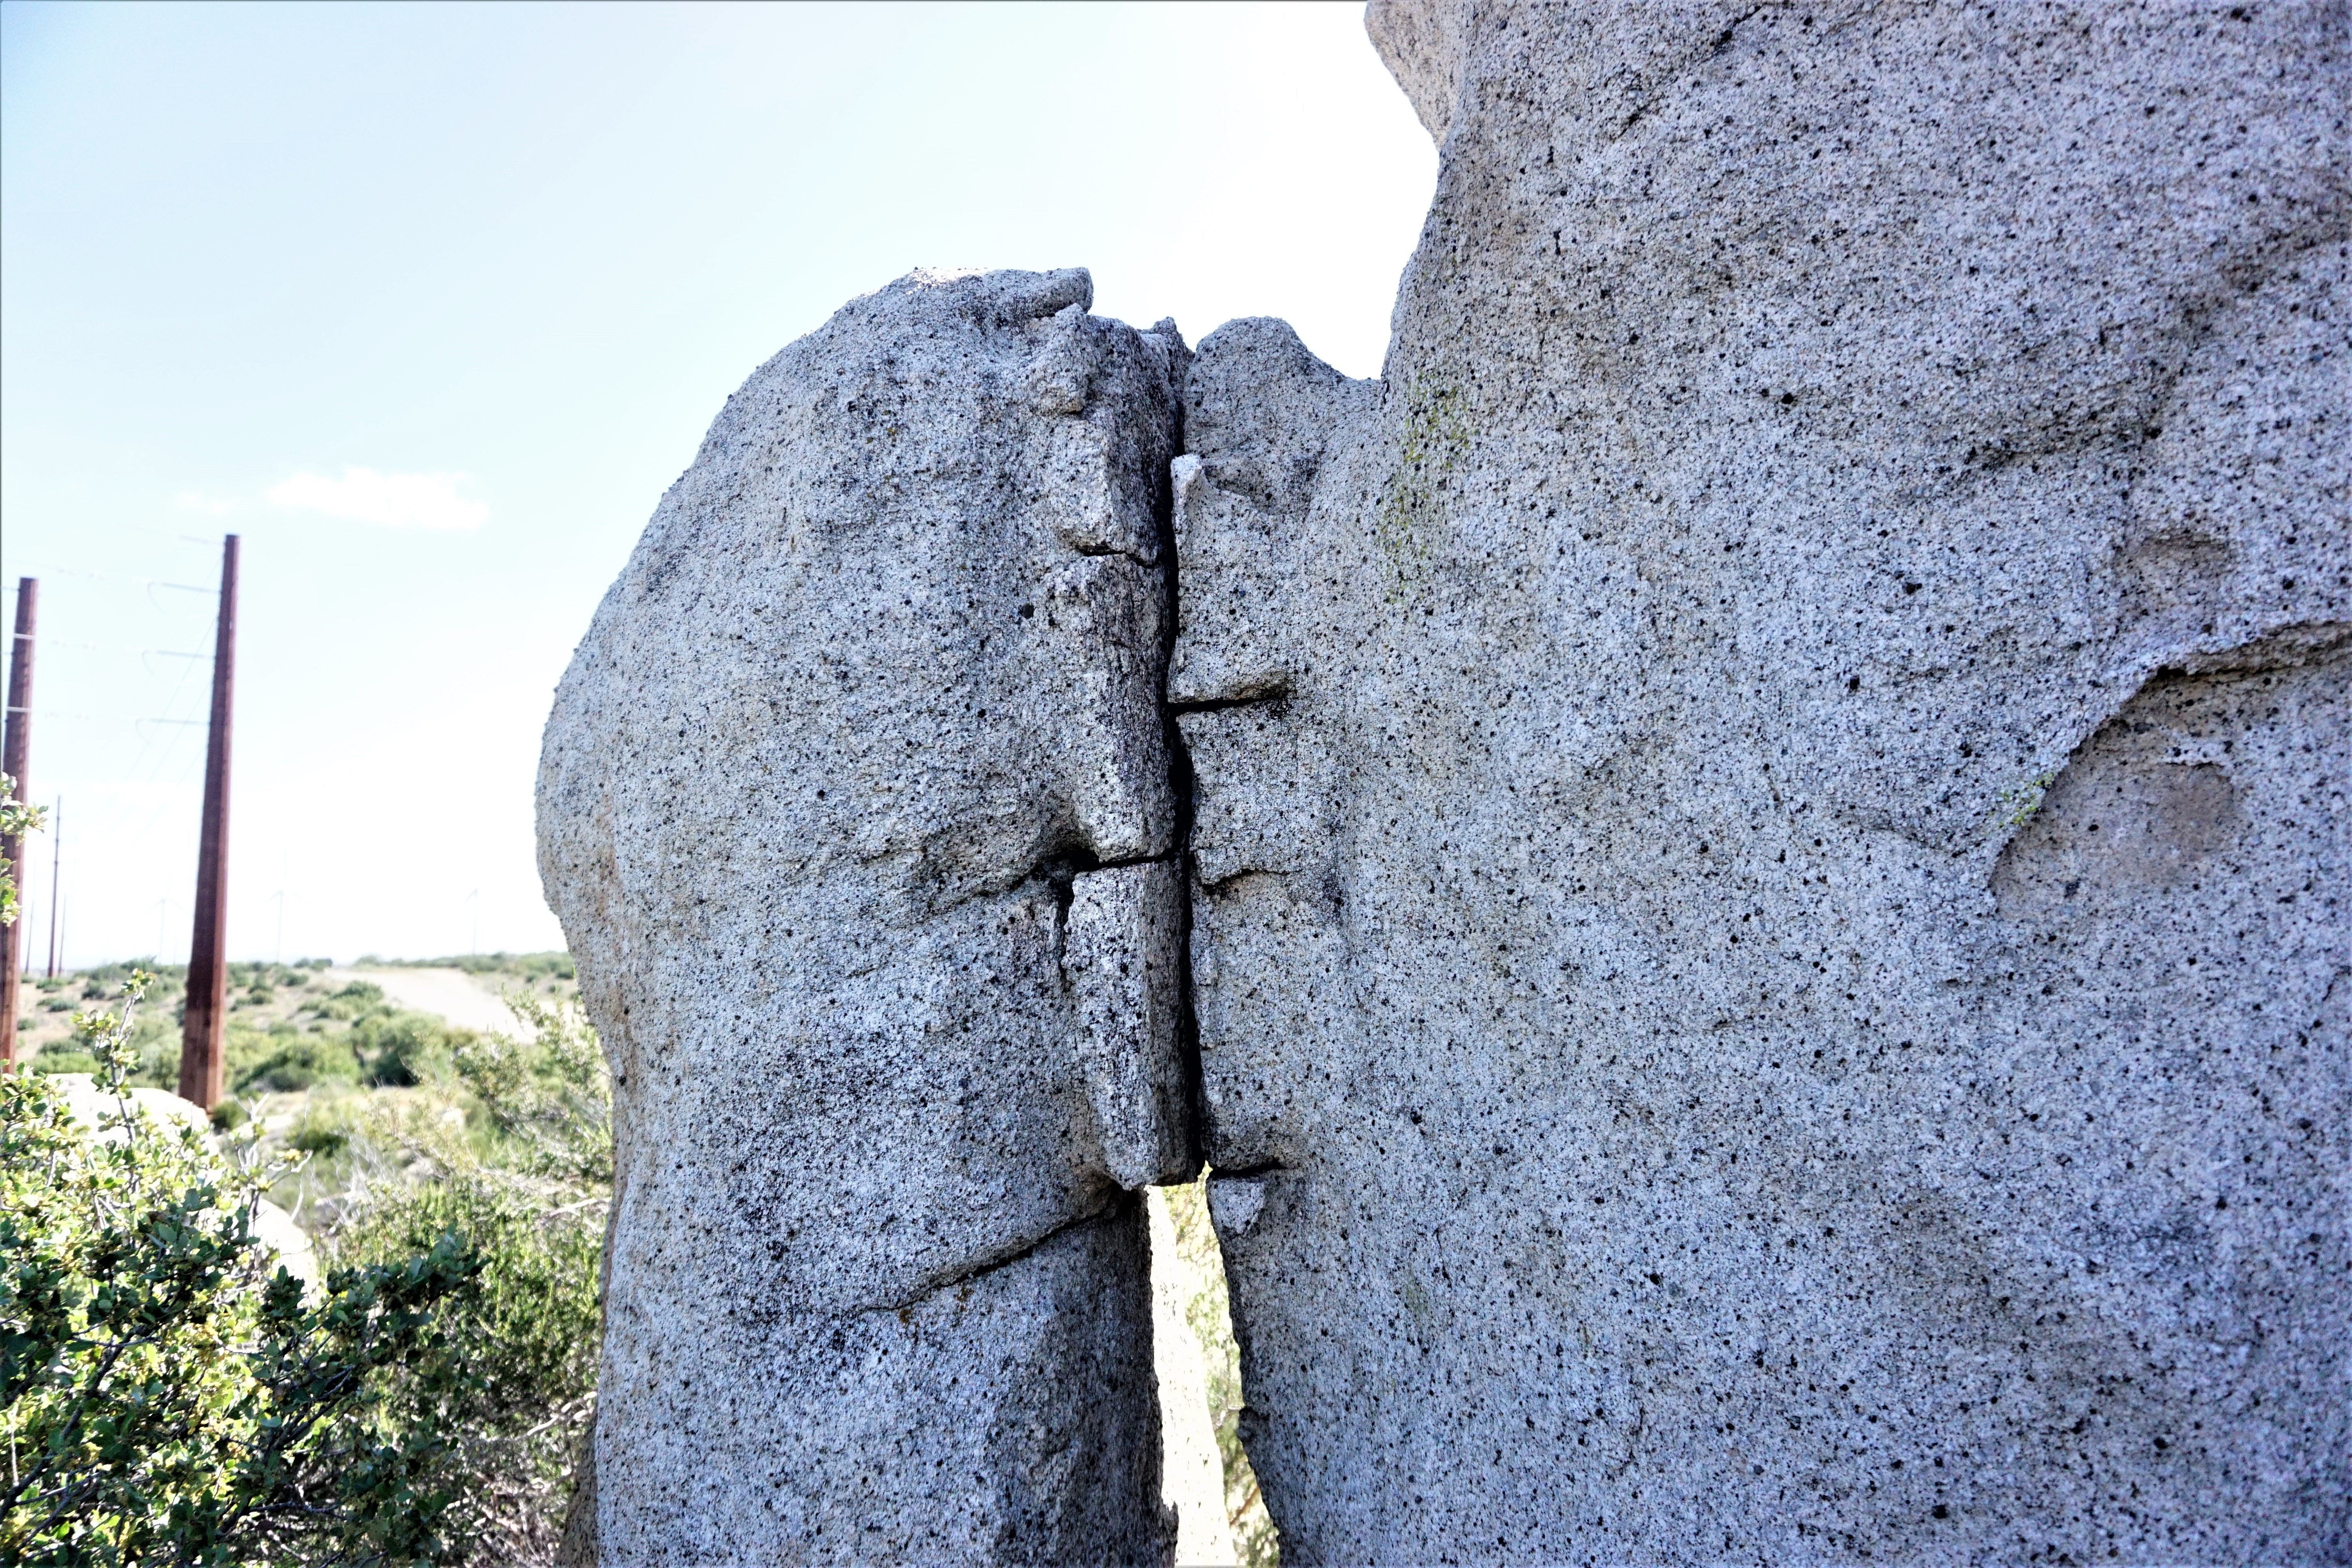
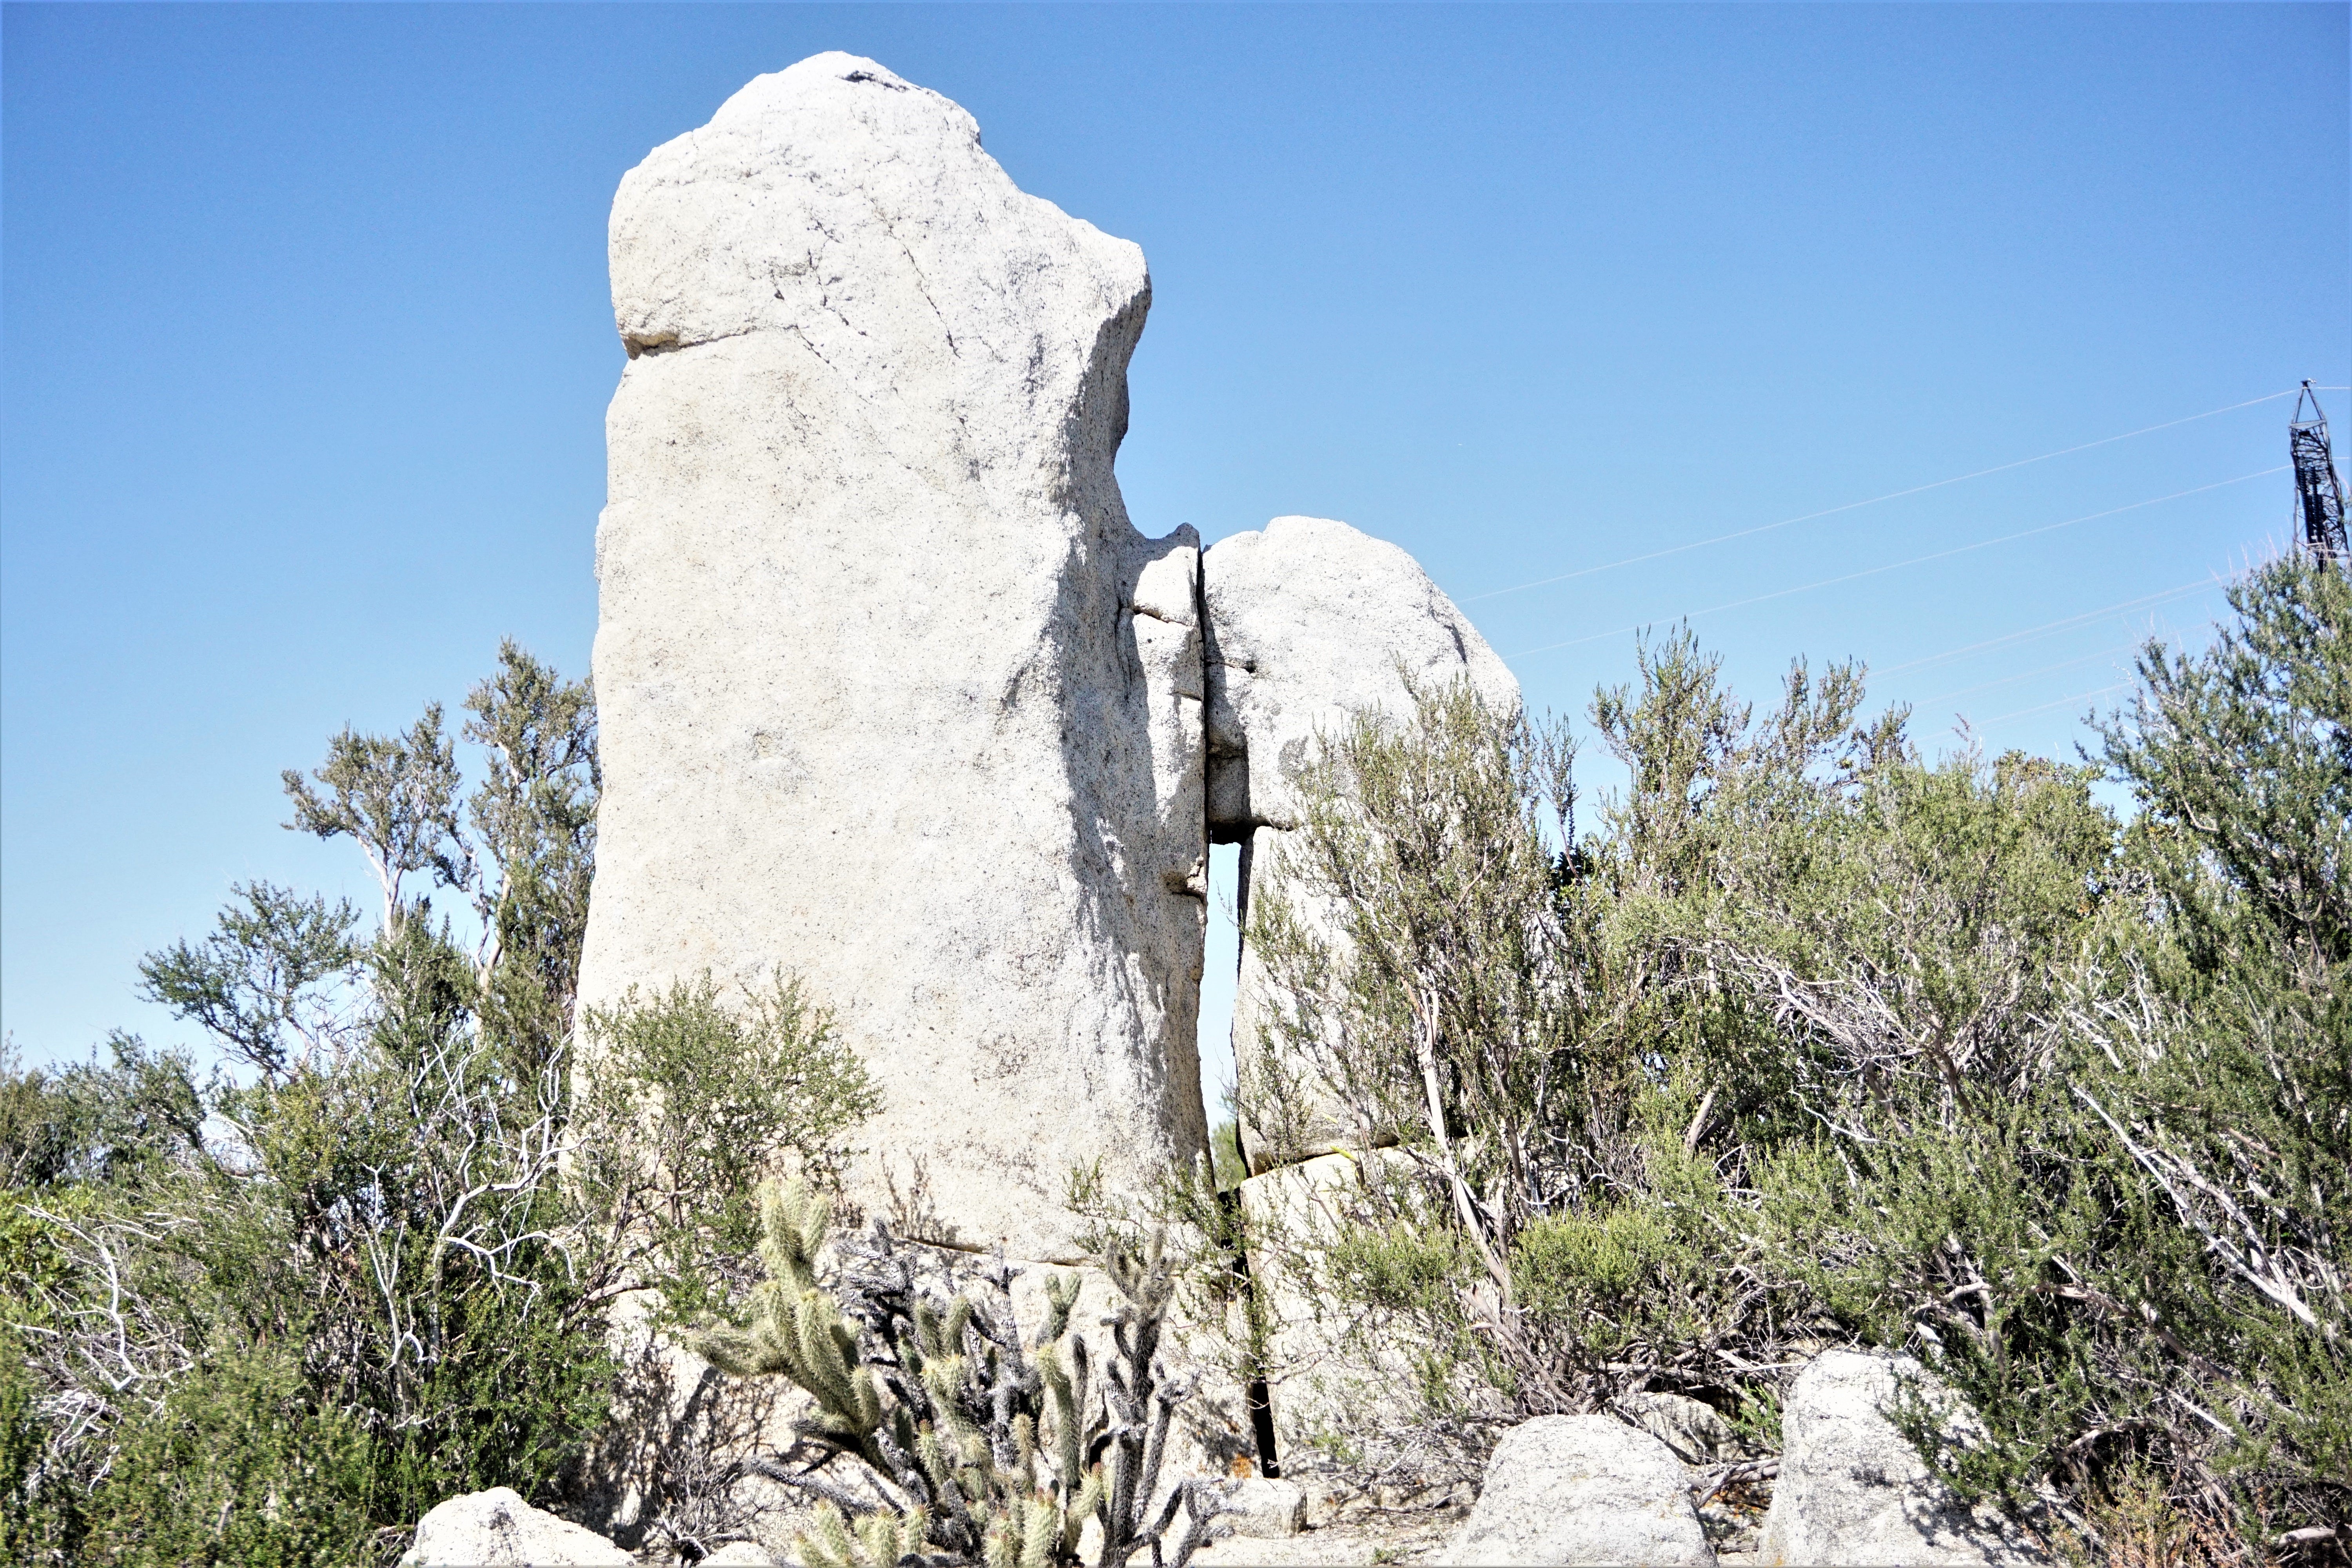
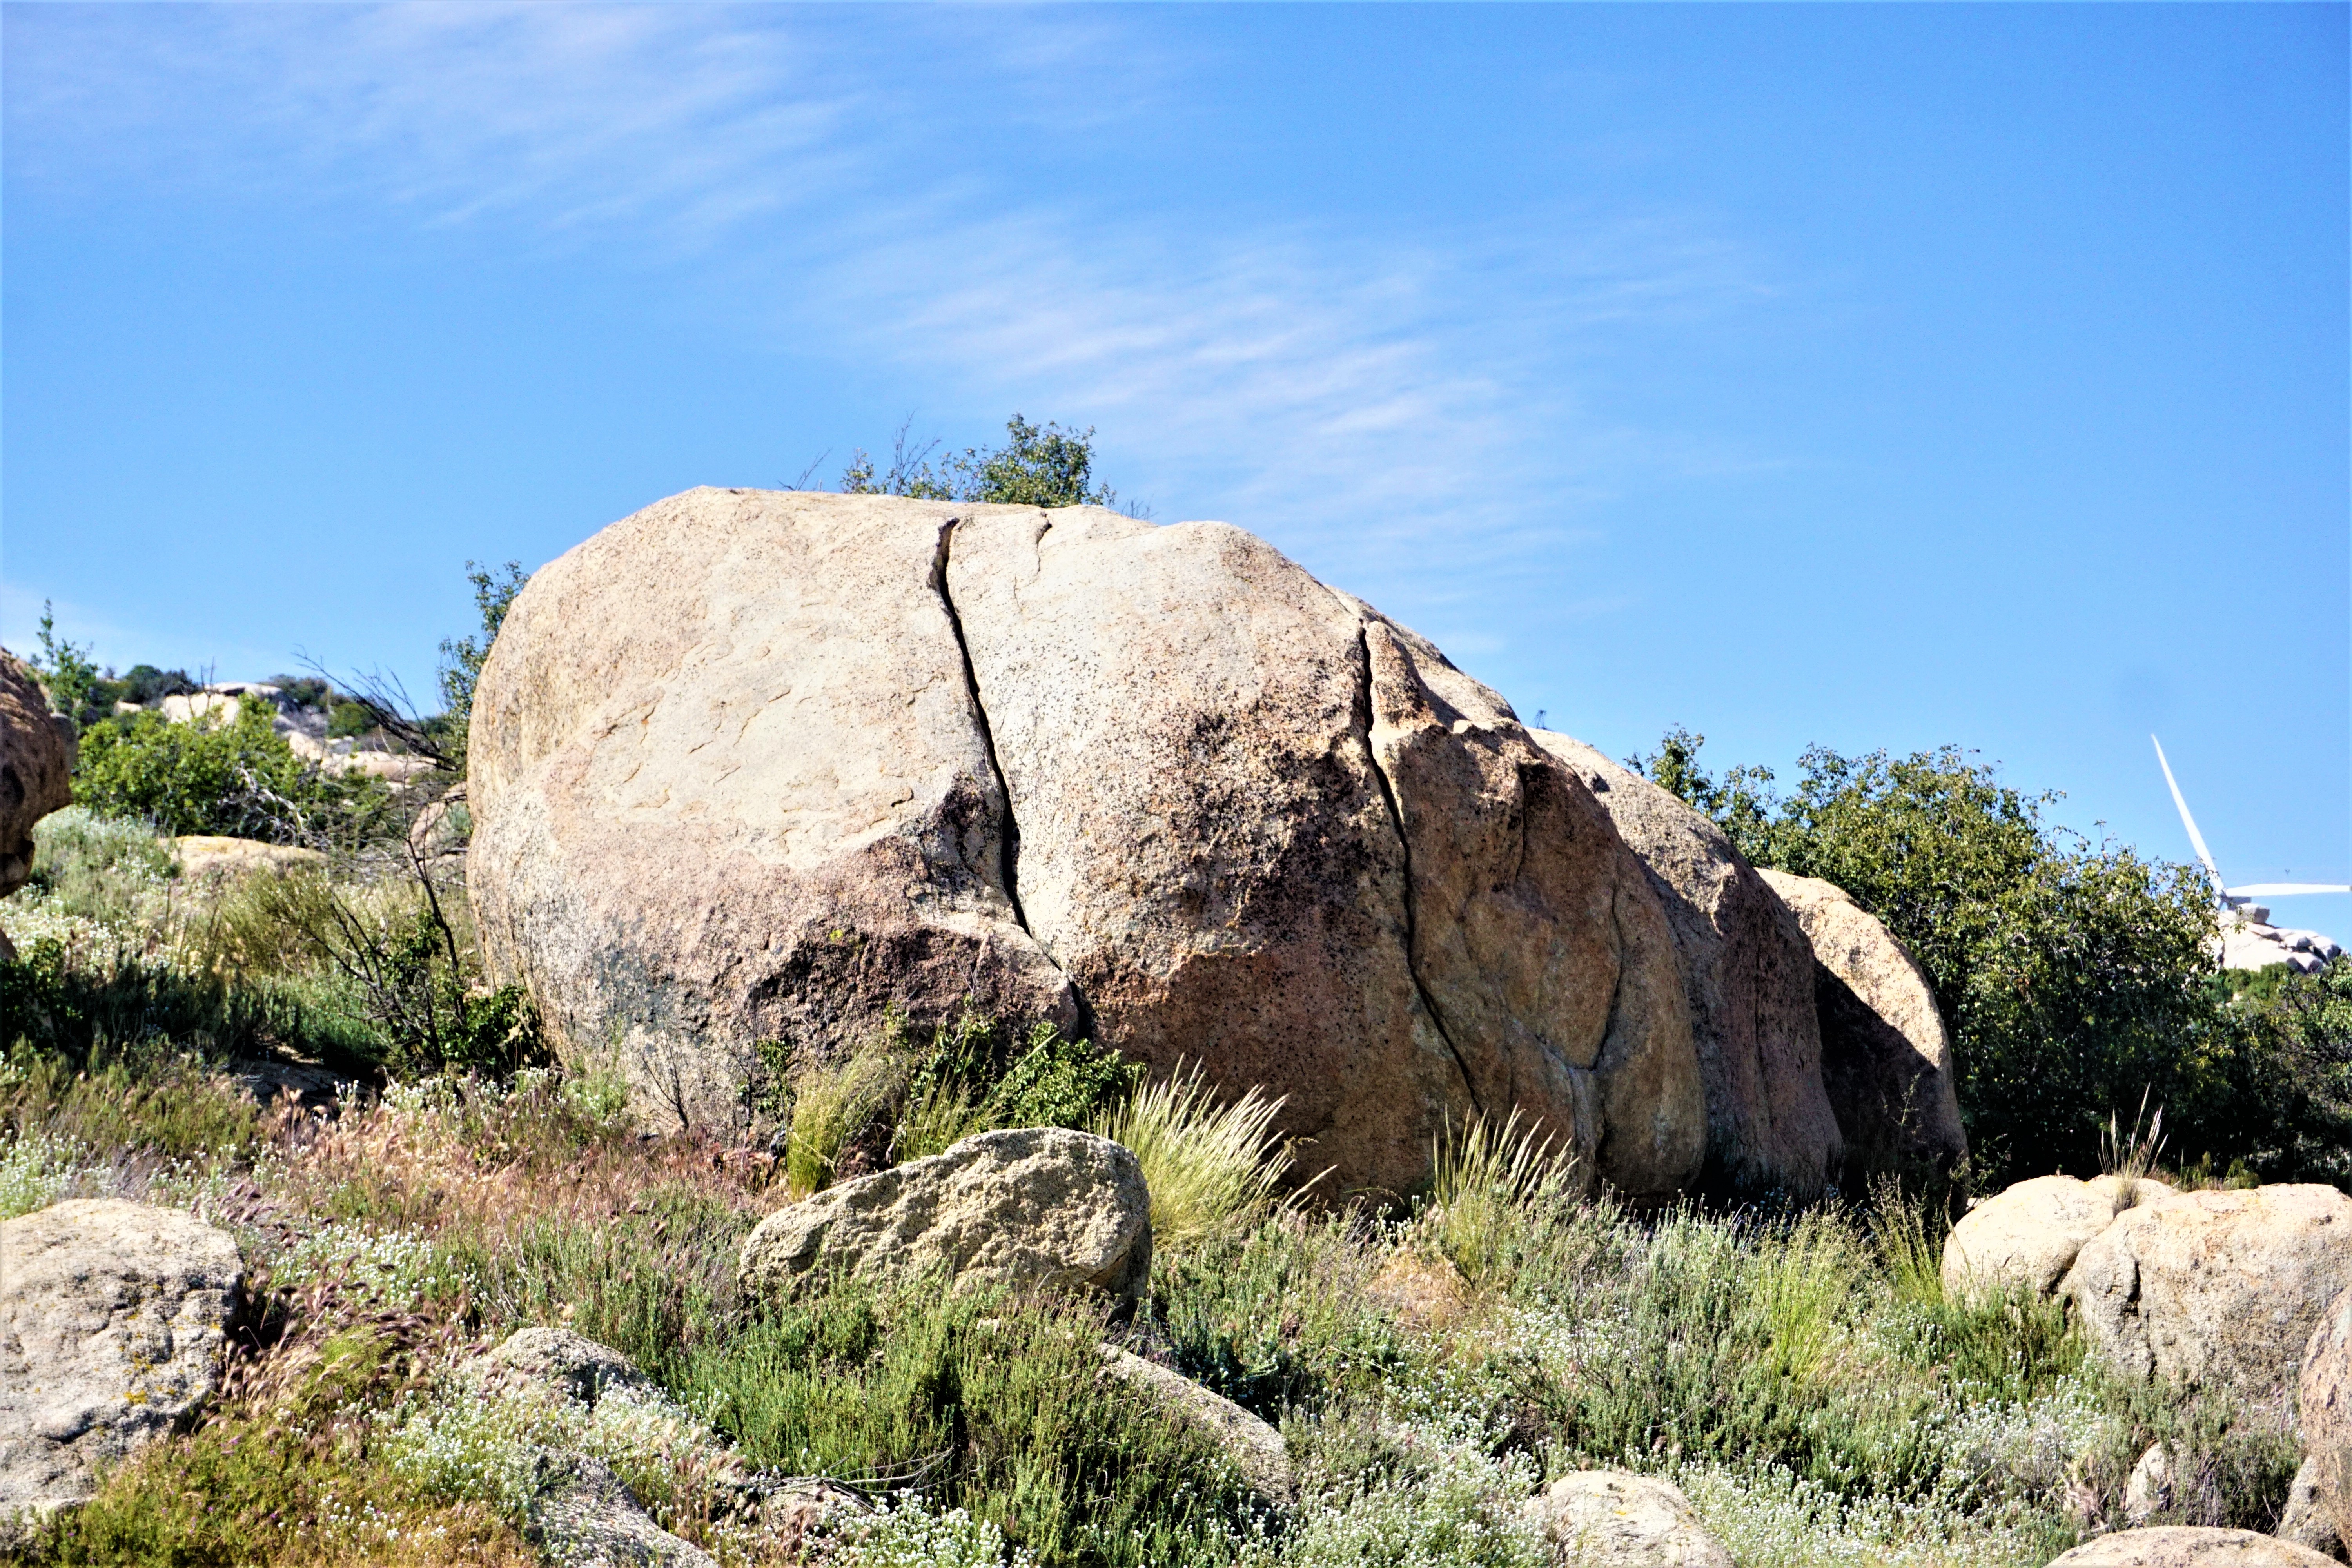
Surface tension had to conform to the volume reduction, so one of two things happened. If the skin had cooled and recrystallized, it became rigid and further shrinkage of the hot interior caused the hard shell to break, leaving a sharp crack. If the skin was still plastic and viscous when the drop shrank, the skin conformed around the fluid interior leaving rounded edges. Most, if not all rock structures display one, or both consequences of shrinkage.
Separations that occurred from shrinkage after the skin ‘set’ into a hard shell, couldn’t conform and broke, leaving sharp edged cracks, as shown in these photos. These breaks tend to form an “S” shaped curve, not orthogonal segments.


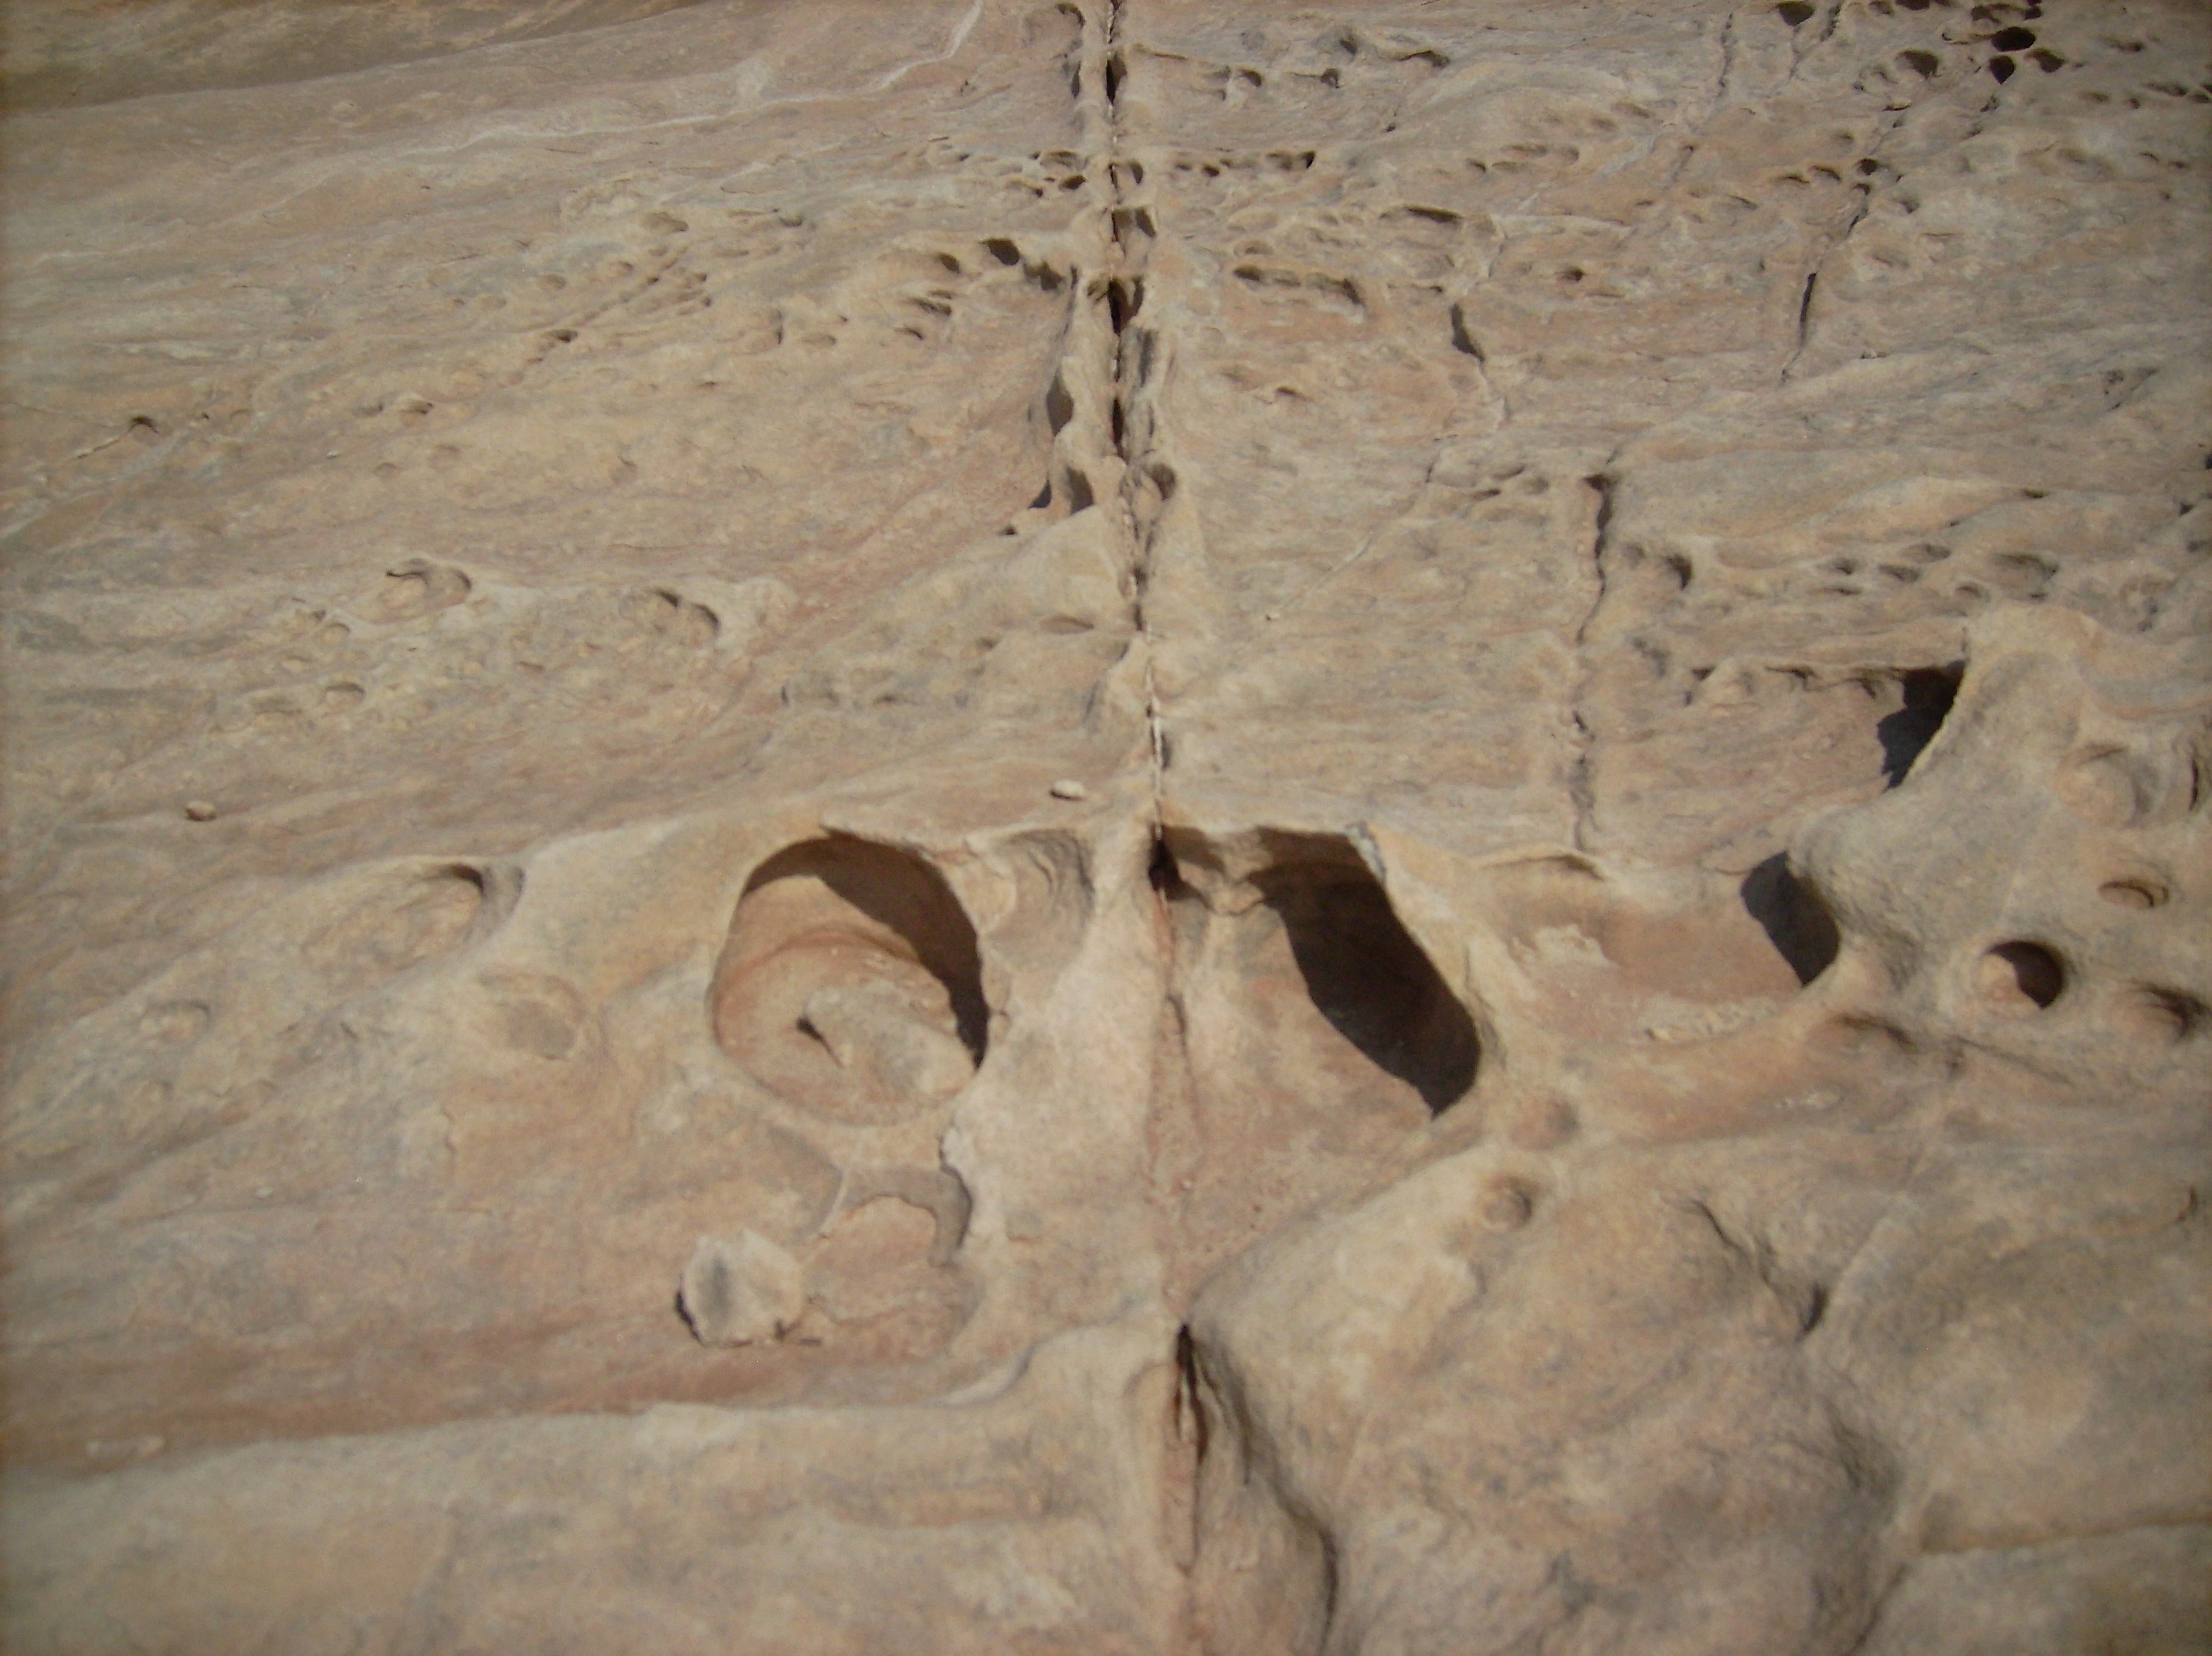
Drops in clusters, with membranes still soft and pliable, show rounded edges and concavities where drops separated and shrank. These cellular segments tend to break parallel and orthogonal, at specific angles particular to each cluster.
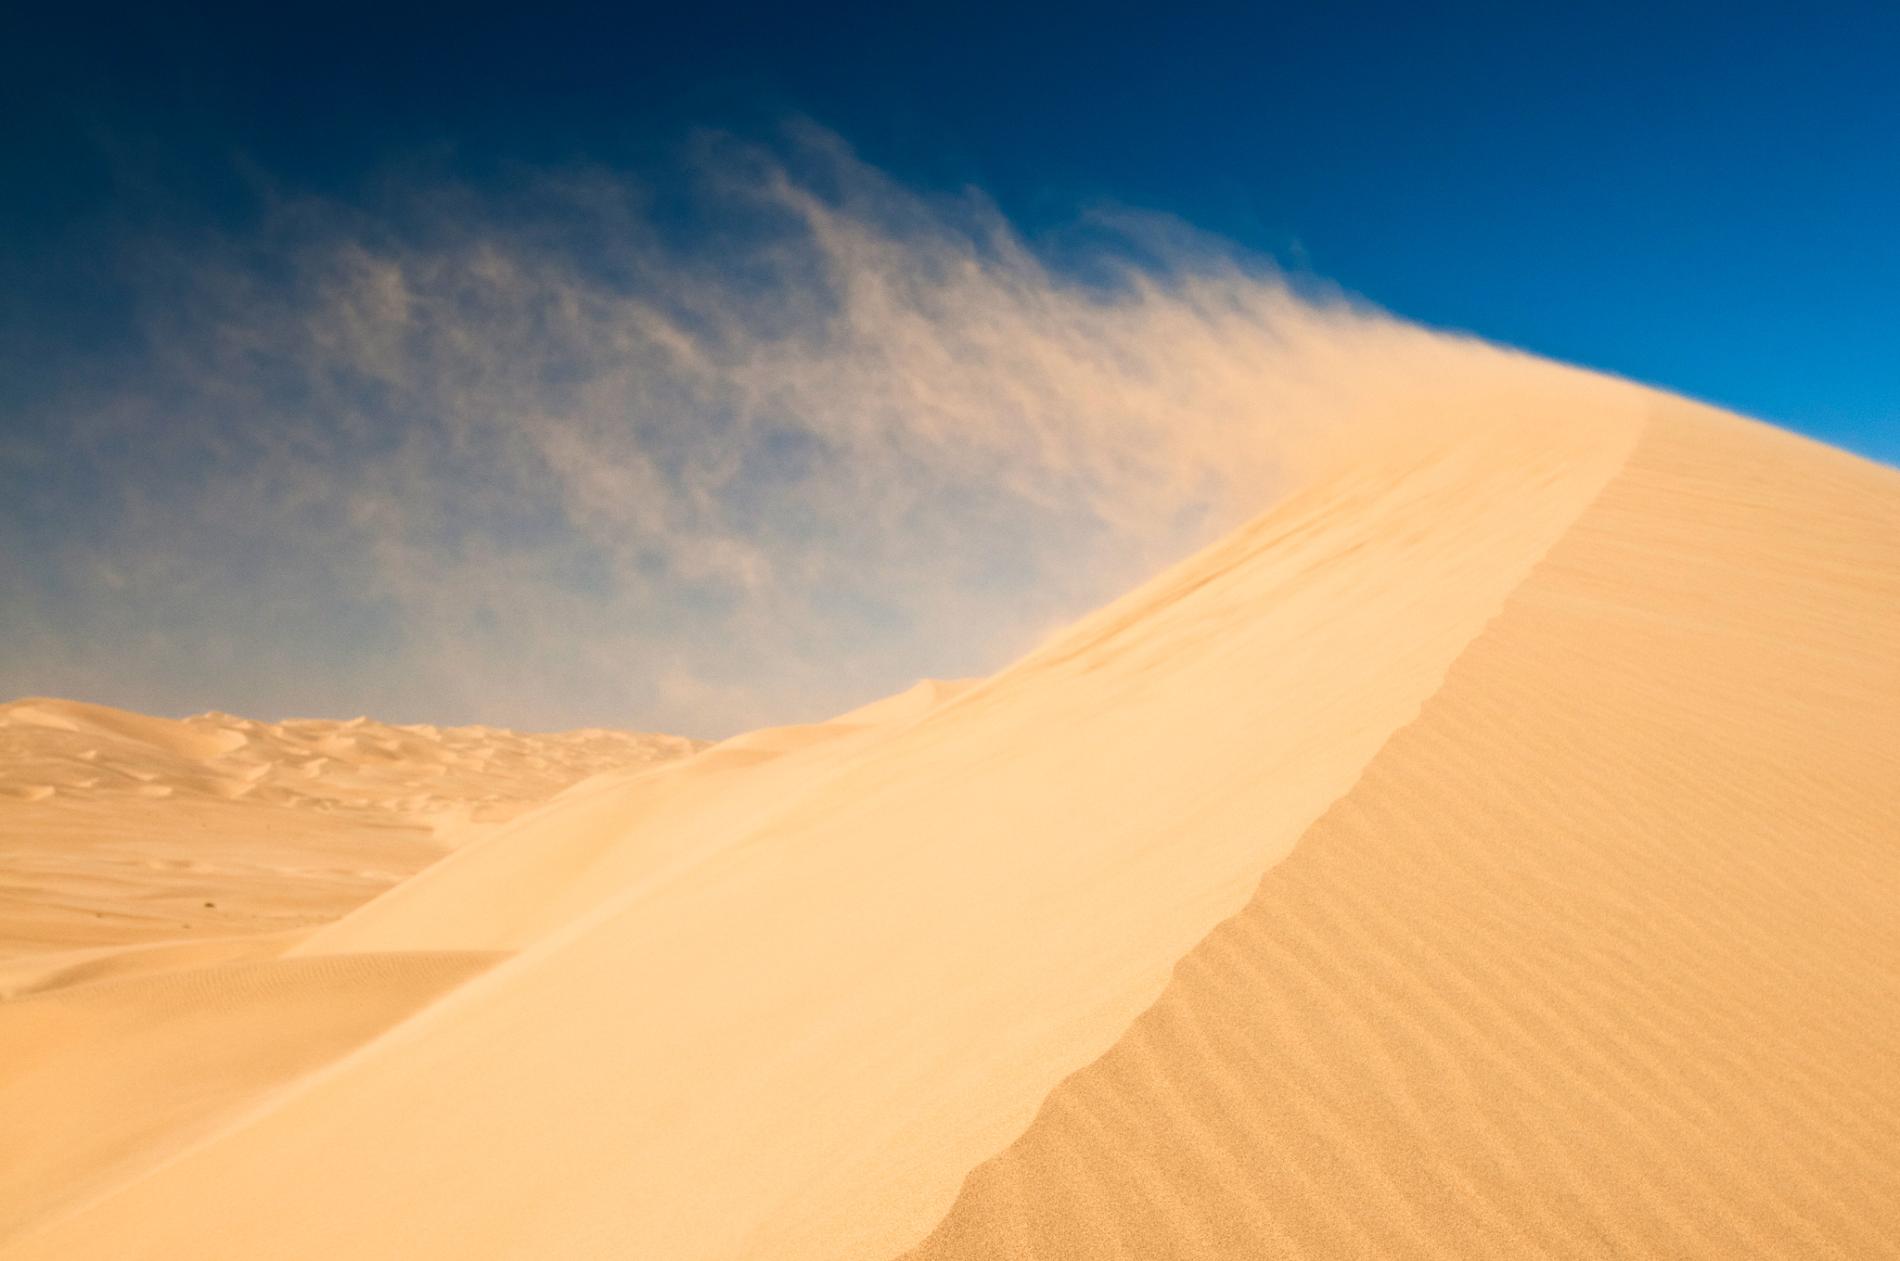
The angles, or dip of the horizontal surfaces vary widely. It seems likely some force was pushing some clusters over, like the wind, or gravity was making them topple. The angles from one cluster to another are not consistent, which suggest variable winds, something perhaps expected over a boiling cauldron.


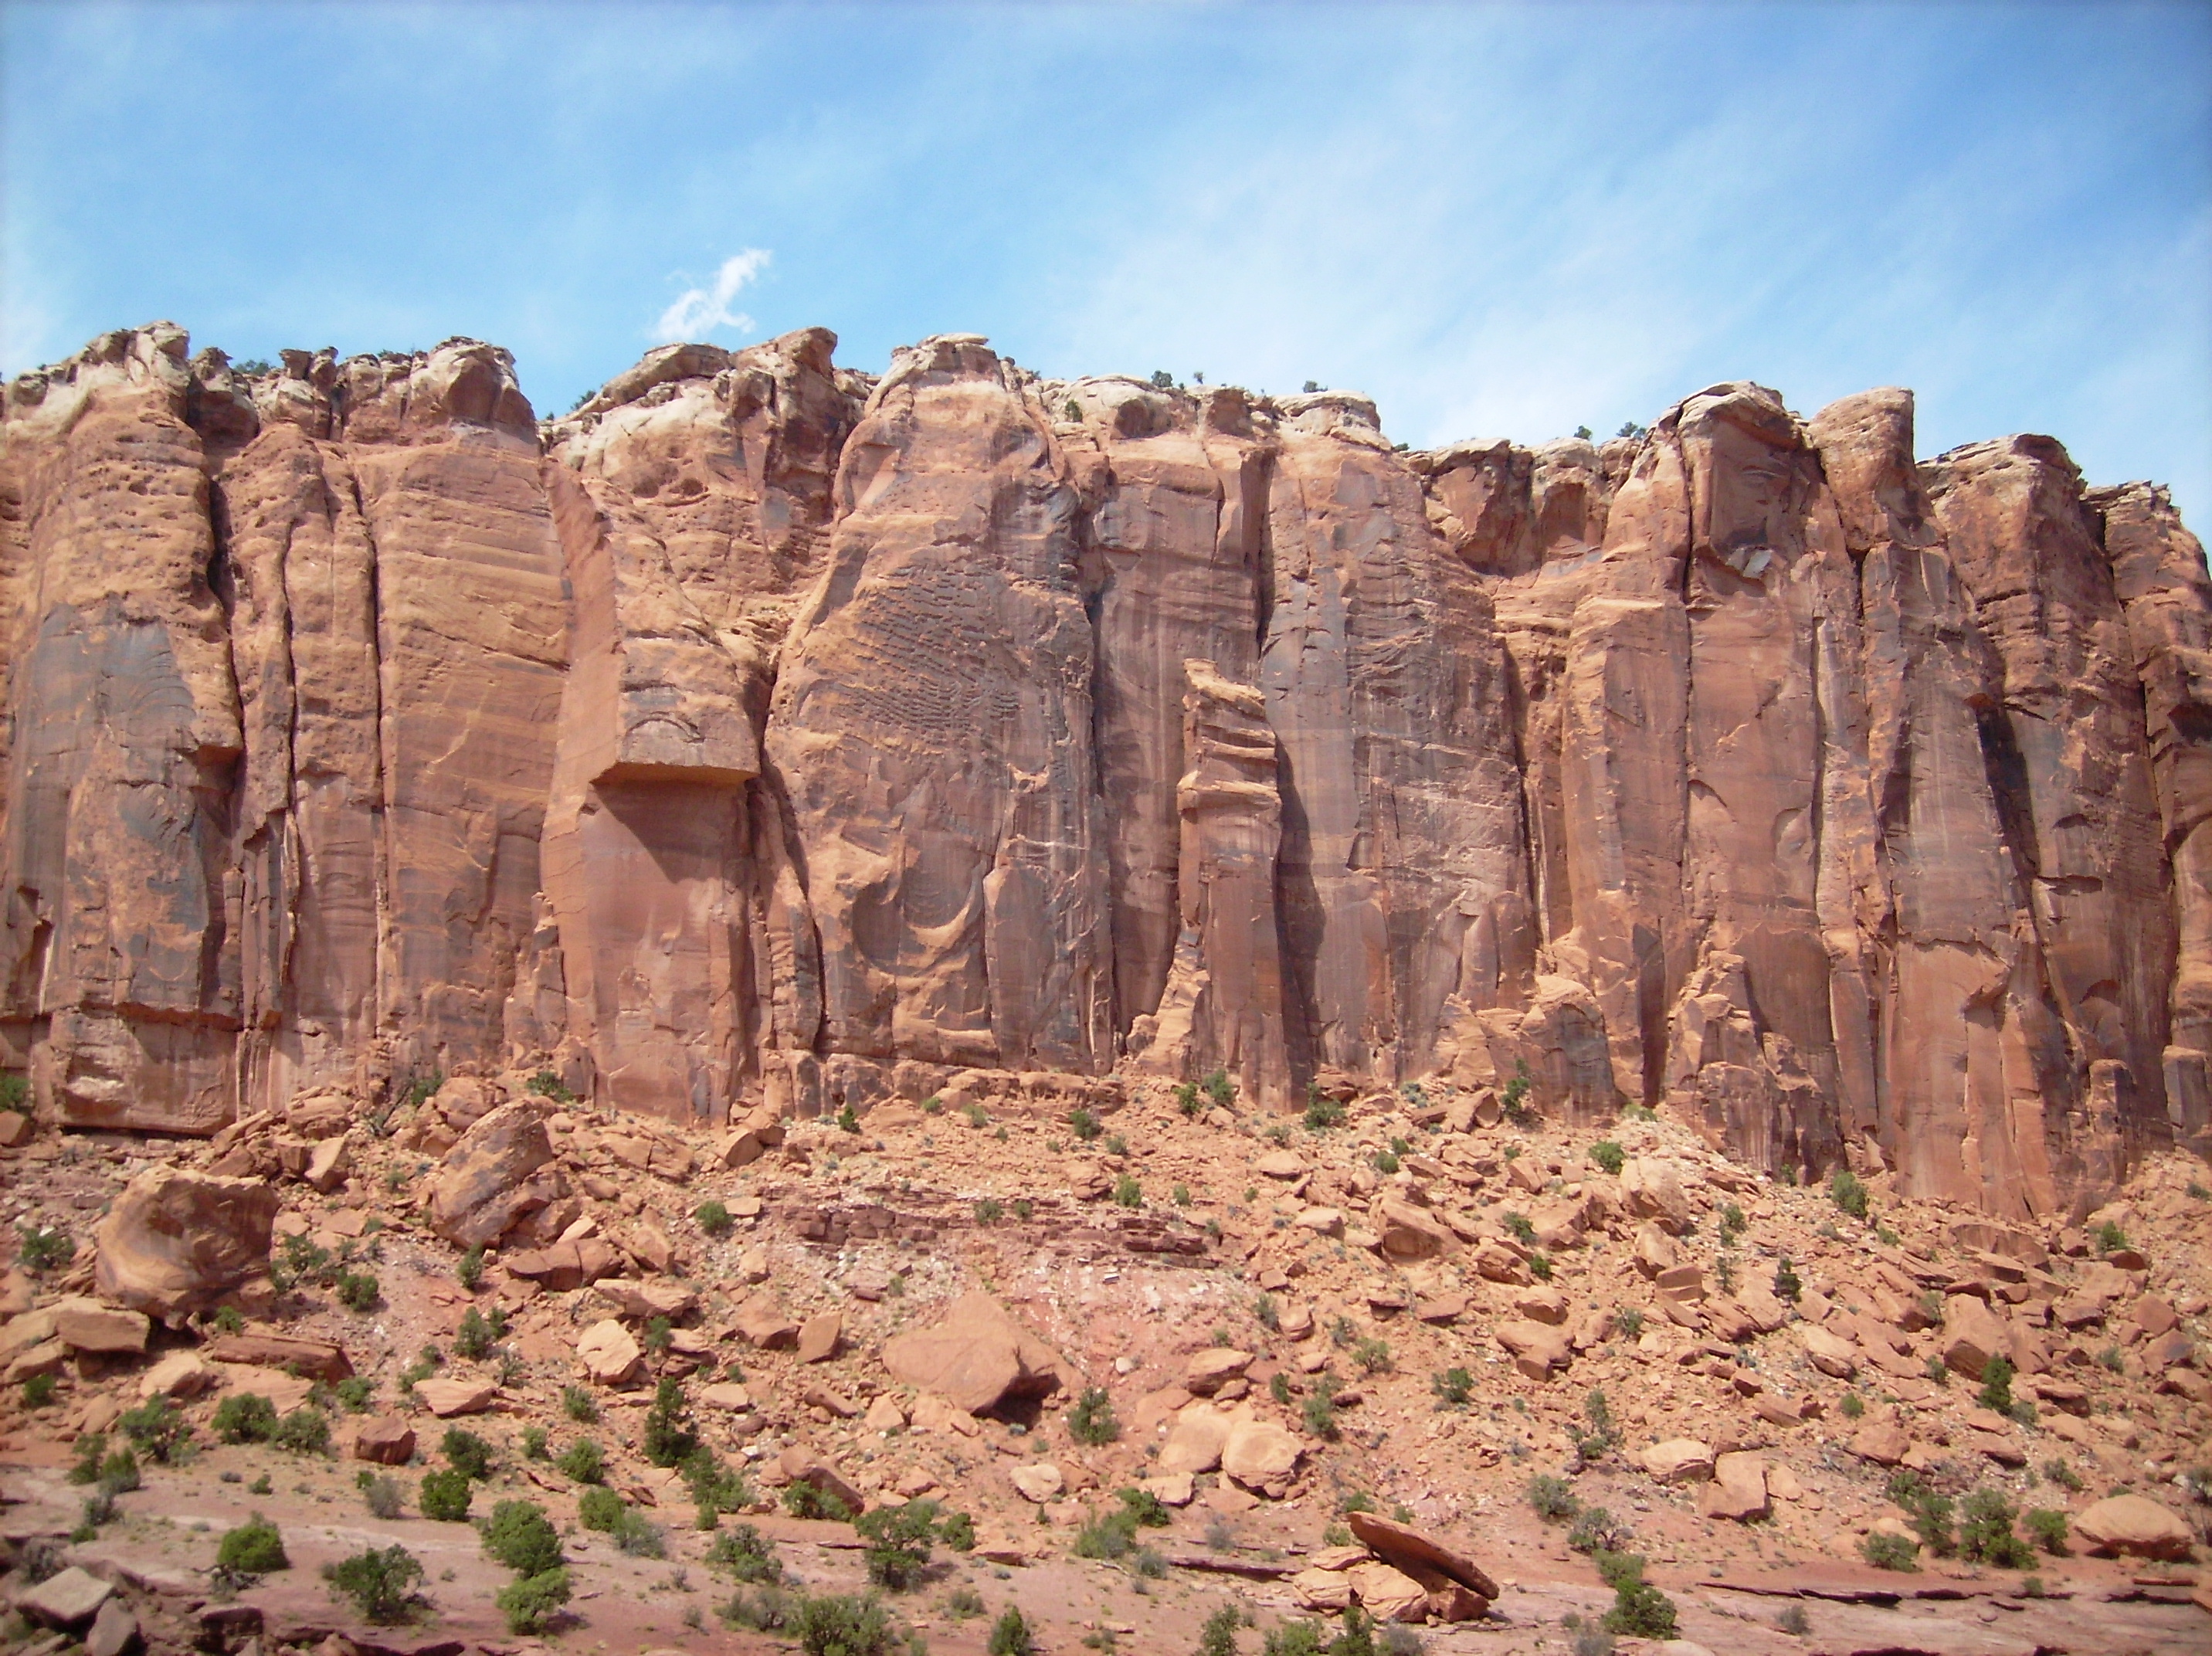
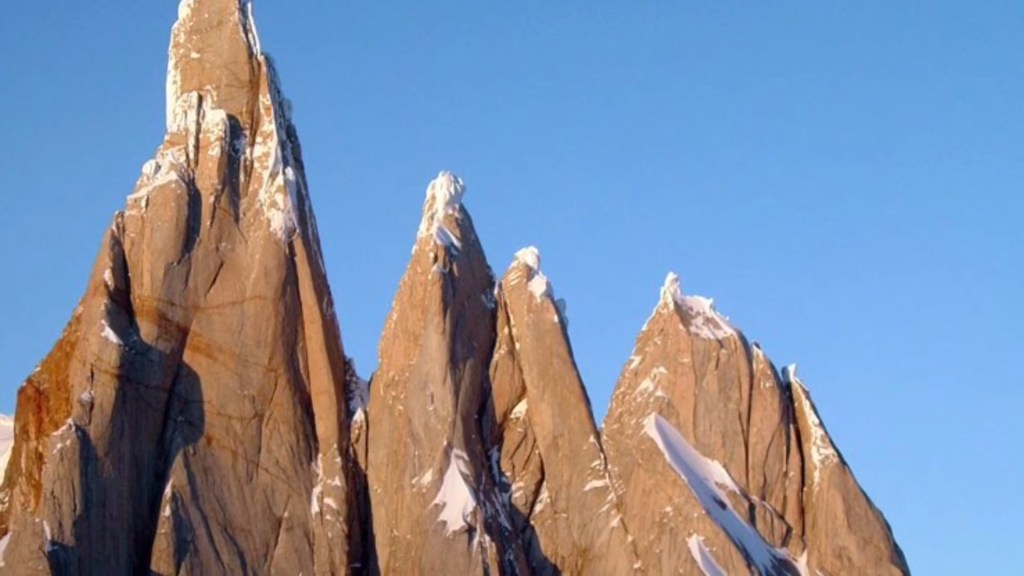
Another compelling evidence these boulders are boils is the columnar geometry of the largest structures. The segmenting is cellular, as already discussed, caused by cooling, shrinkage and surface tension related skin effects. The columnar shape, however, indicates convection. Vertically elongated, clustered polygonal columns are a known effect of heat convection, called – what else: convection columns. What is boiling? A process of heat convection.
Flat surfaces are left where bubble walls pressed in tall squarish columns, and then fell apart after cooling, shrinking, cracking and segregating. Everywhere boulders are co-joined, or conforming to each other in shape, interfaced with puzzle-piece concavities and bulges, because they were fluid and plastic during formation.
The granite boulders are visually patterned precisely as one would expect a viscous, frothing fluidized matrix to look if it were frozen mid-boil. Compare these formations to viscous drops, bubbles, foams and boils of various fluids and you can find analog formations with these shapes and features.


Look at the sequence of images below, and it’s apparent how the bubbles separate. It begins with a thin crack where a shrinking drop begins to segment into smaller drops – top left and bottom. Then drops begins to separate, and the edges round-off along the seam in fluid manner, like a bubble. And then they separate completely, like water balloons. These are examples of shrinkage when the skin is still plastic and molds around the cooling drop of molten material.


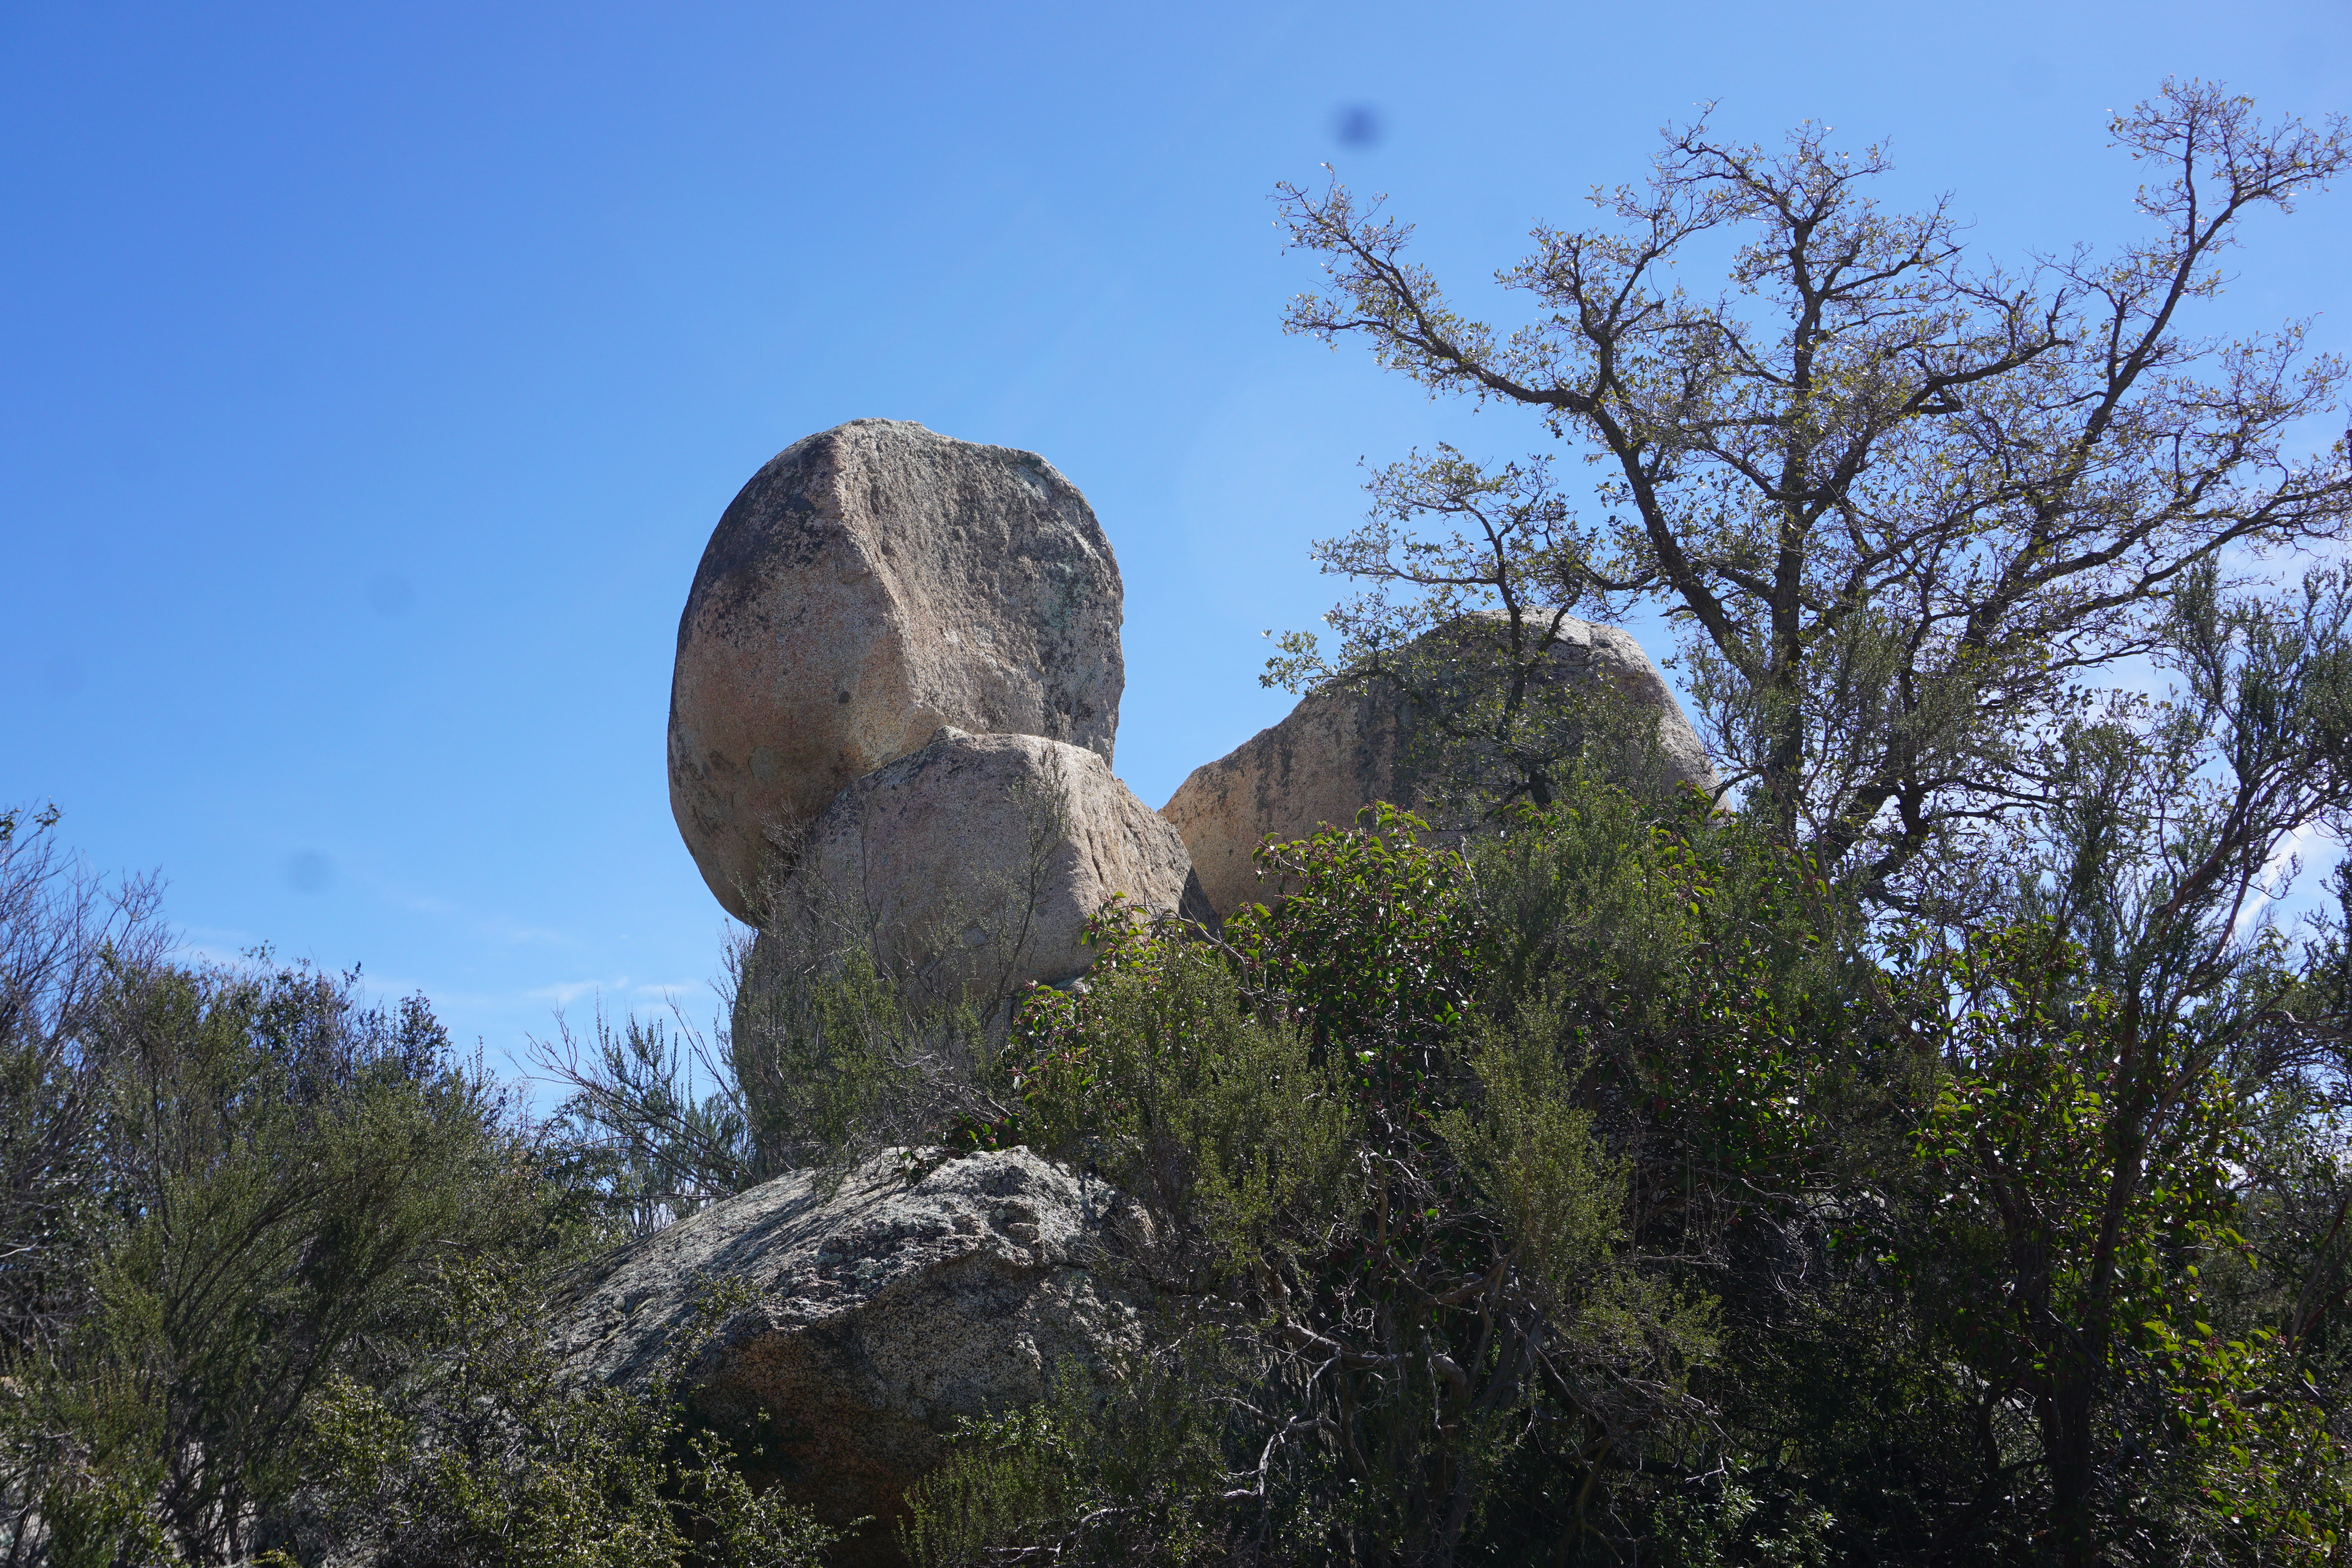
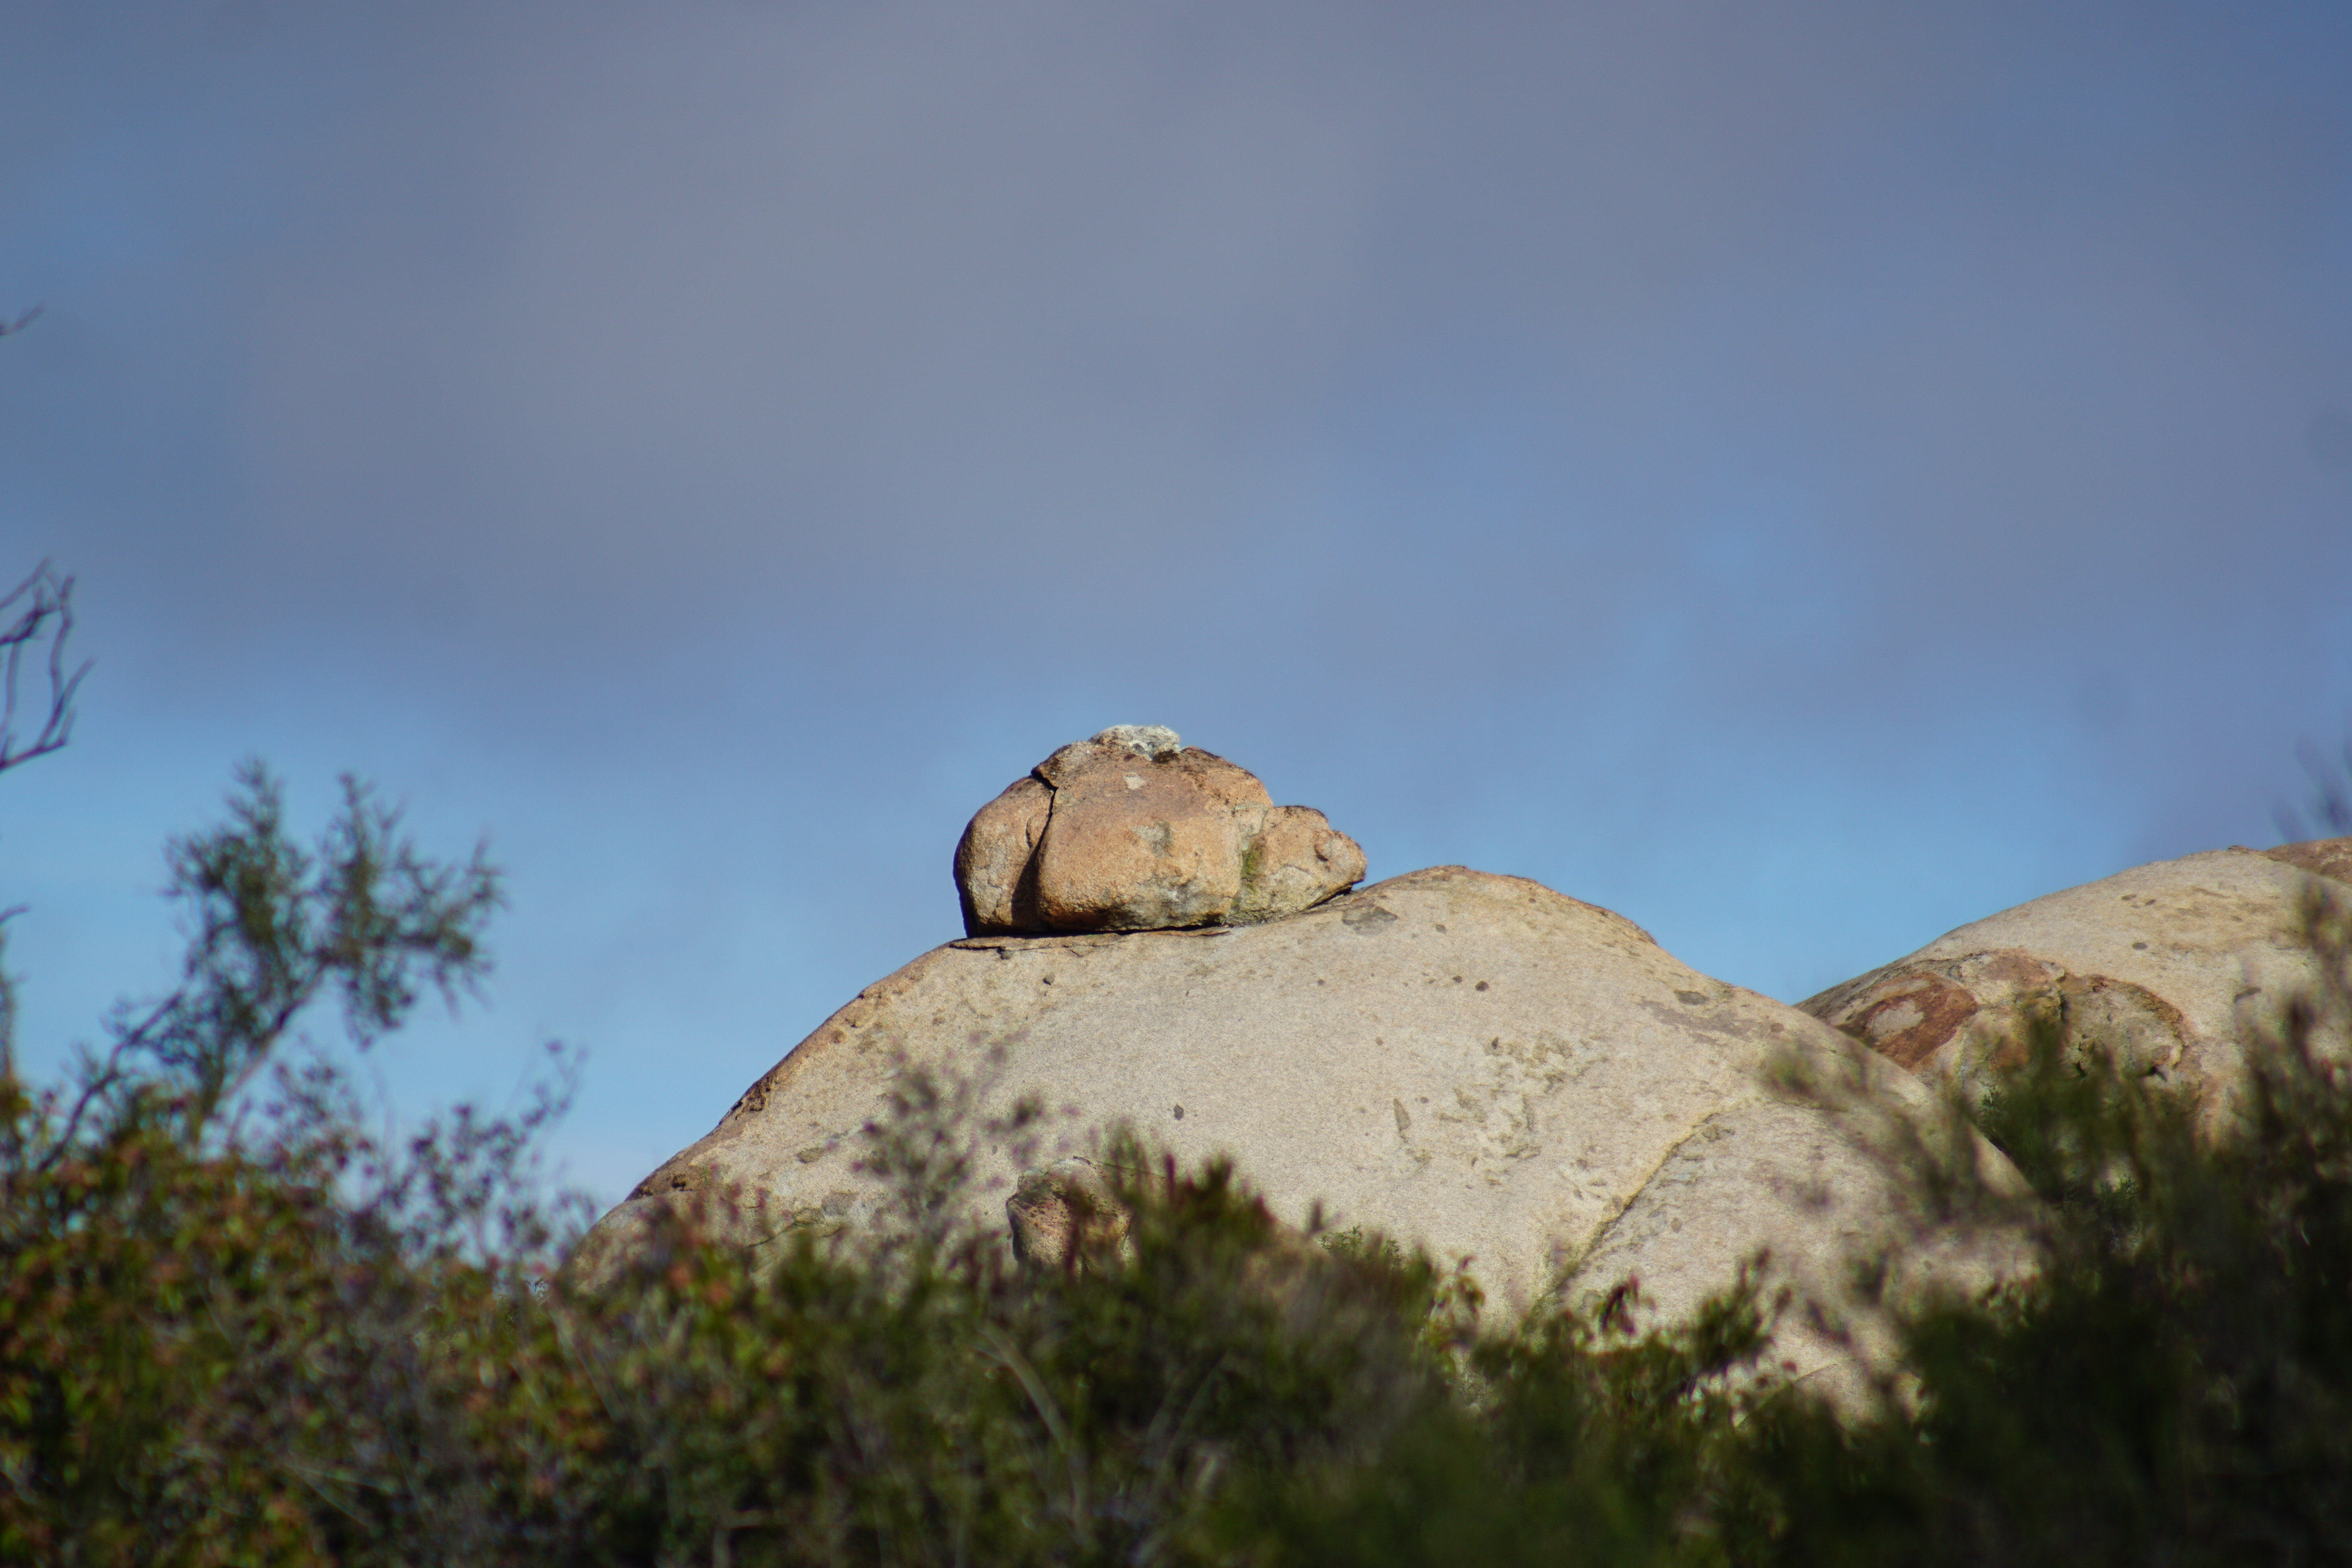
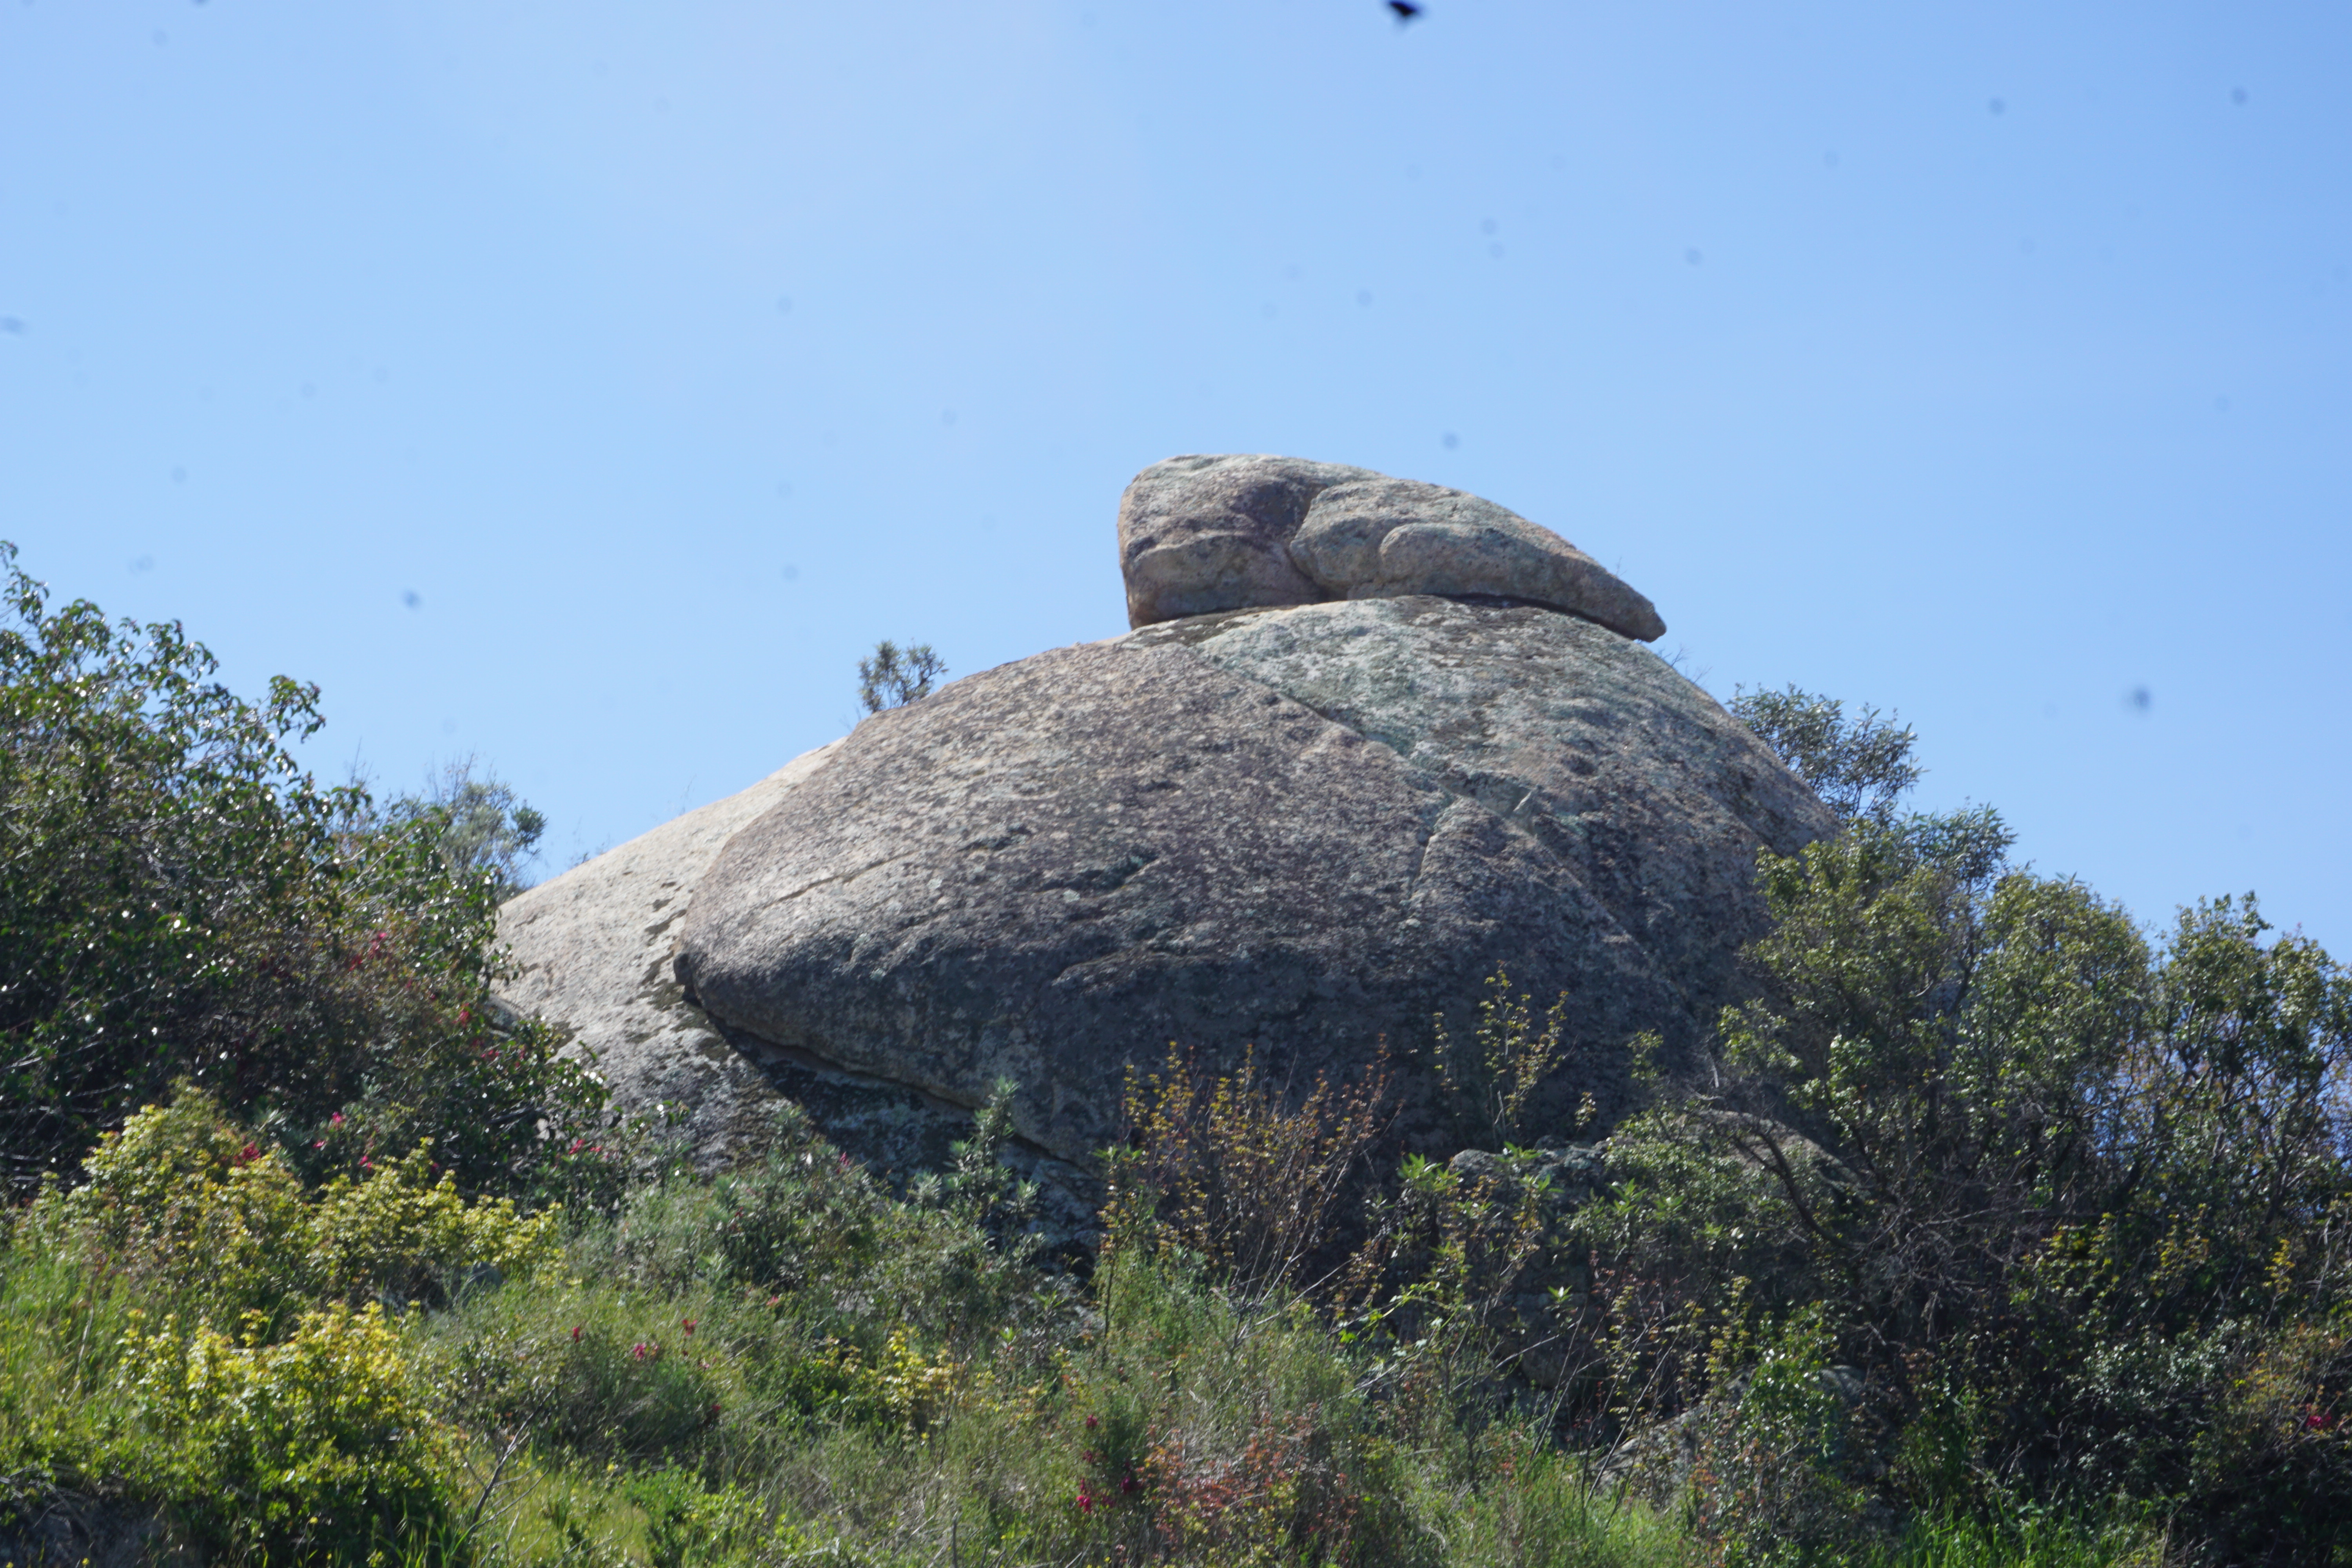
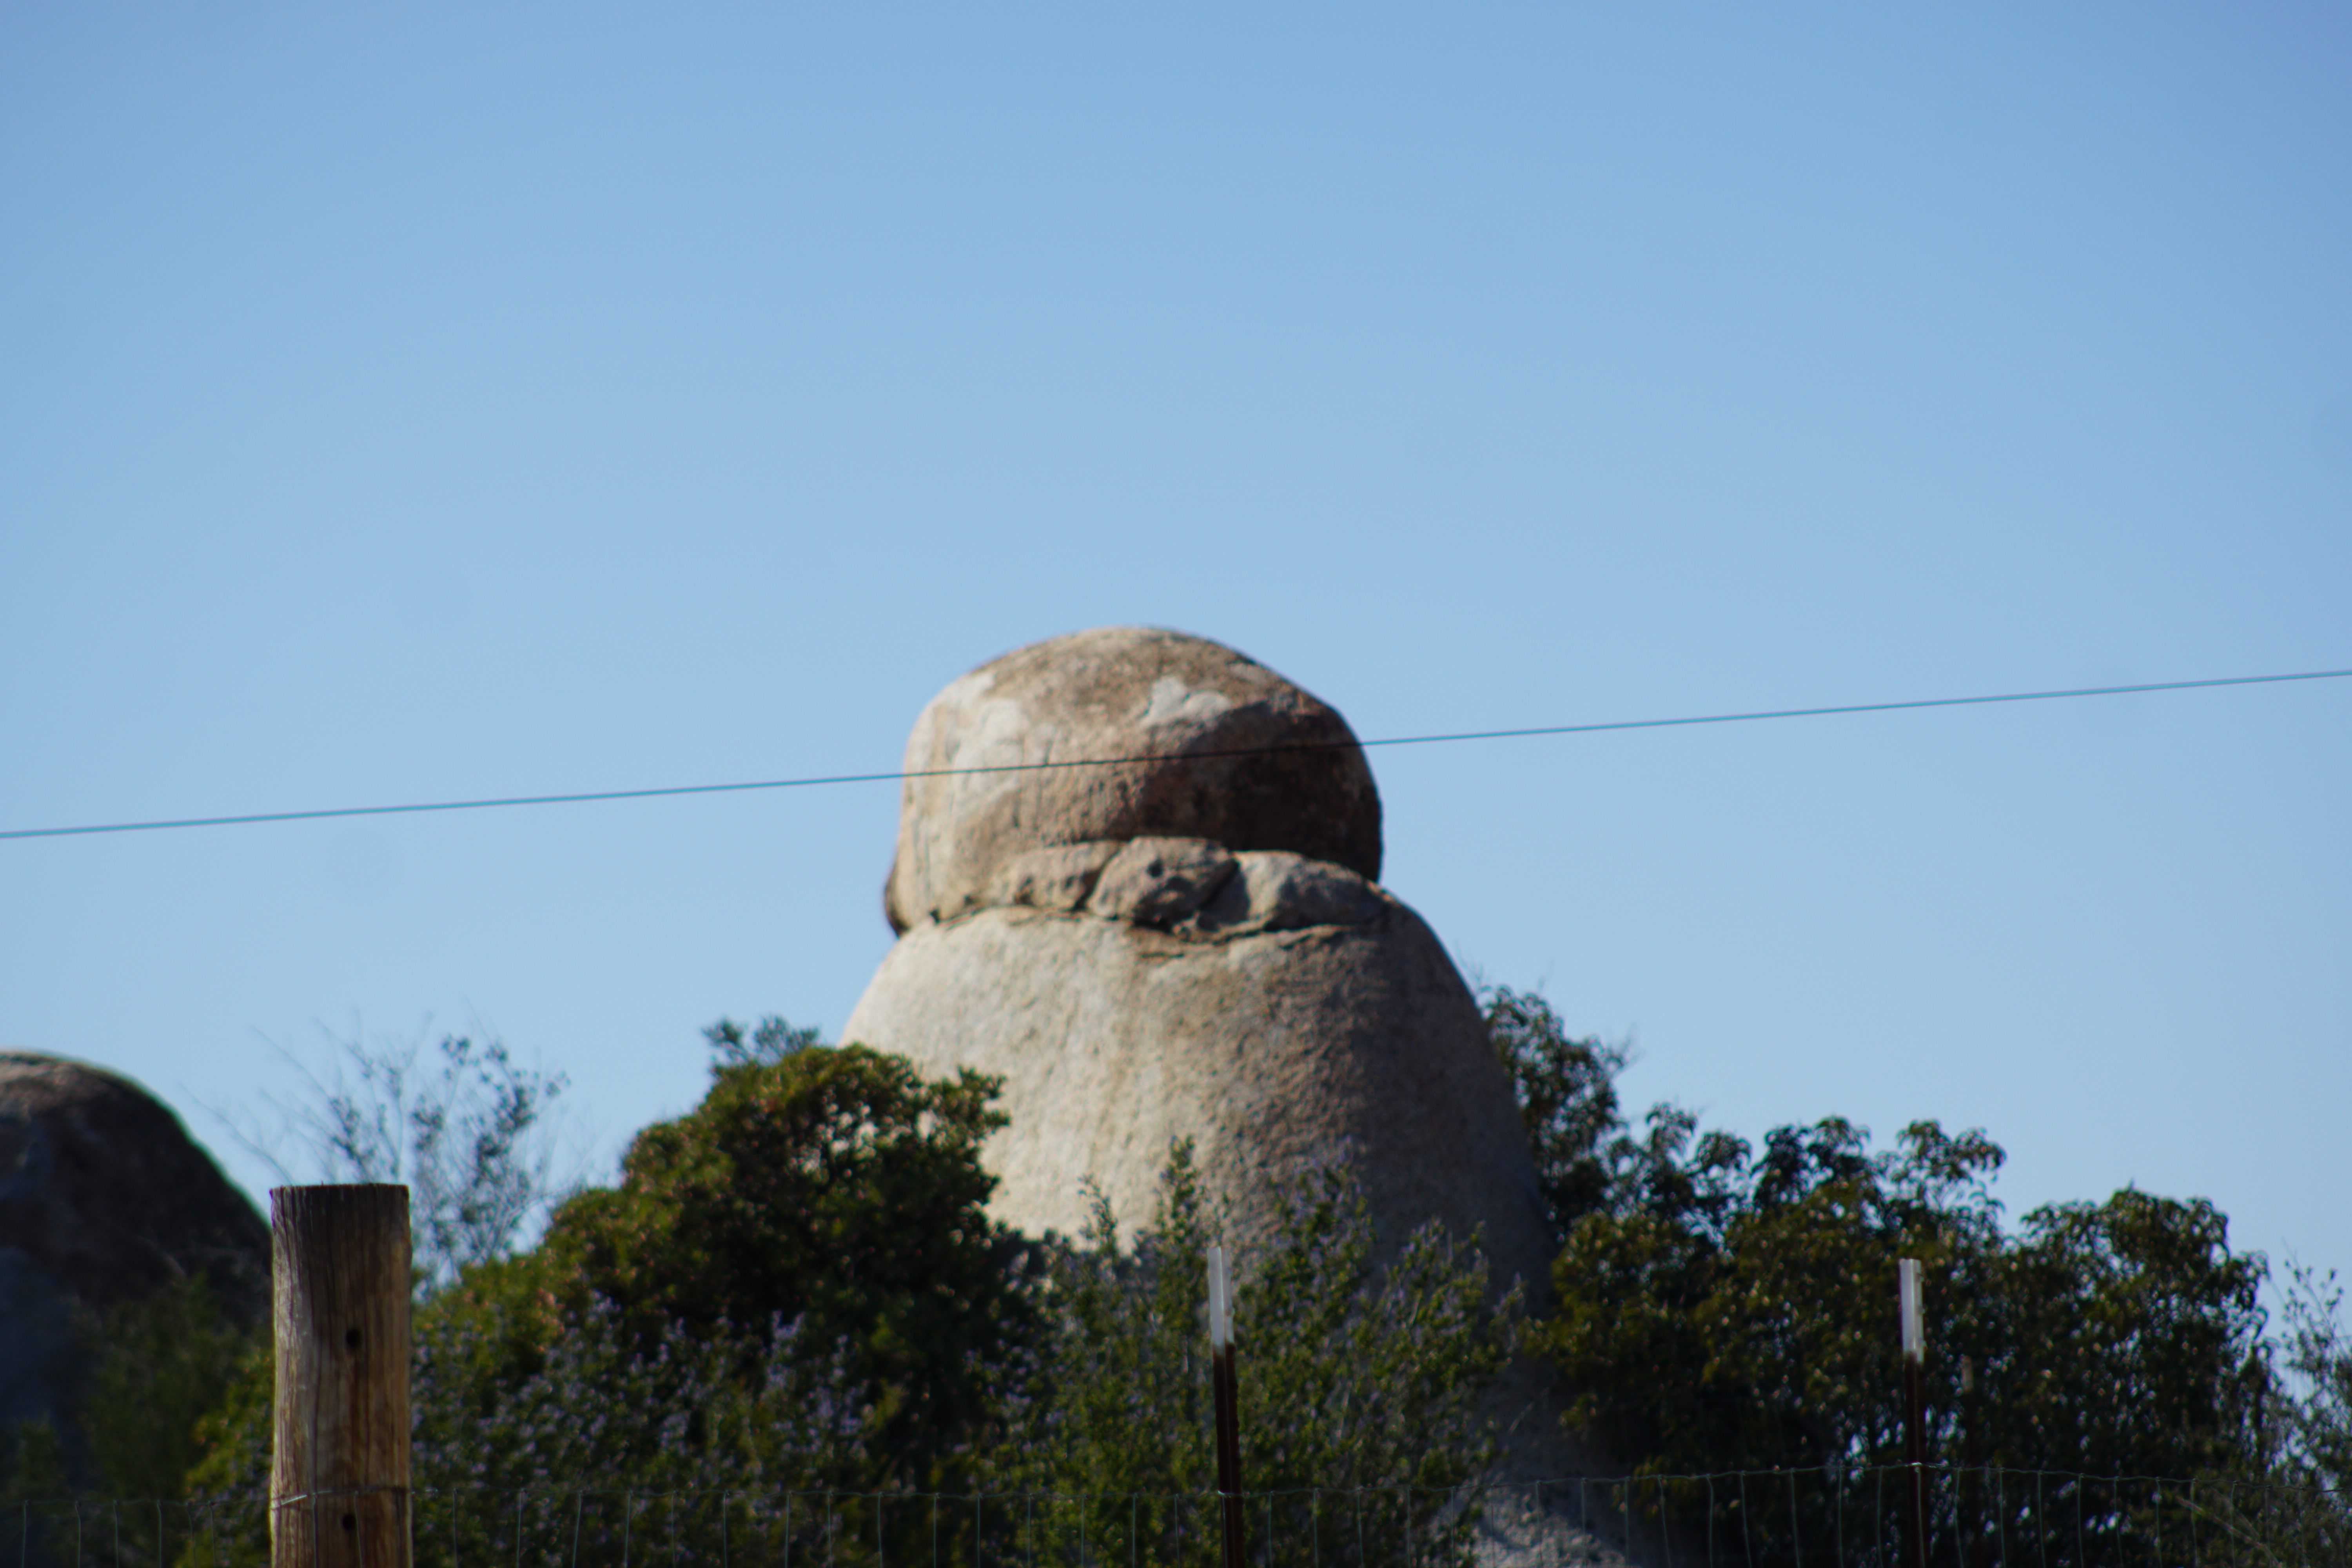
Another evidence for boils are top hats – one boulder directly atop another. Consider a viscous, molten drop where the surface rapidly cools and crystallizes to a semi-solid crust. And then more hot fluid pressures up inside, but the bubble’s crusty skin can’t expand, so fluid gushes out the thinnest skin of the bubble at the very top, thus creating a new bubble stacked atop the old. In the case of a cluster of bubbles, they can stack into columns.


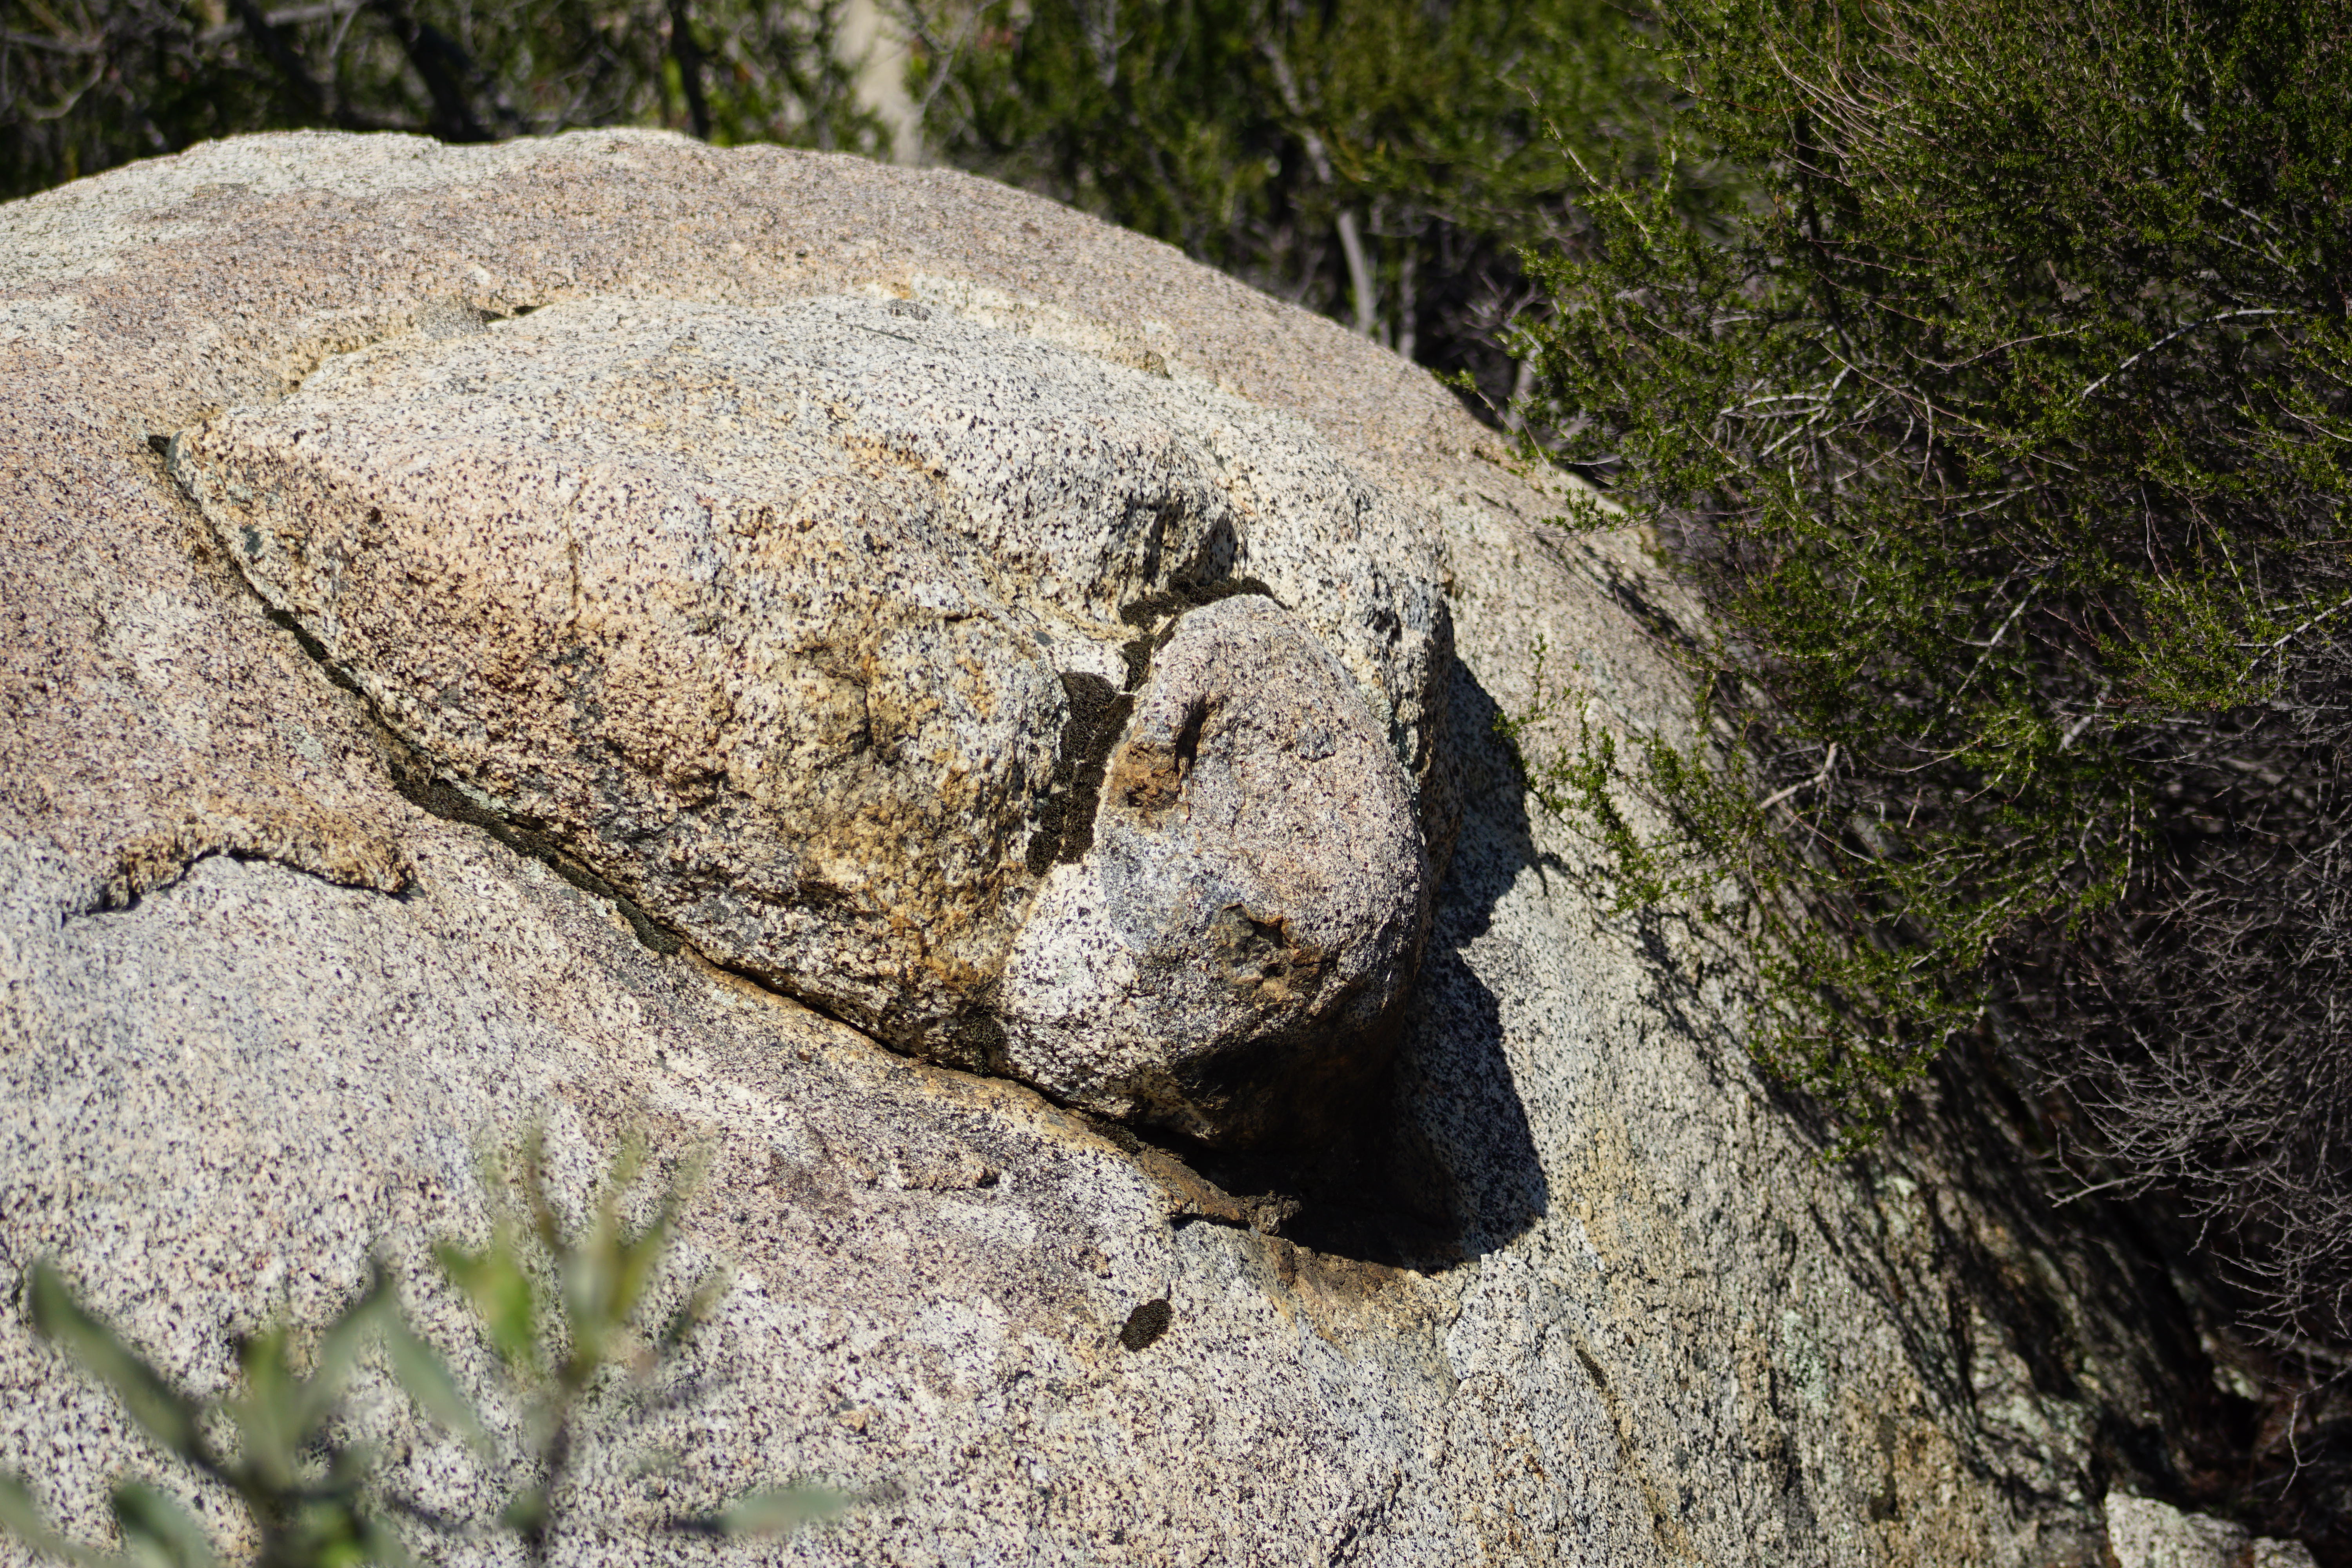
A similar feature is the necklace, where interstitial drops seep-out around the base of larger drops, forming a beaded necklace.


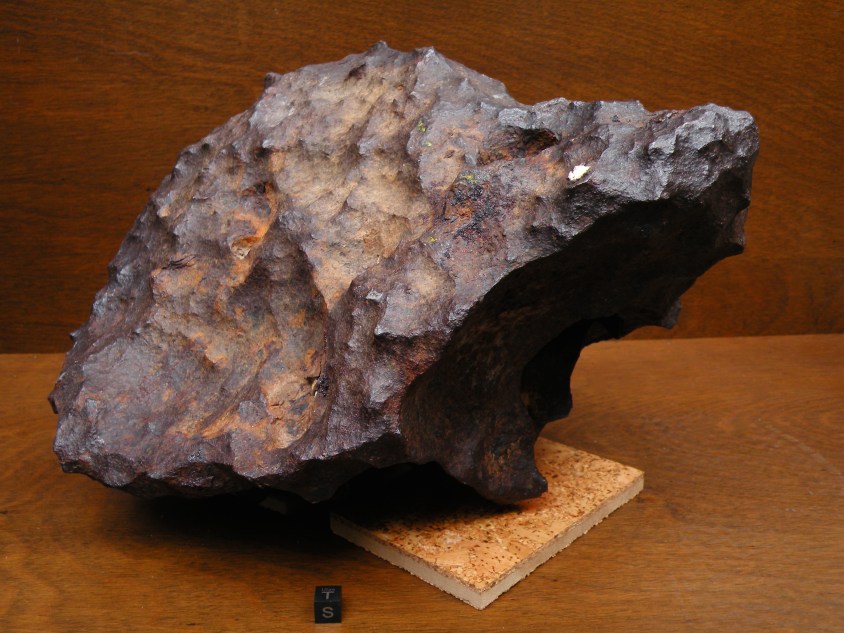
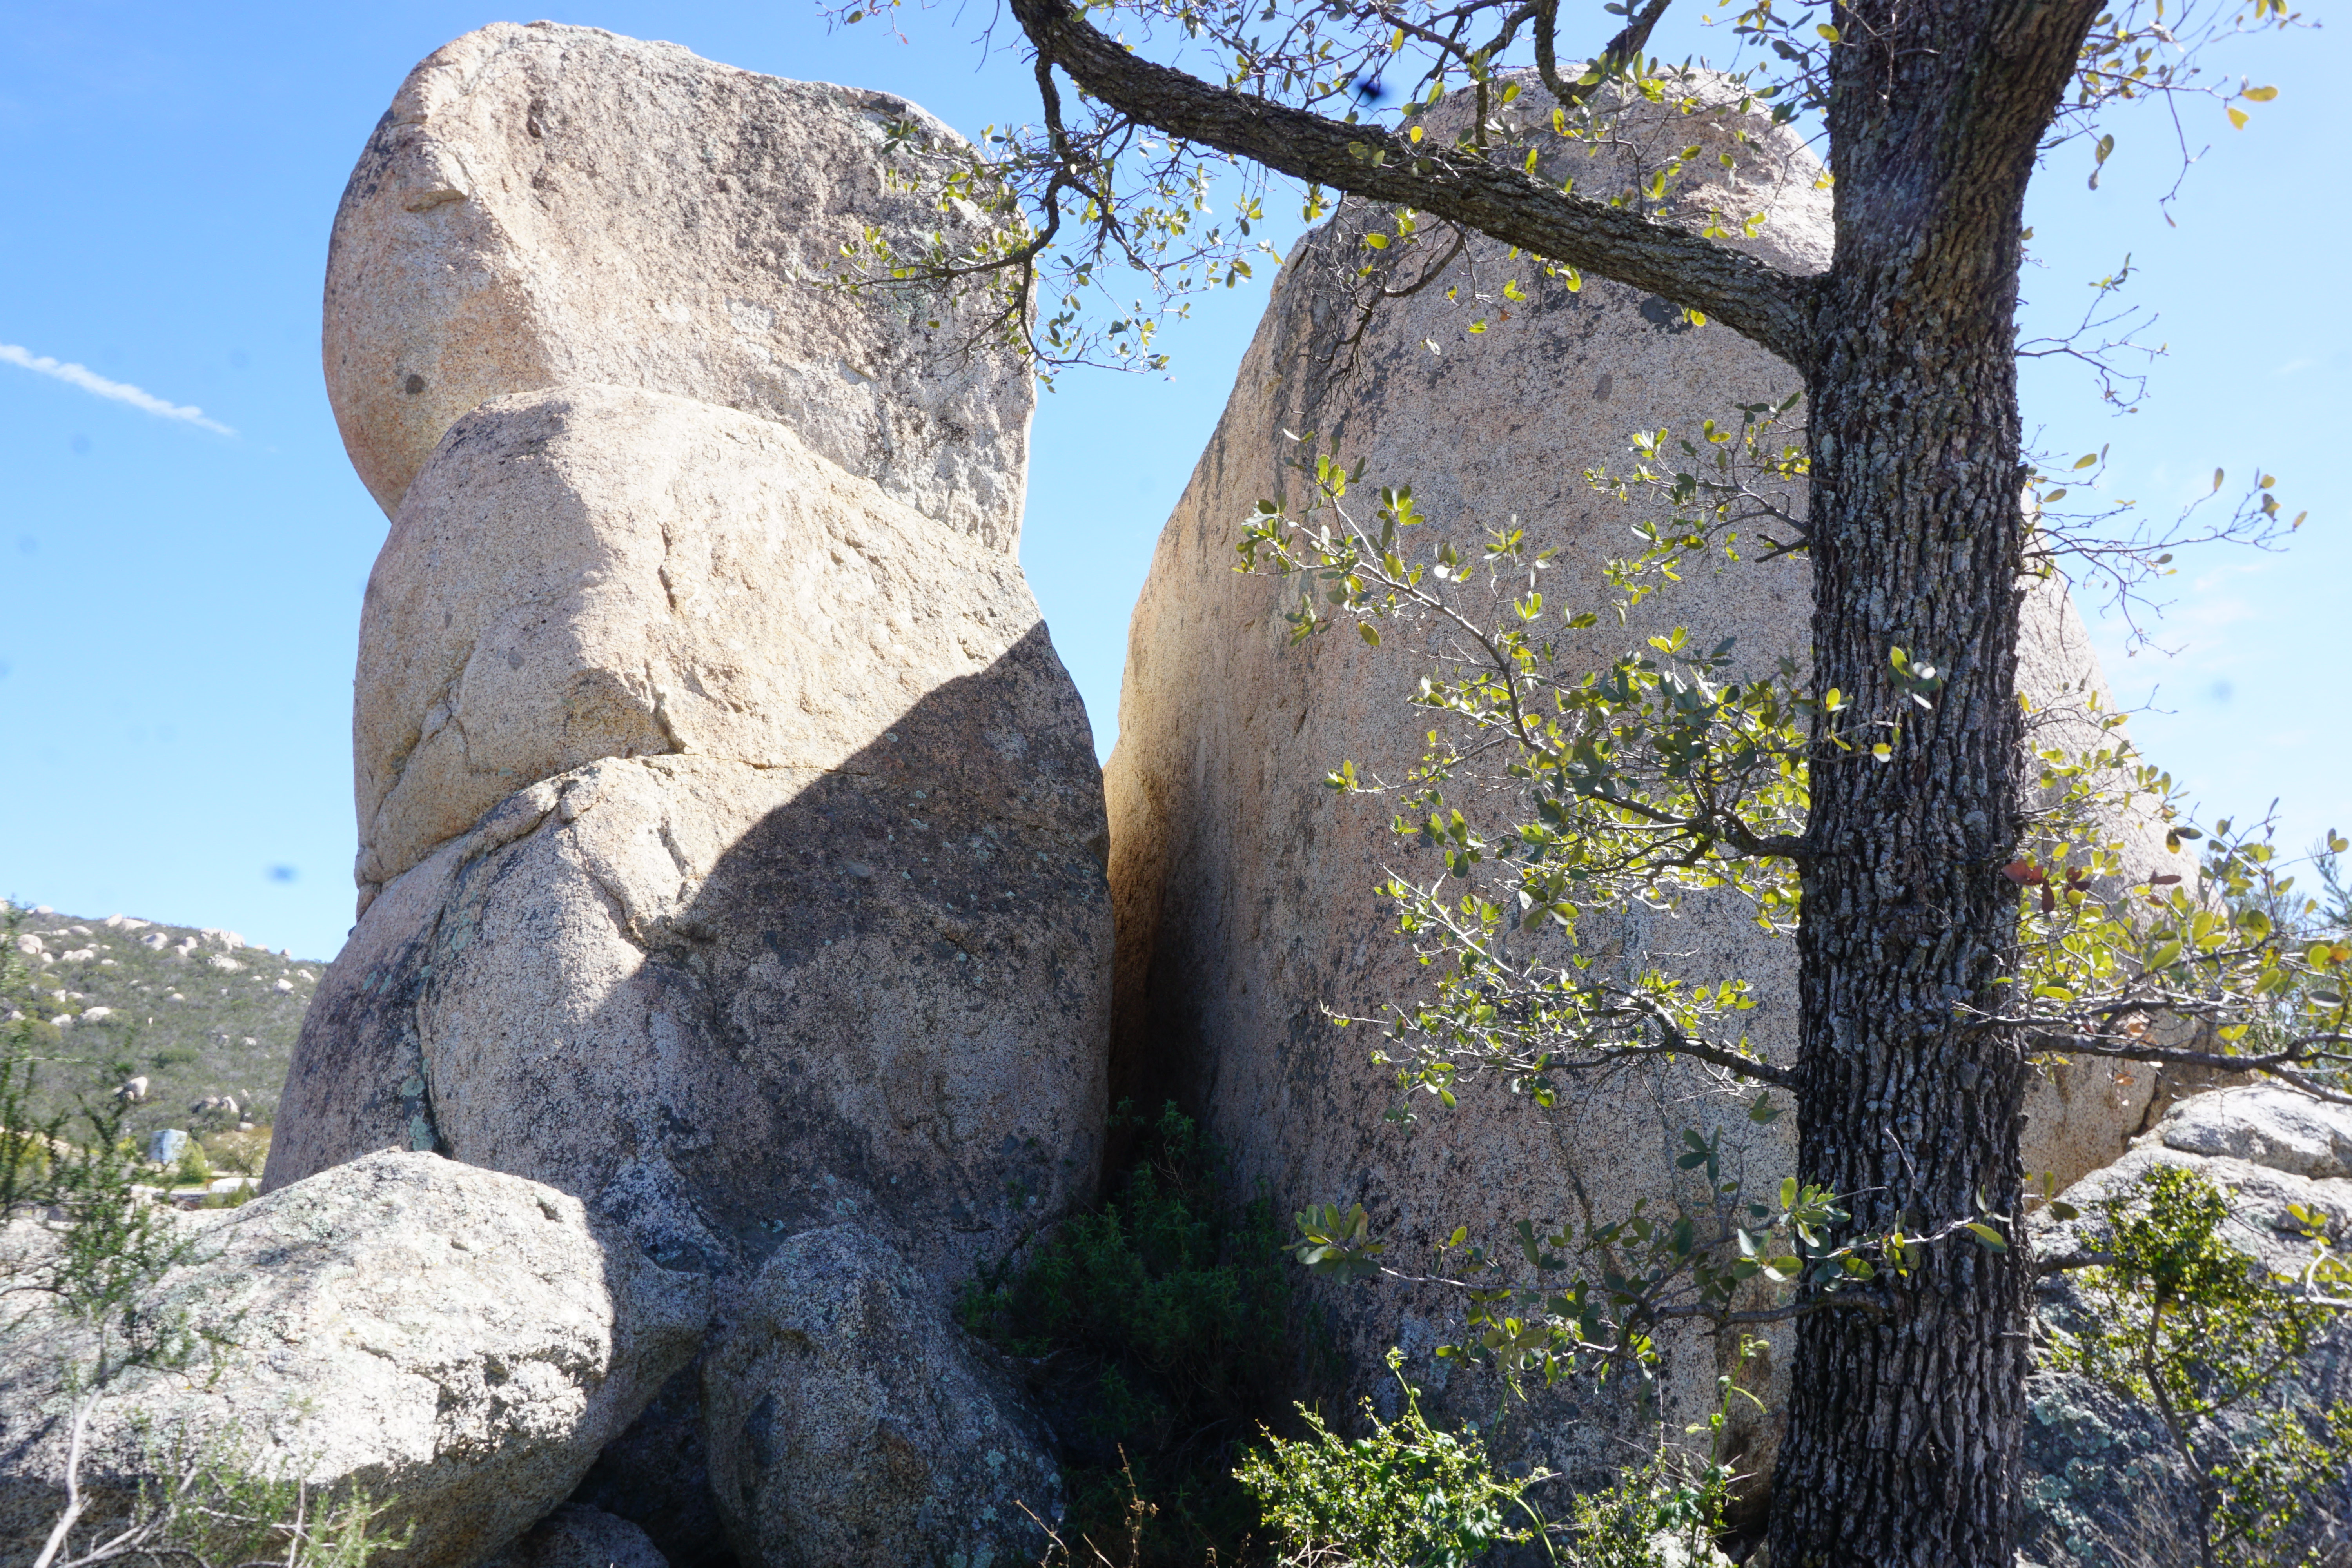
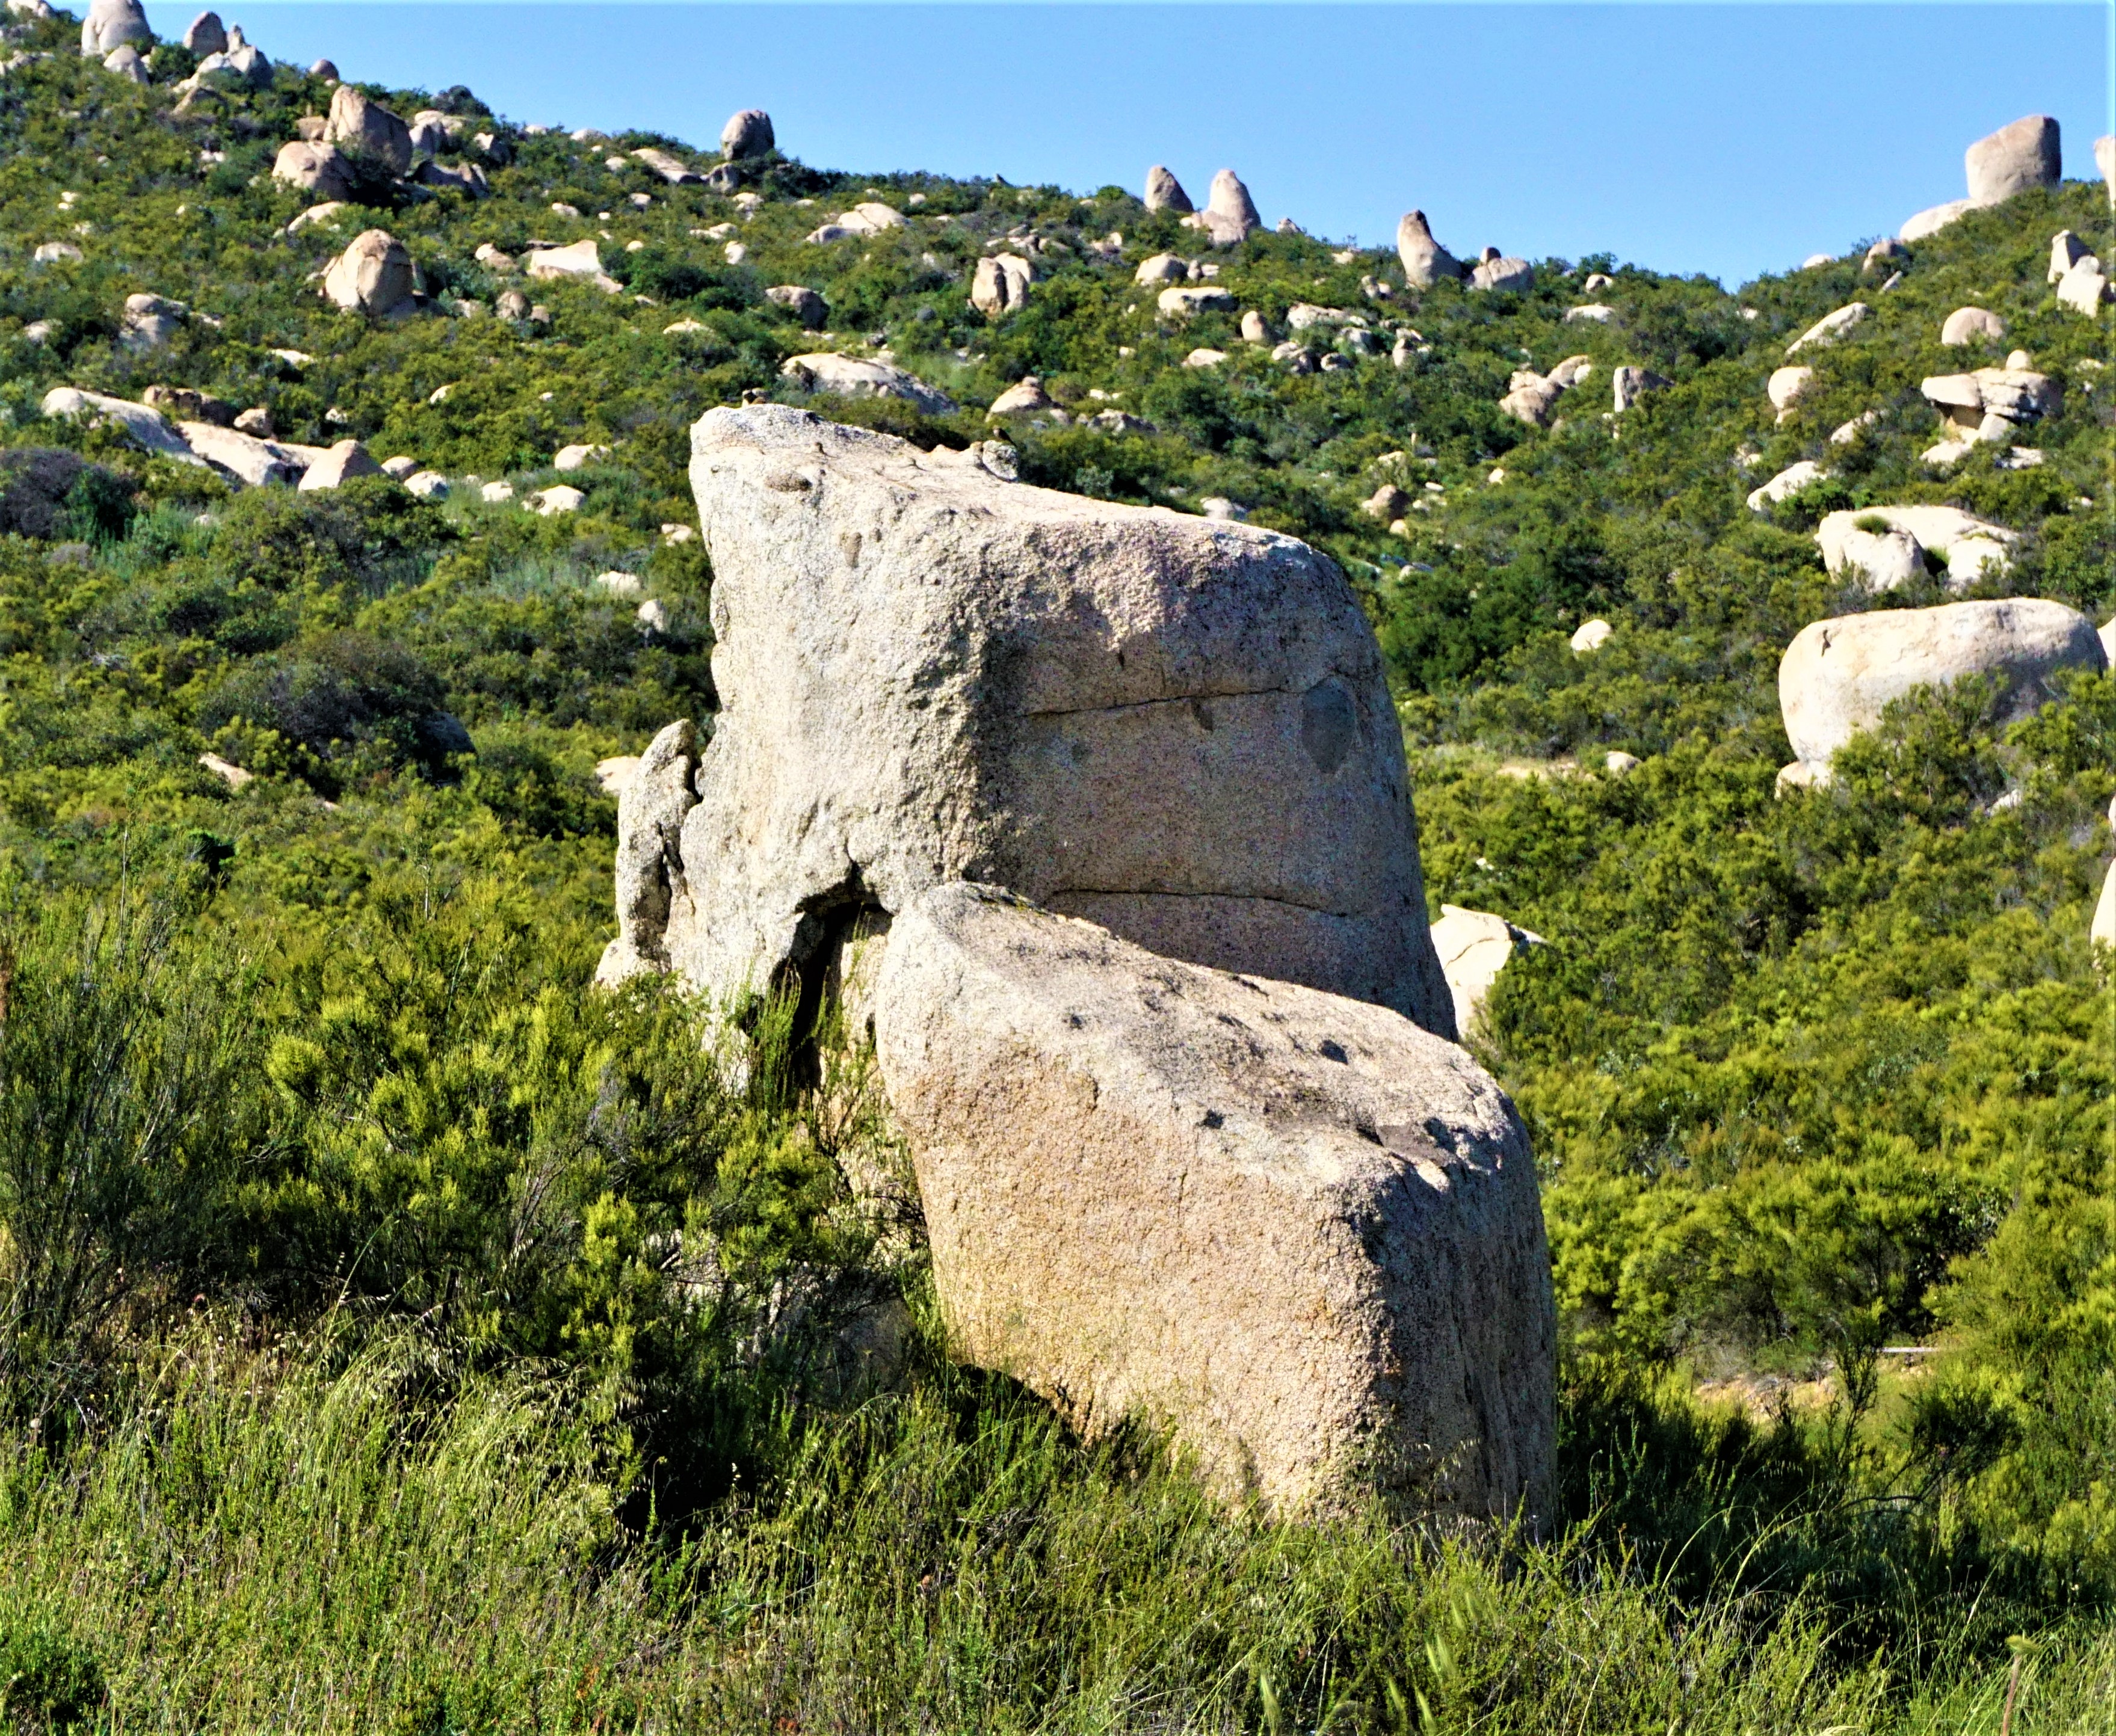
One evidence I consider irrefutable is the “water-balloon effect”. The next group of images is of the same rock structure from different angles. I’ll just point out the obvious. The top, segmented rocks were once fluid sacks, like viscous water balloons that erupted out the top of an older boil and flowed down it’s back before shrinking, segmenting and solidifying.


Opposite the dripping side of the balloon is a concave side where drops in the cluster pressed against other drops that have since fallen away.
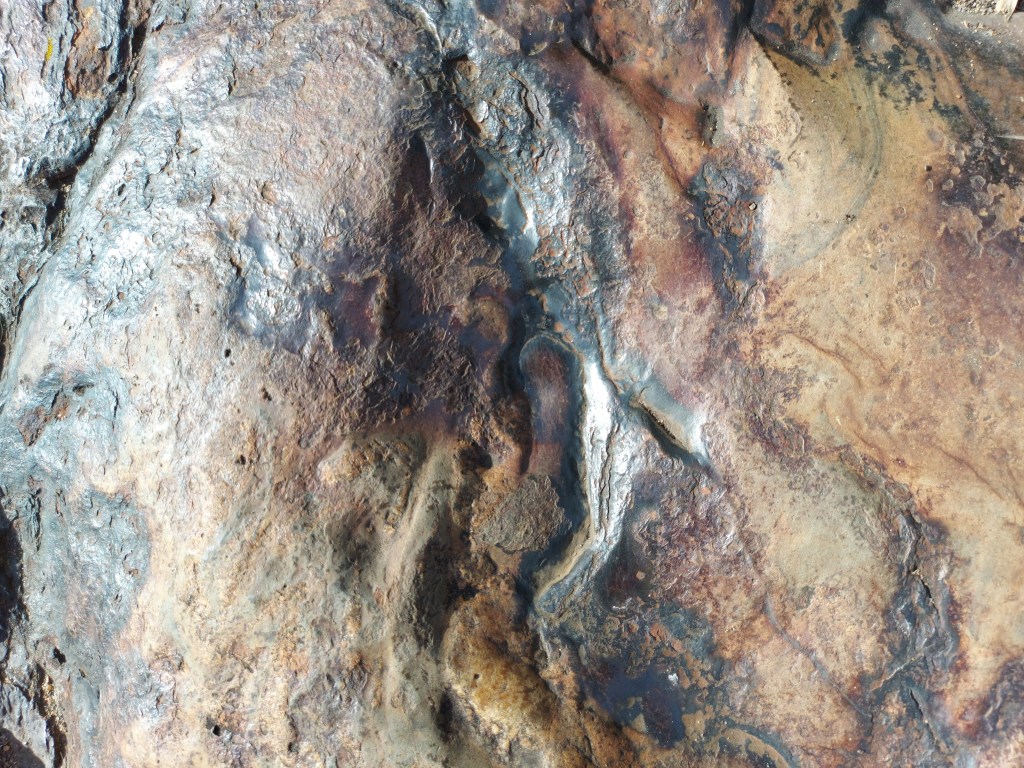
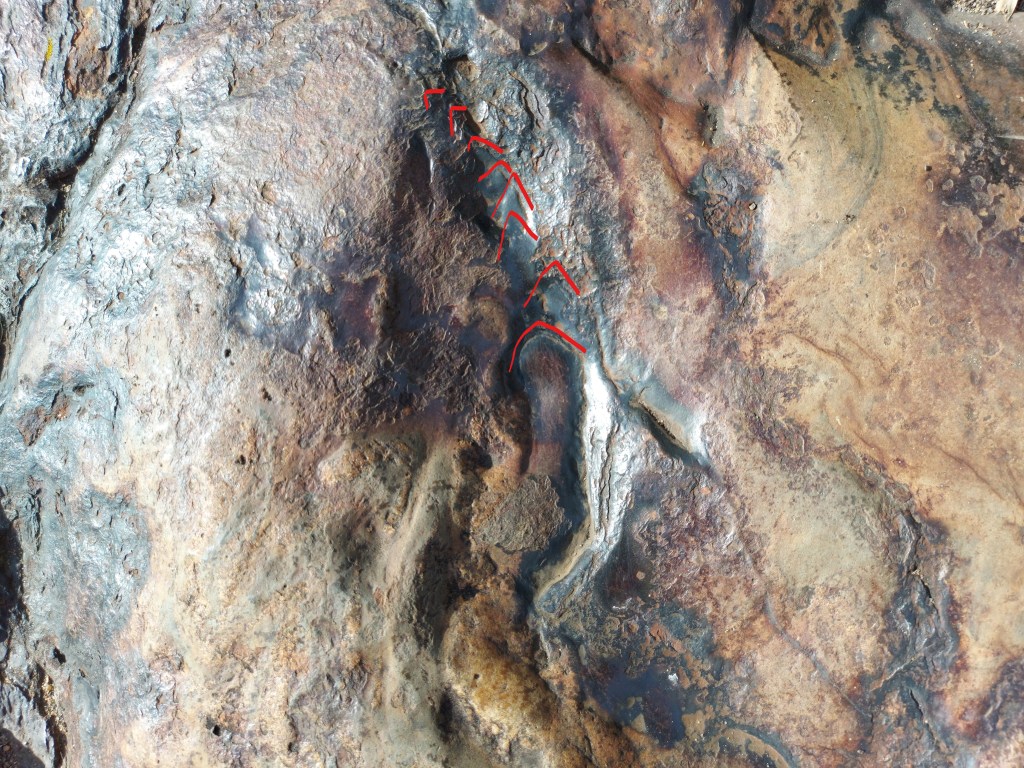
Wind, I suspect, flattened and pressed these bubbles together forcing the concavities instead of forming the more typical orthogonal cracks and separations seen in the majority of boulder clusters. The inner folds of the concavities have fluid ripples – the actual impression of turbulent waves and ripples in the separating skin between bubbles. I interpret this as an indication wind, seismic, or some other cause was vibrating the bubble.


In the following gallery are several more examples where drops in a cluster pressed together, leaving concavities beneath overhanging ‘water balloons’:


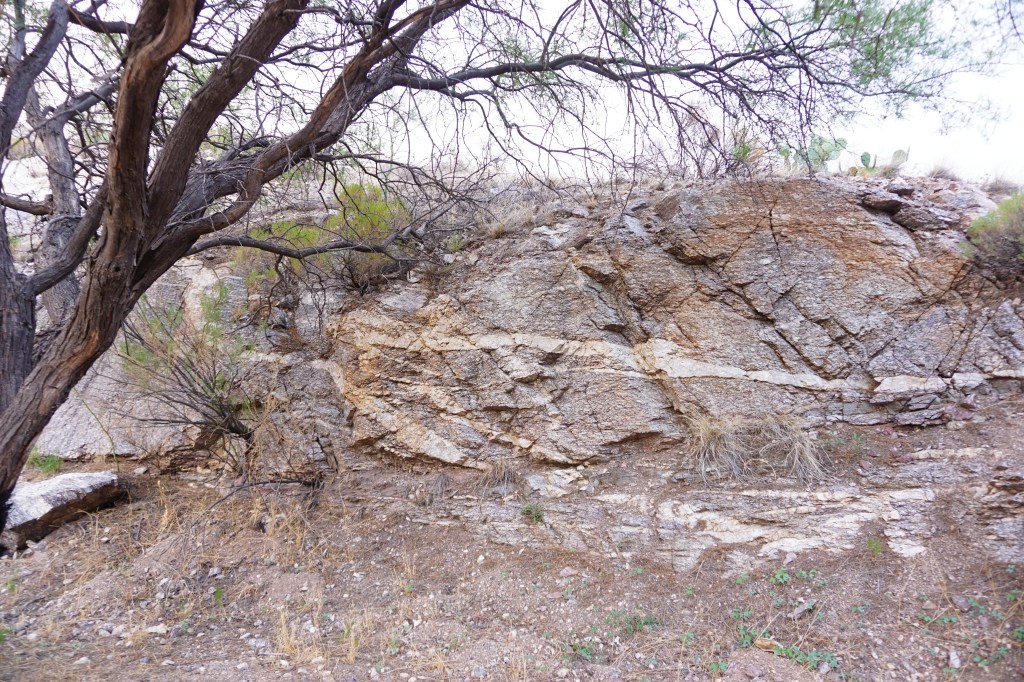
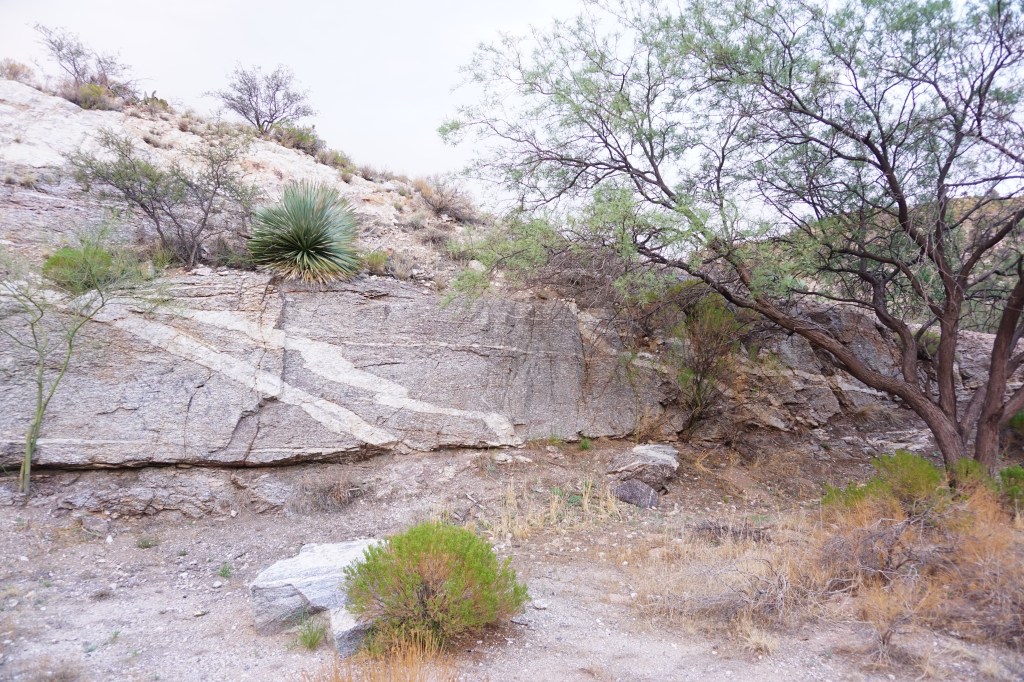
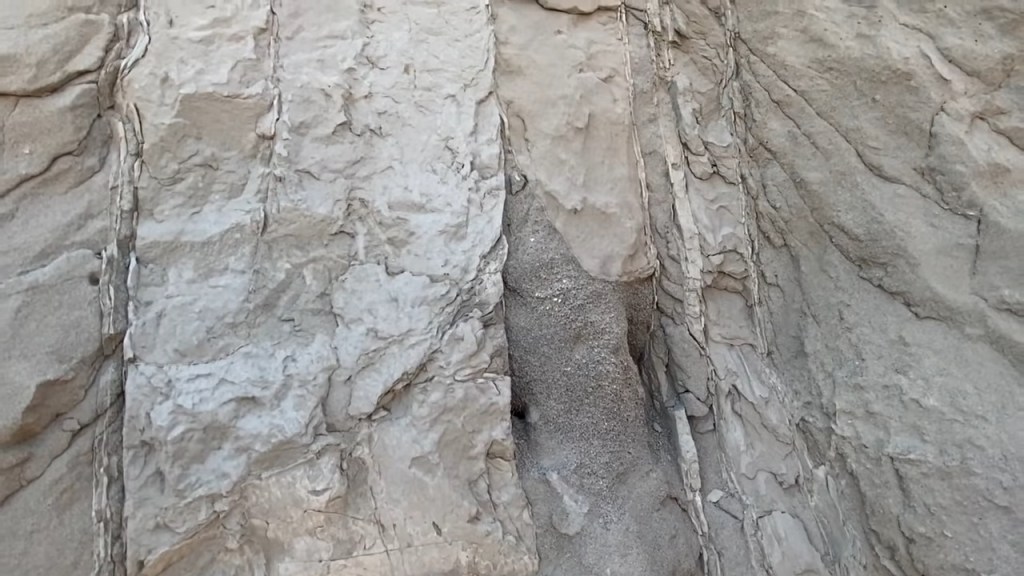
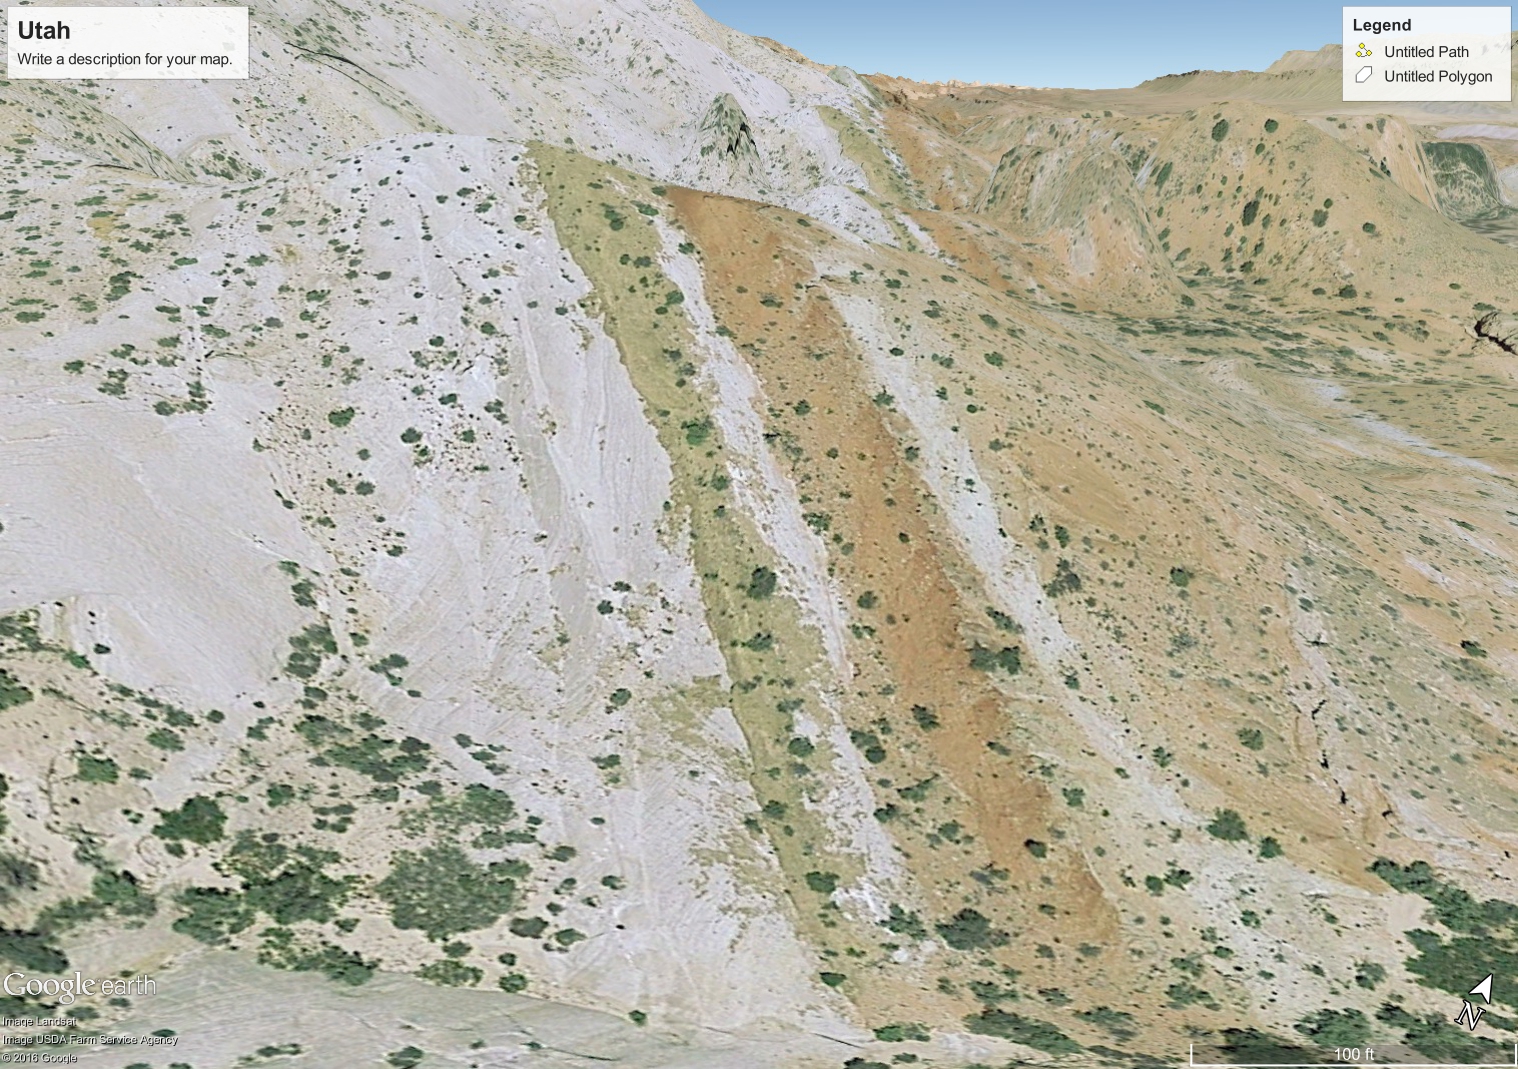
There are multiple other patterns in the rock that display fluid/drop/bubble behavior. Large waterfalls of rock can be found where a molten mass erupted from the flanks of a mountain and sheet-flowed down it’s side, like a volcanic lava flow.

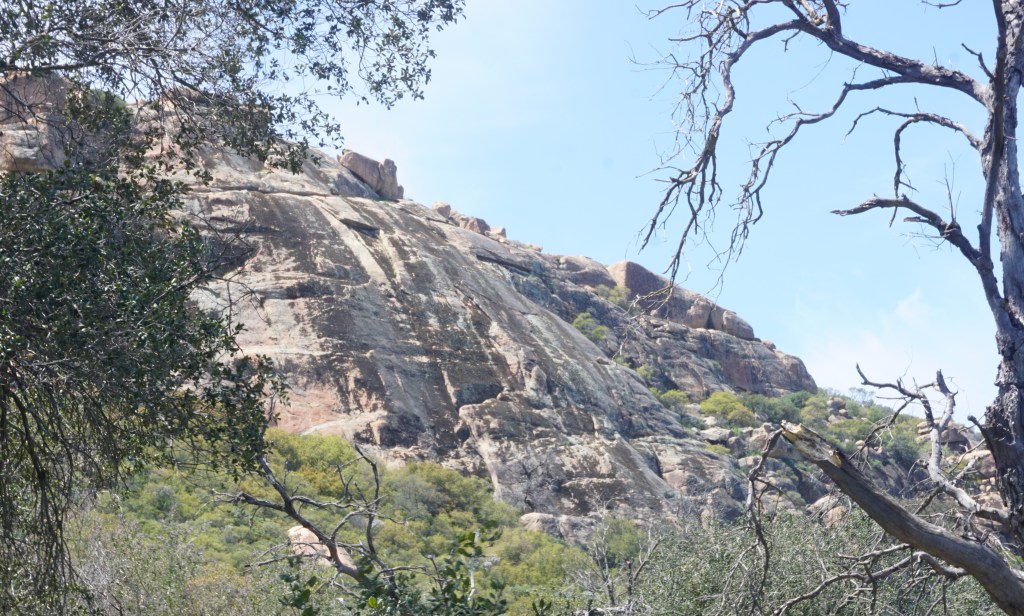
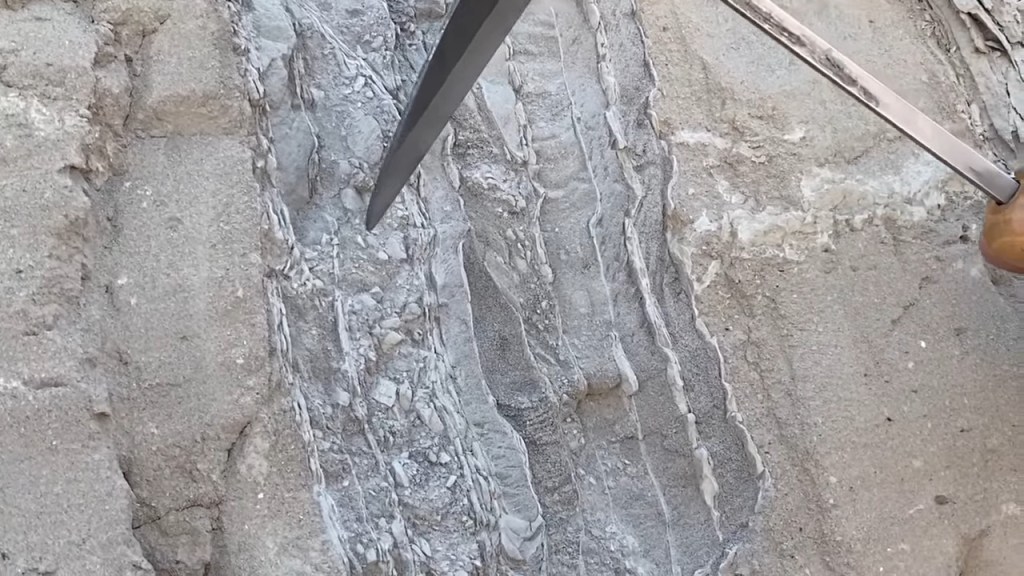
Close examination of sheet-flow patterns show even more evidence, such as the appearance of standing waves.


The pattern of a viscous river shows where flows joined to form standing waves:


Looking at the foot of the granite flow, it resembles the foot of a glacier, or lava flow:


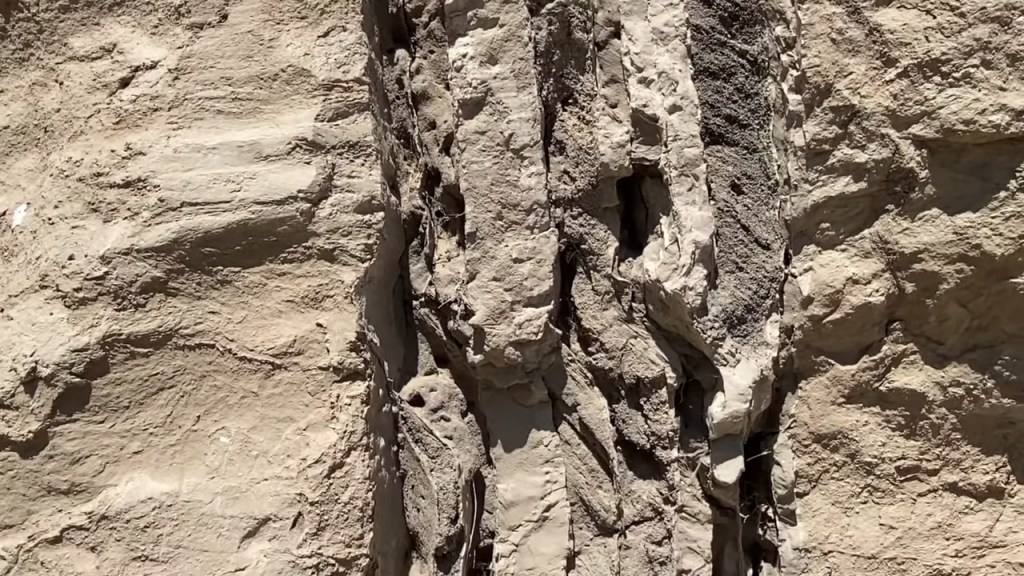
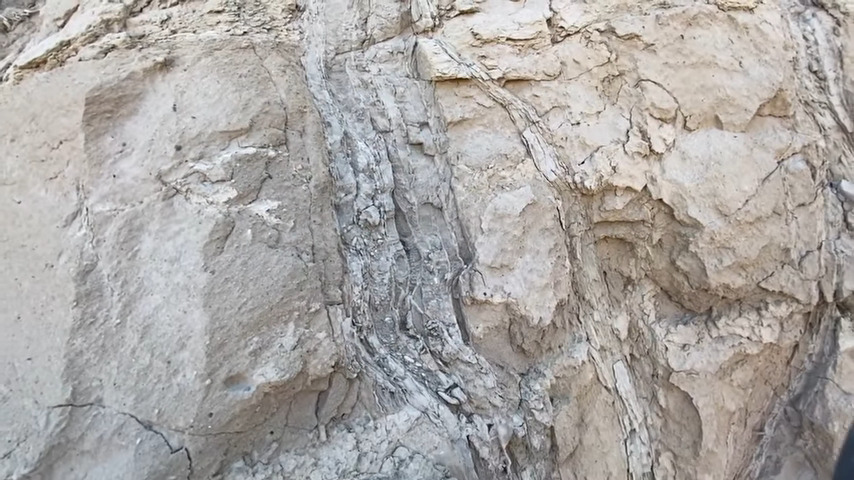
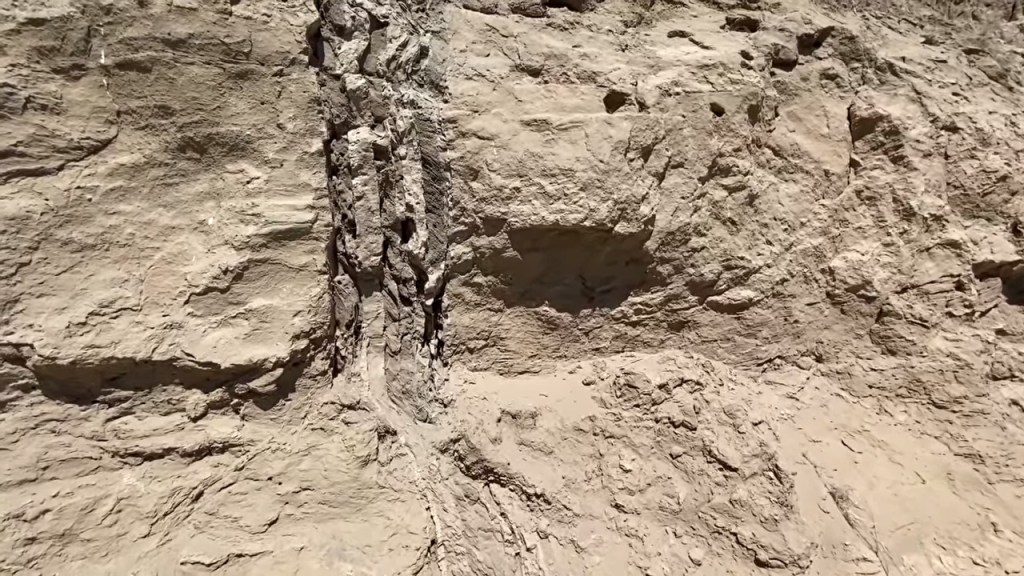
Perhaps the most compelling, singular example the rock formed as a boiling fluid, and suddenly froze when exposed to the atmosphere is shown in the next example. Here, liquid rock has poured out the side of a pillar and froze like a faucet of running water.

This next photo shows the same thing – a pouring outflow from a standing column:

Like injection molds, the rocks have nubs and tubular pour spouts where fluid passed between cell structures:


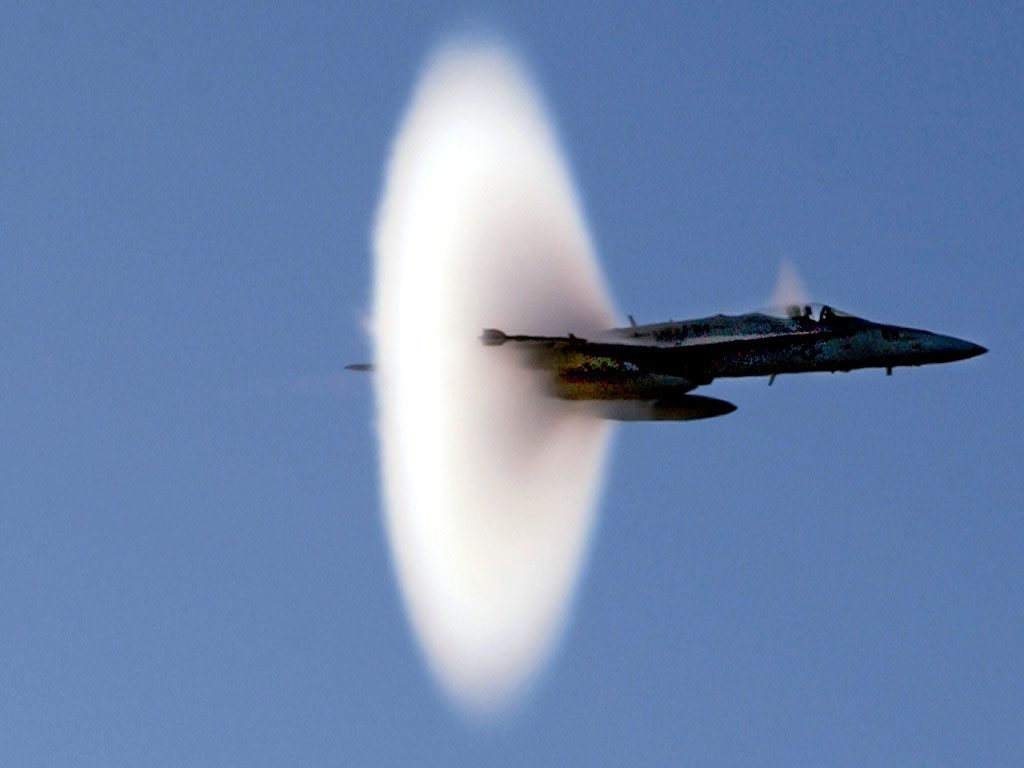
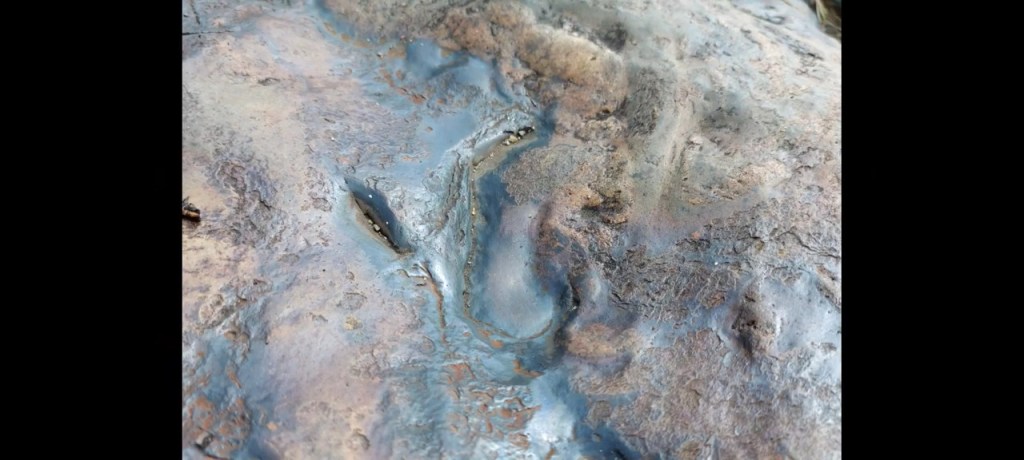
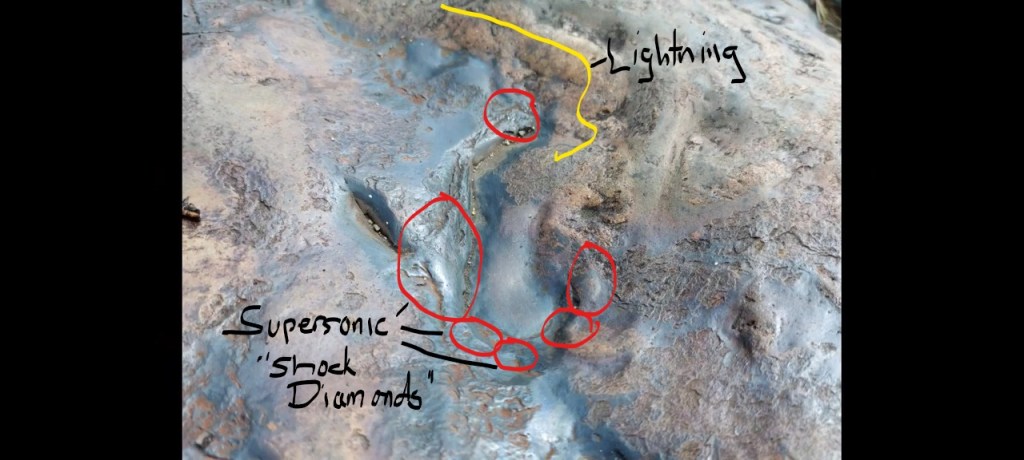
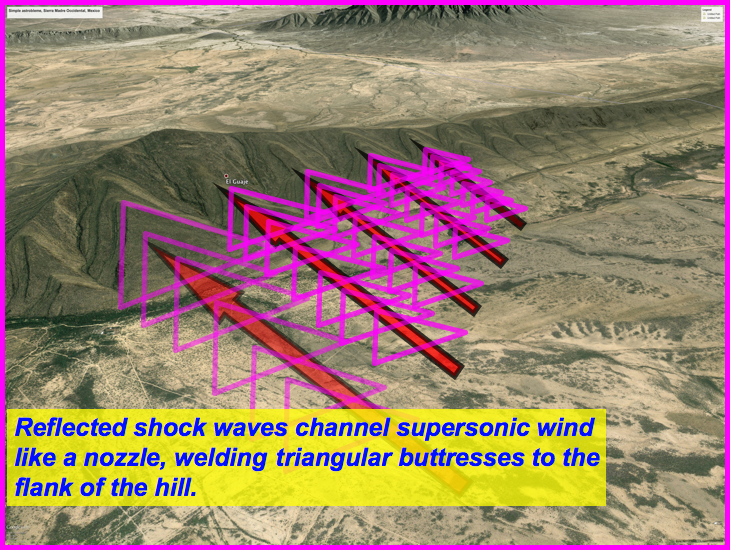
There is something to be said about the regularity of how rocks section in proportion to their volume, as if there were a frequency causing a harmonic response in the body of the rock. It could be a seismic vibration from the fluidized, boiling cauldron itself, or it could be from sonic shock due to atmospheric winds. It’s also possible that the piezoelectric effect of current in the crystallizing skin of the boils caused vibration.


Many questions remain to be answered about how this rock formed. The atomic and chemical reactions are complex given the unknown amounts of current and potential involved, the profusion of elements involved and the unknown state of Earth’s atmosphere. Even Earth’s orbit and what it orbited around at the time these rocks formed is unknown.
One thing for sure, however, these rocks formed in atmospheric pressure. There is no possible way these shapes were produced while confined deep underground. Nor is it possible they were produced by any form of erosion. The forms were caused by a viscous, plastic fluid confined only by surface tension. Their shape is self evident. There is no argument that can be made to deny it. They look like drops and bubbles because they are.
There is a reason boulders boiled from the Earth east of San Diego. To understand how this happened, Part 2 of the Granite Cauldron will look at the mountains themselves and how they formed.